Sources and pathways of nutrients to the Baltic Sea - HELCOM PLC-6 - Baltic Sea Environment Proceedings No. 153
←
→
Page content transcription
If your browser does not render page correctly, please read the page content below

Baltic Sea Environment Proceedings No. 153

      Baltic Marine Environment Protection Commission

Sources and pathways of
nutrients to the Baltic Sea
               HELCOM PLC-6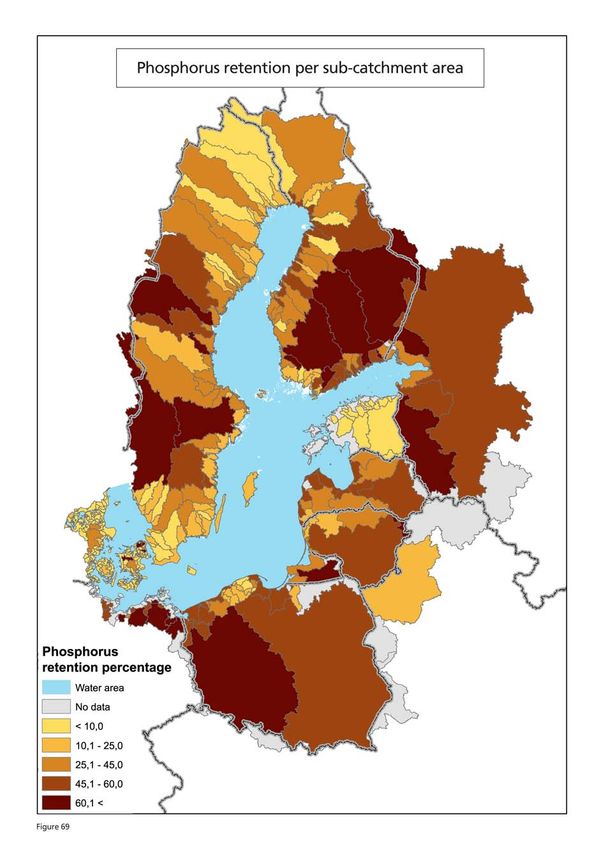
Published by:
Helsinki Commission
Katajanokanlaituri 6 B FI-00160 Helsinki, Finland
http://www.helcom.fi

Authors:
Lars Sonesten (SLU, Sweden), Lars M. Svendsen (DCE, Denmark), Henrik Tornbjerg (DCE, Denmark),
Bo Gustafsson (BNI, Sweden), Dmitry Frank-Kamenetsky and Juuso Haapaniemi (HELCOM).

Contributors, HELCOM PLC-6 project members:
Wera Leujak (UBA, Germany), Peeter Ennet (EEA, Estonia), Seppo Knuuttila (SYKE, Finland), Ant-
ti Räike (SYKE, Finland), Dietmar Koch (UBA, Germany), Ilga Kokorite (LEGMC, Latvia), Svajunas
Plunge (EPA, Lithuania), Weronika Brynska (NWMA, Poland), Natalia Oblomkova (Institute for Engi-
neering and Environmental Problems in Agricultural Production, Russia), Helene Ejhed (IVL, Sweden),
Julia Hytteborn (Statistics Sweden).

Acknowledgements:
Personal thanks to Jerzy Bartnicki (W-MSC EMEP, Norway) for the contribution to the publication
with regard to information on the sources of atmospheric deposition of nitrogen.
The PLC-project team and authors thank Pekka Kotilainen (SYKE, Finland) and Alexander Sokolov
(BNI, Sweden) for data processing, elaboration and maintenance of the data reporting and handling
tools for the HELCOM PLC water database.
The document was reviewed, commented and endorsed by HELCOM Working Group on Reduction
of Pressures from the Baltic Sea Catchment Area (PRESSURE).

For bibliographic purposes this document should be cited as:
HELCOM, 2018. Sources and pathways of nutrients to the Baltic Sea.
Baltic Sea Environment Proceedings No. 153

Information included in this publication or extracts thereof is free for citing on the condition that
the complete reference of the publication is given as stated above.

Copyright 2018 by the Baltic Marine Environment Protection Commission – Helsinki Commission

Design and layout: Yksinolla Branding, Helsinki, Finland
Language check: Kate Ravilious
Cover photo: Rodion Kutsaev, Unsplash.com
Number of pages: 48
ISSN 0357-2994
Preface
Eutrophication caused by oversupply of the Baltic Sea by nutrients remains the major environmen-
tal pressure on the marine ecosystem. In order to mitigate eutrophication, HELCOM countries have
agreed on a joint effort to reduce nutrient load on the marine ecosystem, reflected in the HELCOM Bal-
tic Sea Action Plan as a nutrient input reduction scheme. Compilations of pollution load data, designed
to follow up on the implementation of the scheme, have been an integral part of the HELCOM assess-
ment system since 1987. This assessment of major sources and pathways of nitrogen and phosphorus
into the marine environment is a vital part of the HELCOM Pollution Load Compilation (PLC) and one
of the main products of the HELCOM Sixth Pollution Load Compilation project (PLC-6). The product in-
cludes an assessment of three major pathways of nutrients – riverine, airborne and via direct sources –
and more detailed assessment of sources of riverine load. The previous (PLC-5) assessment, published
in 2013, was based on the data on nutrient inputs in 2006. Current assessment illustrates the con-
tribution of various sources of nitrogen and phosphorus into total loads in 2014 (2012 for Germany
and Poland). The assessment also illustrates changes in proportion of different pathways since 1995.

Contents

Changes in the main nitrogen sources and pathways			                                            4
Changes in the main pathways of nitrogen input				                                              4
Changes in the main pathways of phosphorus input			                                             10

Sources of riverine nitrogen and phosphorus to the Baltic Sea                                   17
Sources of riverine nutrient loads in the Baltic Sea area			                                    17
Country-wise distribution of sources of nutrient loads			                                       21
Area-specific losses and retention						26

                                                  3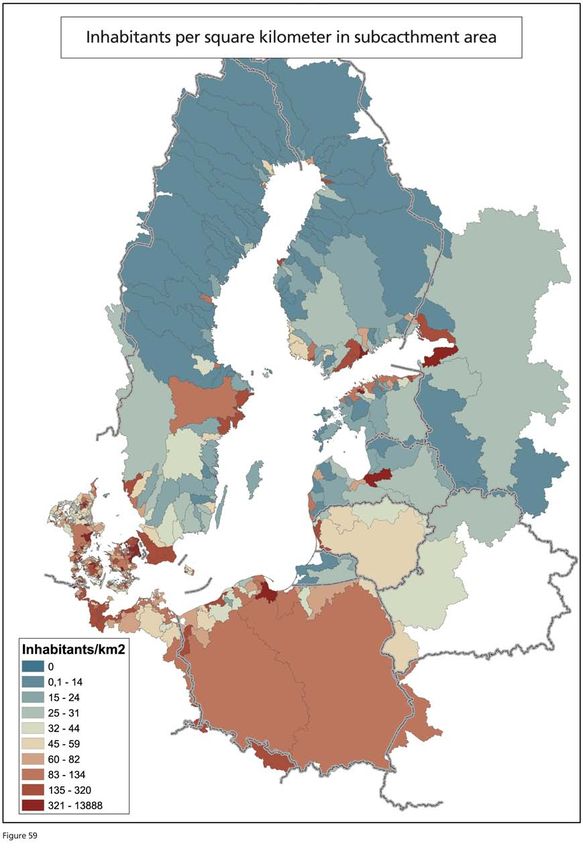
Changes in the main nitrogen
sources and pathways
Changes in total nitrogen and phosphorus inputs into the Baltic Sea, as well as the proportion of the
major pathways have been evaluated for the years 1995, 2000, 2006 and 2014. The reported major
pathways include riverine loads, direct point-sources and, for nitrogen, atmospheric deposition. The re-
sults are illustrated as pie charts in Figures 1 to 34, where Figures 1 and 18 show the changes in nitro-
gen and phosphorus inputs to the entire Baltic Sea, respectively. Figures 2 to 8 and 19 to 25 show the
nitrogen and phosphorus input changes to the different Baltic Sea basins, and Figures 9 to 17 and 26
to 34 show the nitrogen and phosphorus input changes attributed to the different HELCOM countries.

Changes in the main pathways of nitrogen input
For the entire Baltic Sea, the total nitrogen inputs fall during the recorded period, with the share of di-
rect point-sources experiencing greatest change (Figure 1).

This pattern of nitrogen inputs reduction is in common for all basins in the Southern part of the Bal-
tic Sea, (the Baltic Proper, Danish Straits, and Kattegat) (Figures 6-8) and correlates with falling inputs
from Denmark, Germany, Poland and Sweden; the countries that dominate nitrogen input to these
basins (Figures 9, 12, 15, and 17).

A similar tendency is indicated for nitrogen inputs to the Gulf of Finland (Figure 4), and corresponds
with falling nitrogen input from Finland and Russia; the two countries responsible for the majority of
input to the Gulf of Finland (Figures 11 and 16). However large total input in 2006 partly obscures
this trend.

Total nitrogen inputs to the Gulf of Riga decrease over time (Figure 5), but in this case the countries
that discharge into the Gulf - Estonia and Latvia - possess variable total inputs for the evaluated peri-
od (Figures 10 and 13). However, there is a tendency for the share of the direct point-sources to de-
crease over time.

Lithuania, discharging into the Baltic Proper, displays variable nitrogen inputs over time (Figure 14). For
the two remaining basins, Bothnian Bay and Bothnian Sea, the total inputs do not show any strong
tendencies, although the inputs in 2014 appear to be lower than in earlier years (Figures 2-3). Since
the inter-annual variability appears to be substantial, it is hard to detect any trends in the share of dif-
ferent nitrogen pathways.

                                                     4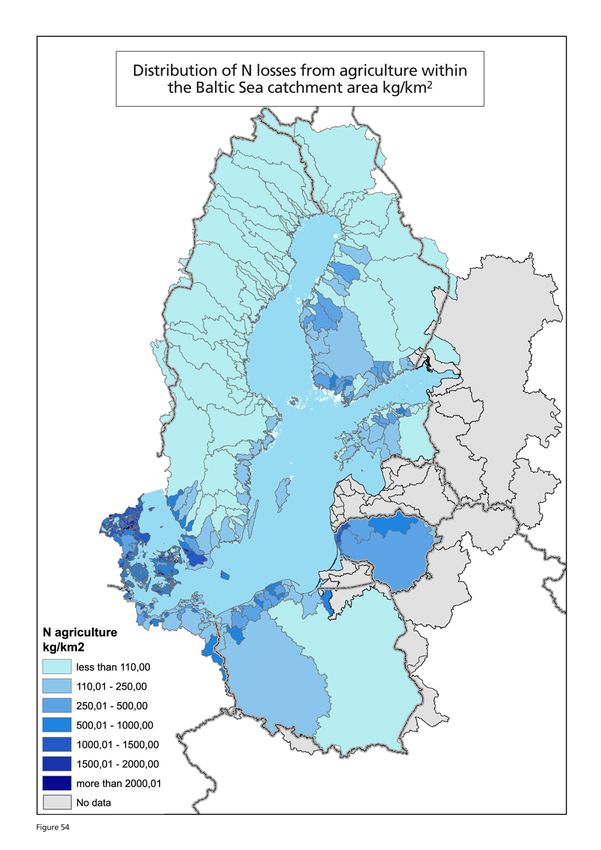
5
6
7
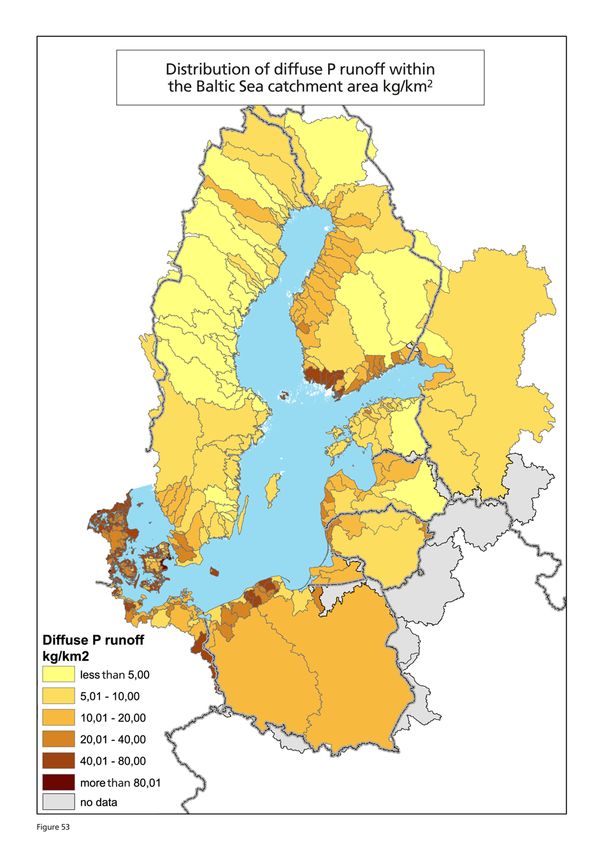
Figure 9

Figure 10

            Figure 10

Figure 11
                        8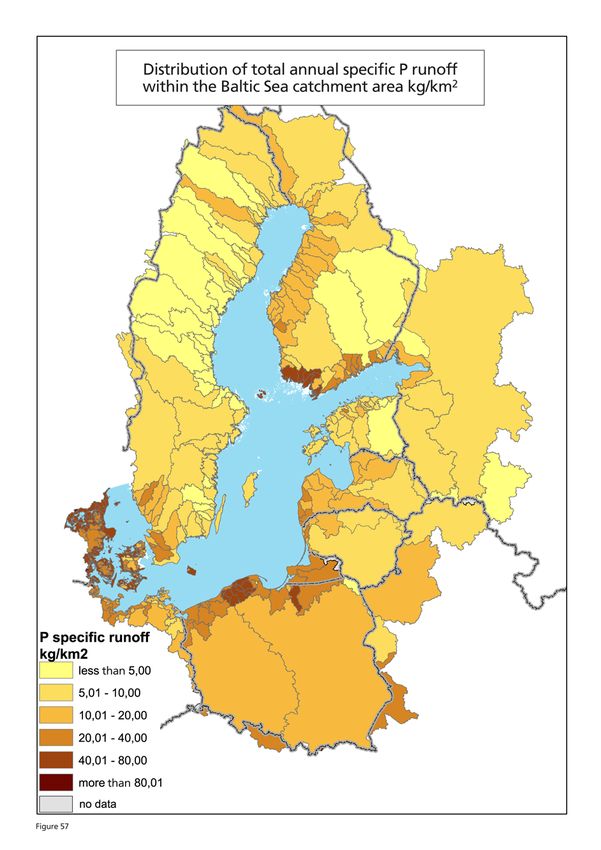
Figure 12

Figure 13

Figure 14
            9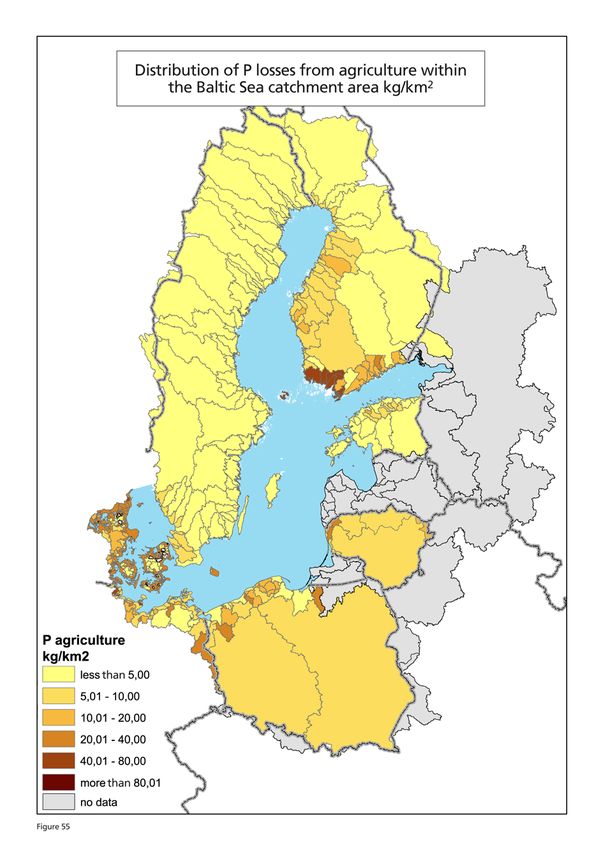
10
Changes in the main pathways of phosphorus input

The overall pattern for both total phosphorus load as well as share of different pathways is quite dif-
ferent from the patterns observed for nitrogen. Nonetheless total average inputs for both phospho-
rus and nitrogen for the entire Baltic Sea have reduced over time (Figures 1 and 18). The differences
stand out when observing the inputs to the different basins, and the share contributed by the different
countries. The differences are mainly because the long-term focus to reduce nutrient load has been on
phosphorus, as the main regulating nutrient for eutrophication in the Baltic Sea (except from the more
saline waters in the Danish Straits and Kattegat for example). Meanwhile, less attention has been giv-
en to nitrogen, until more recently.

Although there has been a focus to reduce phosphorus loads for quite a substantial time, the reduction
measures have been implemented over different time periods in different countries, which is evident
when comparing the total phosphorus loads, as well as the shares of the pathways (Figures 18-34).
Denmark, Finland, Germany, and Sweden started to implement measures to reduce the impact from
point-sources (direct and inland sources) before HELCOM measurements began, by improving waste
water treatment plants. This means that these early reductions and the effect on the phosphorus loads
to the Baltic Sea cannot be seen in the HELCOM data. In these countries, measures are now more ori-
ented to diffuse sources like agricultural losses and scattered dwellings, as the possibility for further re-
duction of emissions from waste water treatment plants are comparatively small and quite expensive.

The main tendencies revealed over the evaluated period show that for the whole Baltic Sea, as well as
for the majority of its basins, there is a decrease in the total phosphorus load over time (Figure 18-25).
For the Bothnian Sea and the Gulf of Finland the main reduction appears in 2014 (Figures 20-21). The
only basin without any obvious reduction in the total phosphorus load is the Gulf of Riga (Figures 22).
More or less the same picture is given for the country-wise phosphorus loads, with a general decrease
for Estonia, Germany, Poland, and Sweden (Figures 27, 29, 32, and 34), an early decrease (in 1995) for
Denmark (Figure 26), and a late decrease for Finland, Lithuania, and Russia (Figures 28, 31, and 33).
No clear trends can be seen for Latvia (Figure 30).

For the changes in proportions of the different pathways most countries show a decrease in their share
of direct point-sources over time. The main difference between countries is how large the change is
and when it occurs (Figures 26-33). The only country that does not have any clear trend in changed
pathways is Sweden (Figure 34). Consequently, the share of the direct point-sources for most basins as
well as for the whole Baltic Sea is decreasing over the period evaluated (Figures 18-25). The only excep-
tion to this general tendency is the Bothnian Bay, where there is no clear trend (Figure 19).

                                                      11
12
13
14
Figure 26

Figure 27

Figure 28

            15
Figure 29
1617
Sources of riverine nitrogen and
phosphorus to the Baltic Sea
Source apportionment of riverine loads can be used as an instrument to estimate the contributions of
different diffuse and point sources, to total riverine nitrogen and phosphorus loads entering the Baltic
Sea. It is used to assess the importance of different anthropogenic sources and the contribution of nat-
ural background losses. Source apportionment can be performed using one of two approaches, either
based on loads to inland waters (source approach or gross load) or at the river mouth (load approach
or net load) (see also HELCOM 2015). Generally, these two approaches give different results because
the retention is normally lower for sources situated close to the coast, as well as in large rivers, where-
as the retention is higher for upland areas since the water travels a longer route before it enters the
sea (see also nutrient retention in inland surface waters). Another reason for differing results may be
because different methodologies are used to estimate diffuse sources for the two approaches. The re-
sults presented below, and in Figures 35-69, all derive from the load-oriented approach, meaning that
they refer to net loads to the Baltic Sea, that take the retention in the catchment areas into account.

Note that in this assessment all source-apportionment data from Germany and Poland refer to the original-
ly agreed assessment year 2012, whereas all other countries refer to 2014, which was later decided to be
the assessment year. As Germany and Poland had already started their data collection when the year was
changed, it was decided that they would continue their work using the original year for the assessment.

Sources of riverine nutrient loads in the Baltic Sea area
Natural background loads of nitrogen and phosphorus make up around one third of the total load of
nutrients to the Baltic Sea (Figure 35). This is about twice as large a proportion compared to the es-
timates in PLC5 (HELCOM 2011). The reason for this large difference is probably due to changed es-
timates of background loads in the present assessment. However, there are large differences in the
proportion of natural background loads for the different Baltic Sea basins (Figures 36-42). The largest
proportion of natural load occurs in the Gulf of Finland (68% for nitrogen, and 59% for phosphorus),
and Bothnian Bay (65% for both nitrogen and phosphorus), whereas the lowest proportions are in the
Gulf of Riga (12% for nitrogen, and 11% for phosphorus).

Among the anthropogenic sources, the diffuse sources (mainly from agricultural activities) constitute
the major part, making up 46% of the total riverine nitrogen load and 36% of the total riverine phos-
phorus load to the Baltic Sea (Figure 35). The large differences in the amount of land utilised for agri-
culture (see also Figure 58), as well as agricultural practices over the Baltic Sea catchment, are reflected
by the varying contributions that diffuse sources make to total nutrient load (Figures 36-42). High im-
pact is found in the Gulf of Riga (57% for nitrogen, and 42% for phosphorus), and for nitrogen also
in the Danish Straits (68% for nitrogen), and Kattegat (59% for nitrogen).

Point-sources are important for riverine nutrient loads to the Baltic Sea, and constitute 12% of the to-
tal nitrogen load and 24% of the total phosphorus load (Figure 35). The variability in importance of
point-sources is even greater than for the other nutrient sources (Figures 36-42). The lowest impact
from point-sources is found in the Gulf of Riga (1% for nitrogen, and 4% for phosphorus), but there
are also other basins where the proportion for nitrogen is lower than 10%, including Bothnian Bay
(6-7%), the Gulf of Finland and Kattegat (8%). High impact from point-sources is found in the Bal-
tic Proper (18% for nitrogen, 33% for phosphorus), and in the Danish Straits (43% for phosphorus).

However, some caution needs to be taken when assessing the various riverine nutrient sources to the
Gulf of Riga, as it has not been possible to allocate any specific sources to a large proportion of the nu-
trient load. These loads are classified as trans-boundary as they originate in upstream countries, main-
ly Belarus (Figure 39). In total, the trans-boundary load to the Gulf is 30% for nitrogen, and 42% for
phosphorus. This increases uncertainty in source apportionments substantially for this basin. Substan-
tial trans-boundary loads are also found for the Baltic Proper with 10 to 11% of the nutrient loads orig-
inating in countries upstream of the HELCOM countries (Figure 40).

                                                    18
Riverine load in 2014 to BALTIC SEA
Riverine load in 2014 to BALTIC SEA
TN (529,583 tonnes) TP (22,273 tonnes)
Riverine load in 2014 to BOB
TN (42,922 tonnes) TP (2,133 tonnes)
Riverine load in 2014 to BOS
TN (37,698 tonnes) TP (1,455 tonnes)
19Riverine load in 2014 to GUF
TN (84,295 tonnes) TP (3,707 tonnes)
Riverine load in 2014 to GUR
TN (65,288 tonnes) TP (1,660 tonnes)
Riverine load in 2014 to BAP
TN (220,414 tonnes) TP (10,733 tonnes)
20Riverine load in 2014 to DS
TN (28,251 tonnes) TP (1,130 tonnes)
Riverine load in 2014 to KAT
TN (50,713 tonnes) TP (1,455 tonnes)
21Country-wise distribution of sources of nutrient loads
It is only with great caution that the source apportionment may be assessed at country or basin-wise
level, especially since the nutrient allocation modelling may vary from country to country, and does not
always follow the HELCOM PLC-Water guidelines (HELCOM 2016). Detailed information on the nutri-
ent sources, including nutrient loss from agriculture and atmospheric deposition on inland water sur-
faces, has only been given by Germany, Denmark, Finland, Lithuania, Poland, and Sweden, whereas
the other HELCOM countries have reported a more generalised source apportionment.
It should also be noted that some of the minor point sources (for example storm water effluent and
scattered dwellings) are handled differently by different contracting parties, and they may be included
in the diffuse sources or in point sources. Also, the definition of scattered dwelling can be rather dif-
ferent in different countries. For example, in Denmark it is less than 30 PE, whereas in some CP’s less
than 300 PE.
The most important German nutrient source for the Baltic Sea is agricultural activity, which makes up
78% of the nitrogen load, and 51% of the phosphorus load (Figure 46). Other important anthropo-
genic sources, especially for phosphorus, are point-sources (20%) and urban areas (22%), whereas
they are less important for nitrogen (9% and 4% respectively). The atmospheric deposition is limited
to 9% for nitrogen, and 8% for phosphorus.
Note that these data are based on the German MSFD reporting and differ from PLC reporting. For
MSFD, Germany does not report on natural background losses and uses aggregated data from 2012
to 2014.
The nutrient riverine inputs from Denmark are to a large extent dominated by agriculture (Figure
43). For Nitrogen, the diffuse loads constitute 74% of the total load, while for phosphorus they make
up 38% of the load. The natural background constitutes 19% for nitrogen, and 29% for phospho-
rus. Point-sources are very important for the phosphorus loads (33%), but less important for nitrogen
(6%). The contribution of atmospheric deposition is very minor (1% for nitrogen, 0.1% for phospho-
rus), due to the very limited amount of lake surface areas.
Diffuse sources are the main contributor to the Estonian riverine nutrient load (Figure 44). Most like-
ly, the main diffuse source is agriculture in this case. For nitrogen diffuse sources constitute 64% of
the load, whereas the corresponding proportion for phosphorus is 75%. The natural background loss-
es are substantial (34% for nitrogen, and 21% for phosphorus). On the other hand, point-sources are
less important for the total loads (2% for nitrogen, and 4% for phosphorus). No information has been
reported on the importance of atmospheric deposition.
For Finland the natural background loads are very important and make up some 44% and 34% of
the total loads for nitrogen and phosphorus, respectively (Figure 45). Also, the losses from agriculture
are notable with 38% for nitrogen, and 53% for phosphorus. The point-sources constitute some 10%
of the loads, and atmospheric deposition is quite significant, especially for nitrogen (8%), and slight-
ly less for phosphorus (3%). The comparatively high proportion for deposition is due to the relatively
high amount of lake surface area in Finland.
The riverine nutrient loads travelling via Latvia to the Baltic Sea is heavily influenced by trans-boundary
loads from upstream countries, (mainly Belarus), and constitute some 37% of the total nitrogen, and
46% of the total phosphorus loads, respectively (Figure 47). It has not been possible to allocate these
loads to any specific sources, but it is likely that agricultural activities and point-sources are important
in these upstream countries, as is the case in the HELCOM countries. Of the Latvian nutrient sources,
the diffuse sources are heavily dominating (53% for nitrogen and 40% for phosphorus). Point-sourc-
es only make up a small share of the total riverine loads (0.5% for nitrogen, 2% for phosphorus). No
information has been reported on the importance of atmospheric deposition.
The trans-boundary loads are a very important part of the Lithuanian total nutrient loads to the Bal-
tic Sea (Figure 48), and similar to Latvia, with Belarus as an important source outside the HELCOM
22countries. Trans-boundary nitrogen loads constitute 25% of the total load via Lithuania, and the corre-
sponding proportion for phosphorus is 34%. Also in this case it has been impossible to allocate these
loads to any specific sources, but again it is likely that agricultural activities and point-sources are im-
portant in these upstream countries, as is the case with the HELCOM countries. Agricultural activi-
ties are the major nutrient source for the total Lithuanian loads with 56% for nitrogen, and 42% for
phosphorus. The natural background levels are 12% for nitrogen, and 11% for phosphorus, whereas
point-sources represent 4% of the nitrogen load and 13% of the phosphorus load. Atmospheric dep-
osition only constitutes a small fraction of the total nutrient load (2% for nitrogen).
The nutrient loads from Poland are characterised by comparatively large proportions from agriculture
and from point-sources (Figure 49). For phosphorus, the point-sources share is even larger than the ag-
ricultural share (42%, and 34%, respectively). For nitrogen, the contrary occurs with 31% from point-
sources, and 45% from agricultural activities. The natural background is 16% for nitrogen, and 18%
for phosphorus, and the proportion of atmospheric deposition is quite small (3% for nitrogen, 1%
for phosphorus). A rather small fraction of the total loads originates in upstream countries, and these
trans-boundary loads constitute 4-5% of the total loads that reach the Baltic Sea via Poland.
The Russian riverine nutrient loads to the Baltic Sea have been reported to mainly consist of natural
background losses (Figure 50). In total 83% of the nitrogen loads are considered to have a natural or-
igin, and the corresponding proportion for phosphorus is 65%. Of the anthropogenic sources, diffuse
sources dominate with 10% for nitrogen, and 21% for phosphorus, whereas point-sources constitute
6% of the nitrogen loads, and 14% of the phosphorus loads. No information has been reported on
the importance of atmospheric deposition.
The nutrient loads from Sweden are to a large degree characterised by a significant proportion of nat-
ural background losses (Figure 51), accounting for around 54% of the total nitrogen load, and 66% of
the total phosphorus load. Of the anthropogenic nutrient sources, agriculture and point-sources con-
stitute 25% and 11% for the total nitrogen load, and 14%, and 16% respectively for the total phos-
phorus load. Atmospheric deposition is important in comparison to most other HELCOM countries,
especially for nitrogen (10% of total loads), but also for phosphorus (4%). The comparatively large im-
pact of atmospheric deposition is due to the high share of lake surface area in Sweden (approximately
10% of the total land area). Recent national studies estimate that the background nutrient losses from
agricultural land in Sweden is in the order of half of the losses reported in the present publication. The
anthropogenic impact is correspondingly higher with the same absolute amount. These new findings
will be taken into account in future assessments.
23Riverine load in 2014 from DENMARK
TN (41,820 tonnes) TP (1,580 tonnes)
Figure 43
Riverine load in 2014 from ESTONIA
TN (15,883 tonnes) TP (292 tonnes)
Figure 44
Riverine load in 2014 from FINLAND
TN (69,080 tonnes) TP (2,789 tonnes)
Figure 45
24TN riverine load in 2012 from TP riverine load in 2012 from
GERMANY (16,593 tonnes) GERMANY (767 tonnes)
Riverine load in 2012 from GERMANY
TN (16,593 tonnes) TP (767 tonnes)
Urban areas
Point-sources 3,8%
9,1%
Point-sources Urban areas
19,8% 21,5%
Atmospheric
9,1%
Atmospheric
7,5%
Urban areas Point-sources Atmospheric Agriculture Urban areas Point sources Atmospheric Agriculture
Agriculture
77,9% Agriculture
51,2%
Urban areas Urban areas
Figure 46 Note! The data from MSFD reporting were used. In the MSFD reporting Germany did not estimate any natural background losses.
Riverine load in 2014 from LATVIA
TN (50,074 tonnes) TP (1,500 tonnes)
Riverine load in 2014 from LITHUANIA
TN (79,633 tonnes) TP (2,374 tonnes)
25Riverine load in 2012 from POLAND
TN (107,647 tonnes) TP (6,863 tonnes)
Riverine load in 2014 from RUSSIA
TN (61,103 tonnes) TP (3,317 tonnes)
Riverine load in 2014 from SWEDEN
TN (87,751 tonnes) TP (2,792 tonnes)
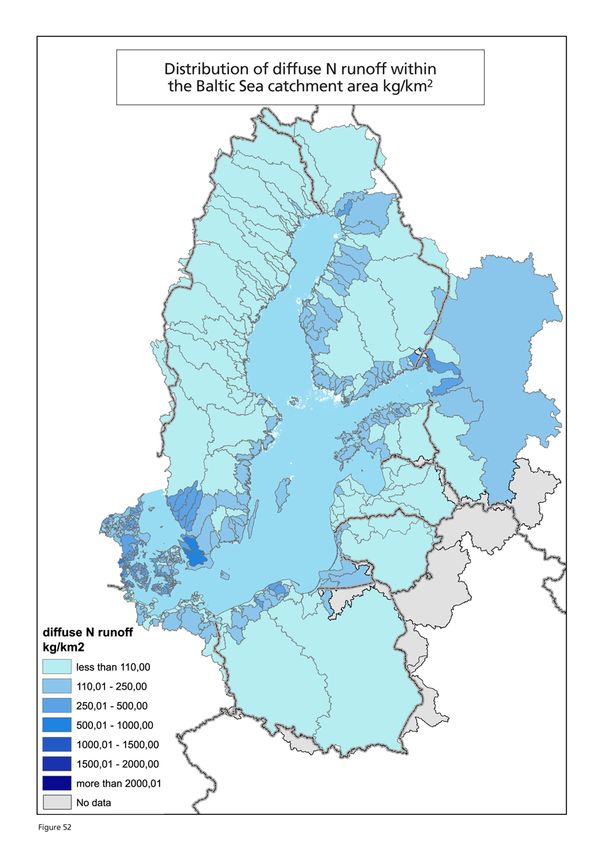
26Area-specific losses and retention
The dominant source of riverine nutrients to the Baltic Sea are the diffuse sources. Since these sourc-
es are to a large degree dominated by agricultural nutrient losses, there is a large similarity in the
geographical distribution of area-specific1 nitrogen and phosphorus losses from diffuse sources and
agriculture (Figures 52-55), as well as concerning the total riverine area-specific losses (Figures 56-57).
In addition, there is also a good agreement between the areas with high diffuse losses as well as agri-
cultural nutrient losses, and the proportion of land used for agriculture (Figure 58). There is also a com-
paratively good relationship between the diffuse nutrient losses and the number of inhabitants per unit
catchment area (Figure 59).
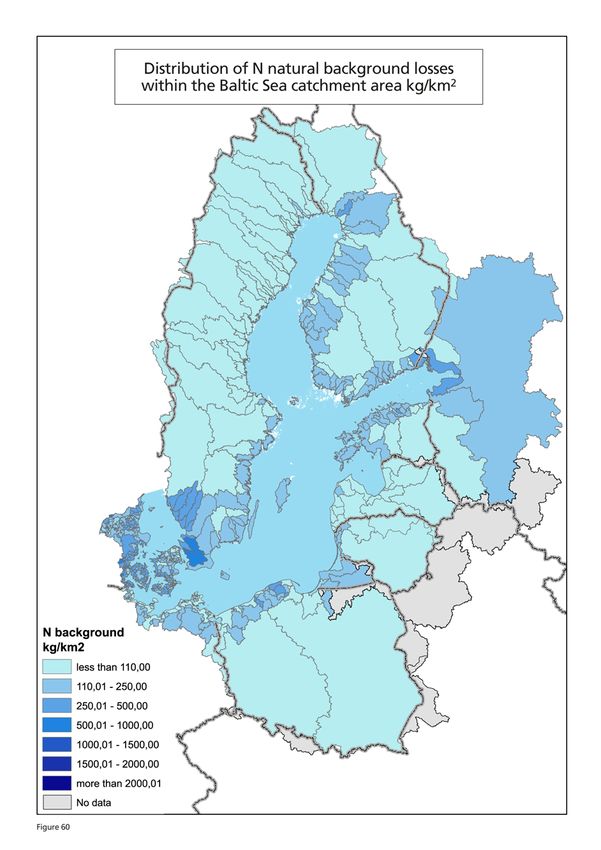
The highest area-specific losses are found in the South-Southwestern part of the Baltic Proper, to the
Kattegat, as well as in the Eastern part of the Baltic Proper, to the Gulf of Riga and Gulf of Finland (Fig-
ures 52-57). Also, the comparatively small Finnish rivers draining into the Bothnian Sea and Bothnian
Bay constitute rather high area-specific losses. However, when comparing spatial distributions of ar-
ea-specific losses, it is necessary to bear in mind that the size of the catchment area is important, since
eventual hot-spots in large water systems may be “diluted” if they are incorporated into large areas
with less nutrient input. This is quite evident when comparing the Finnish rivers draining westwards
(into the Bothnian Bay and Bothnian Sea) and the small rivers draining into the Gulf of Finland with
larger river systems draining to the Gulf of Finland. Also, this could at least partly explain higher area-
specific losses associated with Finish rivers draining into the Bothnian Bay and the Bothnian Sea than
the corresponding losses from the considerably larger Swedish rivers draining to the same basins that,
like the Finnish rivers systems, are dominated by nutrient loads from large forested areas considered to
be close to natural background levels (Figures 60-61).
The nutrient loads from direct point-sources are to a large degree dominated by municipal waste wa-
ter treatment plants (MWWTs), although rather large industrial point-sources exist, especially along
the Swedish coast, and to some degree along the Finnish coast (Figures 62-65). Comparatively many
smaller MWWTs are found along the Finnish, Swedish and Danish coastlines, whilst the other HELCOM
countries mostly have a few larger plants in connection with large coastal cities (Figures 64-65). Nu-
trient loads from sea-based aquaculture activities mainly have an impact in Finland (Archipelago Sea),
Denmark, and to some extent in Sweden (Figures 66-67).
Retention of nutrients is defined as the removal or transformation of phosphorus and nitrogen species
in surface waters of river systems, including adjoining lakes and during river valley floods. Estimates
of retention is necessary for the quantification of nutrient losses, taking into account removal of nu-
trients on the way form land-based sources to marine environment. Moreover, the retention informa-
tion may be used to estimate the effect of remedial measures on inland sources that aim to reduce
nutrient loads to the sea. Retention is to a large degree influenced by the residence time of the inland
water systems. Hence, factors like percentage of surface freshwater and wetlands, and topography,
highly influence retention. For example, especially large and deep lakes increase phosphorus removal
due to sedimentation. Meanwhile, for nitrogen various kinds of wetlands and periodically flooded are-
as may influence the de-nitrification, producing nitrogen gas that departs to the atmosphere. The op-
posite may also occur, especially for phosphorus where the sediments in highly eutrophic lakes may act
as an internal phosphorus source. However, in general the longer the water and the nutrients are re-
tained in a water system, the larger the nutrient retention will be, meaning that long river systems of-
ten promote higher retention.
The factors that affect the retention vary across the Baltic Sea catchment area, which makes it difficult
to fully harmonize the methods of calculating nutrient retention in inland surface waters. Hence, the
estimated retentions are to be regarded as approximate estimates. Note that the nutrient inputs to the
Baltic Sea given by according to the load-oriented approach earlier has already taken the inland reten-
tion in freshwater into account as these inputs are the estimated net inputs to the Sea.
1 Area-specific nutrient losses are defined as the amount of nutrients lost or transported per unit area
(generally in kg/km2 or formerly kg/ha). It is mainly used to compare nutrient loads from different areas.
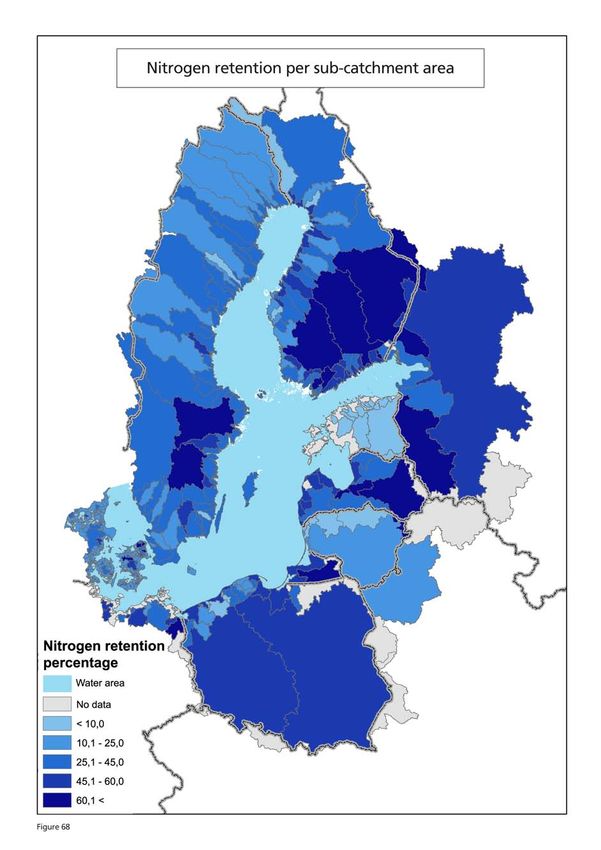
27The largest proportion of total nitrogen and phosphorus retention in the total river system catchments
in 2014 (2012 in Germany and Poland) have been reported for the catchments draining into the Gulf
of Finland, as well as from Poland, and some areas in the Southern part of Sweden (Figures 68 and
69, respectively). In addition, for some smaller catchments in Latvia, the Kaliningrad area of Russia, as
well as Germany and Denmark both the nitrogen and phosphorus retention has been reported to be
high (45 to 88%). For phosphorus, retention in the same range is also reported for Lithuania, and the
central part of Sweden (Figure 69). The lowest nutrient retention has been reported for Estonia. How-
ever, this low figure is probably not realistic, and more likely due to methodological issues (retention
data is lacking from this area), as there is no reason to believe that the nutrient retention in one coun-
try or area draining to the Baltic Sea would be just a fraction of the retention in neighboring areas.
Also, there are some considerable differences in retention for trans-boundary river systems that proba-
bly also result from differences in methodology and/or data availability. An example of this is the Bela-
rusian trans-boundary rivers entering Lithuania, Latvia, and Poland (Figures 68 and 69).
2829
30
31
32
33
34
Agricultural land by subcatchment area (%)

Figure 58

                                35
36
37
38
39
40
41
NOTE! Only municipal waste water treatment plants larger than 2000 PE were reported by Estonia.

                                              42
43
44
45
46
47
48
You can also read