A Refined Conceptual Model for Subsidence at Wairakei, New Zealand
←
→
Page content transcription
If your browser does not render page correctly, please read the page content below
GRC Transactions, Vol. 41, 2017

 A Refined Conceptual Model for Subsidence
 at Wairakei, New Zealand

 Fabian Sepulveda1, Chris J. Bromley2, Fabian Hanik1,
 Paul F. Bixley1, Abdul Nishar1, Warren Mannington1
 1
 Contact Energy Ltd, Taupo, New Zealand
 2
 GNS Science, Wairakei, Taupo, New Zealand

Keywords
Wairakei, subsidence, benchmark level history, swelling clay, sigmoidal curve fitting, pressure
trends, compressible layer

 ABSTRACT

Production of geothermal fluid started at Wairakei in the 1950’s with subsidence being one
surface effect observed as a result of production. Large-scale reinjection was implemented in the
late 1990’s. Thanks to an extensive levelling benchmark network, it has been possible to
thoroughly monitor benchmark level history at Wairakei throughout its operating history (period
1952-2017). At the center of the area of high subsidence (referred to as Wairakei Bowl), surface
level has dropped in excess of 15 m. Previous studies attributed subsidence to compaction of
shallow, clay-rich sediments capping the geothermal system (Allis, 2000), and showed that
within the area of subsidence, some benchmark level history can be approximated by a sigmoidal
curve (Bromley, 2006). In this study, level history until 2017 is studied for selected benchmarks
of the Wairakei Bowl using multiple sigmoidal curve fitting with input parameters calibrated
against field pressure history and thickness and depth of the compacting layer(s). The latter are
re-interpreted using vertical shifts in well casing coupling depths and swelling clay anomalies. It
is shown that benchmarks show a general reduction in subsidence rate with time as dictated by
sigmoidal trends, with second-order variations in subsidence rate controlled by pressure trends in
the reservoir.

1. Introduction
1.1 Field operating history
A detailed account of pre-2009 production history of Wairakei can be found in Bixley et al.
(2009). In this section, production history until 2016 is briefly described. All geographic areas
and power stations mentioned in this section (Te Mihi, EBF, WBF, Poihipi, Otupu and Karapiti)
are shown in Figure 1. The Wairakei geothermal field has been in commercial operation since
Sepulveda et al.

1958, which is the longest operating history of a liquid-dominated field worldwide. Fluid
extraction started in the EBF and moved progressively west through WBF to Te Mihi. The
Poihipi Power Station (55 MWe installed capacity; commissioned in 1995) utilized initially dry-
steam wells from the Poihipi production area. In 1998, large-scale reinjection of separated brine
started at Wairakei in the Otupu area. In 2012, following changes to the Te Mihi steamfield, the
Poihipi Power Station was able to operate with a mixed steam input from both Poihipi and Te
Mihi wells. This change resulted in an increased fluid take from the Te Mihi reservoir.
Commissioning of Te Mihi Power Station (166 MWe installed capacity) in 2014 led to a further
increase in mass take from Te Mihi. The additional reinjection capacity required as a result of
increased Te Mihi fluid take (period 2012-2014) was sourced from new Otupu wells and
commissioning of the Karapiti reinjection area in 2011. Presently, Wairakei is the largest
operating geothermal field in New Zealand, with a current installed capacity in excess of 370
MWe (Figure 1).

Figure 1: Map showing Wairakei geothermal field, areas of subsidence and selected benchmarks and wells
 discussed in this study. Production areas shown by red circles. EBF = Eastern Borefield; WBF =
 Western Borefield. Thermal area within area of interest to the northwest of Wairakei Bowl
 corresponds to extinct area of boiling chloride-spring discharge.

1.2 Subsidence at Wairakei
Among early surface effects of production were pressure drawdown (Bixley et al., 2009),
extinction of chloride boiling springs (White and Hunt, 2005) and development of subsidence in
the Wairakei area (Allis, 2000; Allis and Zhan, 2000; Allis et al., 2009; Bromley, 2006; Bromley
Sepulveda et al.

et al., 2010, 2013, 2015). Figure 1 provides a snapshot of subsidence rates for the period 2001-
2004 highlighting areas of relatively high subsidence. At the center of high subsidence areas,
cumulative subsidence of up 15 m has been measured (e.g. benchmark P128 at Wairakei). The
main area of high subsidence at Wairakei, referred to as “Wairakei Bowl”, falls within the “area
of interest” in Figure 1.
The geology of the Wairakei-Tauhara geothermal field is described in detail by Rosenberg et al.
(2009) and Bignall et al. (2010). Shallow (
Sepulveda et al.

matches the common observation of level history where the tail end is broader than the roll off at
the start (e.g. Figure2; Bromley, 2010).
In this paper, we review benchmark level history for the period 1952-2017 for selected
benchmarks of the Wairakei Bowl, characterise changes in subsidence rate against various
sigmoidal curve fitting models, and refine conceptual models of subsidence in the light of
available reservoir information and field pressure history.

 Wairakei (P128) Subsidence history matching and extrapolation
 0

 2 Boltzmann function
 S = S1*(1- (1+exp((T-T0)/T1))-1)
 4 where S = subsidence,T = year
 S1 = 15.45*(T-1952) m. ( for T1968.8)
 T0 = 1979.1, T1 = 8.2 years
 8

 10 P128 obs.subsidence
 A97*3.15
 12 Calc.Boltzmann
 S1
 14

 16
 1940 1950 1960 1970 1980 1990 2000 2010 2020 2030 2040 2050
 Year
 18

Figure 2: Wairakei measured subsidence at P128, back-calculated prior to 1966 using A97 data. Total
 subsidence (m) extrapolated from 2004 to 2050 by fitting sigmoidal (Boltzmann) function (from
 Bromley et al., 2010).

2. Data and methods
2.1 Well information
2.1.1 Reservoir pressures
The deep liquid reservoir underwent a pressure drawdown of up to 25 bar as a result of fluid
extraction as measured in Waiora Formation (Figure 3; Bixley, 2009). This pressure drawdown
created a two-phase zone through boiling at the top of Waiora Formation. Pressure drawdown
propagated into shallow formations as demonstrated by groundwater level drops of tens of
meters (e.g. Bromley et al., 2009) and decline in steam pressures of mid HFF (Bixley et al.,
2009; Figure 3).
As a result of Otupu reinjection (1998), pressure recovery of up to 4 bars was observed in the
Waiora Formation liquid reservoir (Bixley et al., 2009; Figure 3). During the post-1998 WF
pressure recovery event, shallower reservoir pressures (i.e. Upper WF and Mid HFF) may have
had a minor recovery as well although a conclusive assessment is not possible due to lack of
Sepulveda et al.

mid-HFF pressure data (Figure 3). As of 2012, following increased Te Mihi fluid extraction, WF
liquid pressures saw a new increase in the rate of pressure decline (Figure 3).

Figure 3: Relative pressure change for mid HFF, Upper WF and WF wells over the period 1955-2017. Depth
 interval of aquifers shown in Figure 5.

2.1.2 WK059 casing tallies
Well integrity assessments are undertaken on a routine basis at Wairakei to support decisions
relating to well maintenance and abandonment. One of the risk factors to well casing integrity is
cumulative subsidence. Allis et al. (2009) plotted casing deformation depths for selected
Wairakei wells within areas of high subsidence and showed a peak of casing deformation depths
within HFF. The likelihood of casing deformation may increase in the presence of corrosive
fluids and/or weak casing cement bond strength. For the general case, however, casing
deformation can be ascribed to compaction-induced stress where deformation depths represent a
discrete point within the compacting layer. In this paper, a case study (well WK059) is presented
where casing coupling shifts can be used in combination with swelling clay anomalies (further
described in Section 2.1.3 below) to constrain the thickness of the compacting layer.
WK059 was drilled as a production well in 1958, decommissioned in 2014 and abandoned in
2017, following High-Temperature-Casing-Corrosion (HTCC) and camera inspections that
identified casing obstructions at 188 and 162 m depth, respectively. Casing tallies compiled as
part of the HTCC log were compared against original casing tallies. This comparison revealed a
shift in casing coupling depths starting at approximately 100 mGL and reaching a cumulative
shift of approximately 2 m at 171 m (Figure 4). Although HTCC casing coupling depths are not
available past the deepest casing obstruction (188 m), it is possible to constrain the top depth of
compacting layer (~100 m), which is in close coincidence with the top of the swelling clay layer
as mapped in WKM15 (Figure 5; See Section 2.1.3 for details). It is anticipated that the coupling
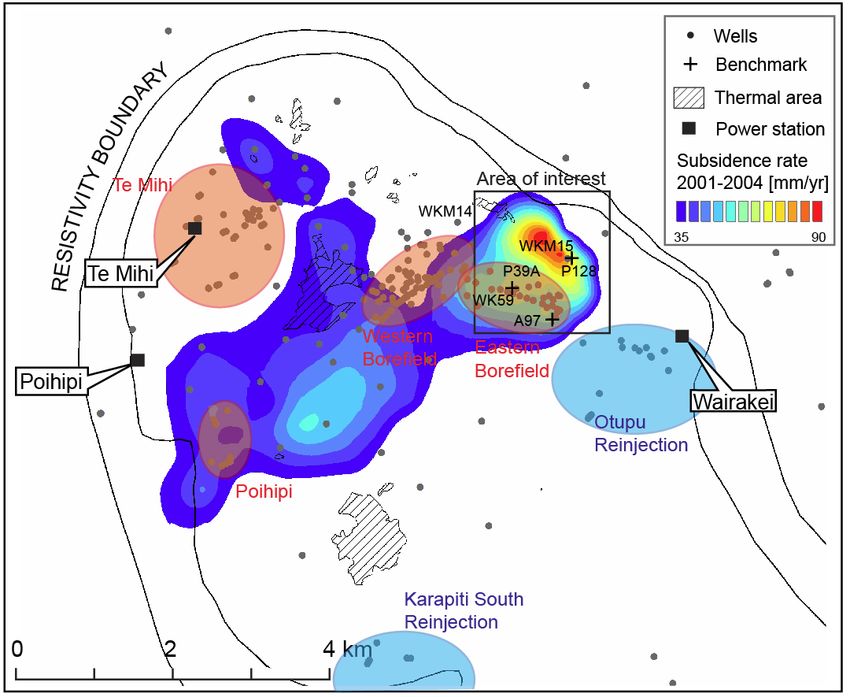
Sepulveda et al.

shift curve would level off near the bottom of the compacting layer (Figure 4), which can be
estimated from ground subsidence for the period 1958 (drill date) and 2014 (HTCC log date)
measured at neighboring benchmark P39A (see section 2.2 for further details).

Figure 4: WK059 Coupling Depth Shift- Casing Running Depth vs HTCC. A subsidence of- 2.68 cm/m is
 estimated from approximately 100 m to 171 m depth. mGL = meters below ground level.

2.1.3 Well geology and alteration
Figure 5 presents a series of geological logs approximately arranged West (Left) to East (Right)
near the main Wairakei subsidence areas, to illustrate the vertical and lateral extent of HFF. The
various hydrological units referred to in Figure 3 are highlighted.
Swelling clays (including montmorillonite, smectite, and illite-smectite; e.g. Gunderson et al.,
2000), as the name suggests, are prone to volume change due to their ability to incorporate or
expel water into/out of their mineral structure, in response to pressure changes (e.g. Taylor and
Smith, 1986; Villar and Smit, 2004). Other interesting properties of swelling clays include
electrical conductivity and temperature dependence (e.g. Gunderson et al., 2000). At Wairakei, a
close correlation was noted between swelling clay and the 100°-220°C isotherm range
(Sepulveda et al., 2012). Lateral and vertical variations in swelling clay distribution and intensity
at Wairakei are evident from Figure 5. During 2009, wells WKM14 (edge of subsidence area)
and WKM15 (near center of the 15m subsidence anomaly area; Figure 1) were drilled as part of
subsidence investigations (e.g. Bromley et al., 2010; Brockbank et al., 2011). Two high-swelling
clay layers were measured in WKM15 at the depths of Upper HFF and Lower HFF-WF
interface, respectively, with the greatest swelling clay concentrations in the Upper HFF layer.
One main high-swelling clay layer was detected in WKM14 at the depth of Oruanui Formation-
Upper HFF (Bromley et al., 2010; Sepulveda et al., 2012; Figure 5). Compressibility tests
performed on core samples from WKM15 identified anomalously compressible material in
Upper HFF and Upper WF (Bromley et al., 2010). The presence of high contents of swelling
clays that are highly compressible suggested to Bromley et al. (2010) that intense hydrothermal
Sepulveda et al.

alteration of Upper HFF and Upper WF played a role in the localization of the Wairakei
subsidence anomalies. Also, as documented in Sepulveda et al. (2012) and Correa et al (2013),
Otupu reinjection area (Figure 1) is characterized by comparatively weaker and deeper swelling
clay anomalies (e.g. well WK317; Figure 5). Cumulative subsidence of the Otupu area (~ 1 m as
of 2017) exemplifies the association of relatively minor subsidence with relatively deep and
weak swelling clay anomalies.

Figure 5: Well geology, swelling clay, and casing information for selected WBF and EBF wells. Open hole =
 slotted liner, perforated liner or perforated casing.

We summarize key reservoir observations as follows:

• HFF is laterally extensive across Wairakei-Tauhara (e.g. Rosenberg et al., 2009);
• Pressure drawdown in the deep liquid reservoir (WF) was similarly evenly distributed across
 Wairakei-Tauhara (Bixley et al., 2009);
• Swelling clay contents vary significantly laterally with swelling clay contents increasing with
 decreasing distance to areas of (past) discharge of chloride springs. These areas also tend to
 correlate with areas of high subsidence in Wairakei-Tauhara.
Sepulveda et al.

2.2 Levelling data and curve fitting
As discussed in Section 1, equation (1) combines a linear and exponential term to model level
history. An asymmetric Multiple Sigmoidal (MS) curve is introduced in this study to match level
observations. For the general case of k =1,…,n subsidence events, our MS curve takes the form:

 ( ) = 0 =0

 −1
 −
 ( ) = � �1 + � � � , >0 (3)
 −
 =1

where is the maximum subsidence of event k in meters, and are the middle and
initial time of event k (during which pressure change is observed) respectively, with ( ) = 0.5
 , and is a power factor ( ≥ 1) which controls the spreading of the subsidence over time
in a similar way to constant T1 in equation (1). Although parameter can be calibrated
against pressure history (linear component of equation 1; Bromley, 2006), or narrowed down by
trial and error, an empirical approach to selecting values is proposed here that takes into
account pressure change in combination with other reservoir information as follows:

 = ∙ ∙ ∙ � ∙ (1 − ∅) ∙ + ∙ ∅� (4)

which is a dual compaction model with one component of subsidence related to porosity change
and another component of subsidence related to change in rock volume (swelling clay water
expel or swell-up), as conceptually portrayed in Figure 6.

Figure 6: Compaction model based on the concept of two components of subsidence: porosity (∅)-related and
 swelling-clay related.
Parameters in Equation 4 are defined as follows:

• H = Thickness of compressible layer, defined as the depth interval with swelling clay > 5% ;
Sepulveda et al.

• ∅ = porosity of the compressible layer (values used here: 50% in Upper HFF and 45% in
 Lower HFF);
• Pk = pressure factor, defined as Pk = ∆Pk /Pi where ∆Pk is the pressure difference between the
 start and end of subsidence event k, and Pi is the initial (pre-exploitation) pressure at the
 average depth of the compressible layer. Pressure values are approximated from pressure
 history as in Figure 3;
• Df = depth factor (1 at surface and approaching zero with increasing depth) which
 approximates the effect of depth (D) and thickness of the compressible layer(s) on the
 maximum value and shape of surface subsidence anomaly. Adapting Geertsma’s model
 (Gertsma, 1973; Walsh, 2002), the following depth factor is used here:

 = 1 − (5)
 �( 2 +5∙ 2 )

• MeBmax = swelling clay content (%), defined as the maximum swelling clay content of the
 compressible layer from Methylene Blue tests;
• Cs = compaction swelling clay factor, corresponding to the vertical strain ∆Η/Η associated
 with volume change due to capture or expel of water into/from the swelling clay mineral
 structure;
• Cp = compaction porosity factor, corresponding to the vertical strain ∆Η/Η due to reduction of
 porosity. At Wairakei, assuming that a swelling clay-rich layer is also a weak layer, the
 compaction factor is assumed to approach unity for high-swelling clay (or more generally,
 weak, poorly consolidated) materials, and zero for low-swelling clay (or more generally,
 highly consolidated & hydrothermally indurated (e.g. silicification)) materials.

3. Results
Level benchmark history of the Wairakei Bowl is characterised using three selected benchmarks:
benchmark A97 (southern edge of subsidence bowl), benchmark P128 (centre of subsidence
bowl) and benchmark P39A (southern edge, near well WK059; Figure 1 for location). Pressure
gradient and magnitude of change (Figure 3) is used to guide time parameters (as in Table 1).
Following equation 4, constant pressure results in Pf = 0. Accordingly, the period from early-mid
1970’s to late 1990’s, of approximately constant pressure (Figure 3) is generally ignored. Based
on swelling clay anomalies (Figure 5), two compressible layers are defined for benchmark P128
(Table 1).
Benchmark P39A (Figure 7) exemplifies the use of sigmoidal curve fitting to infer total
subsidence (back-extrapolation). With an estimated cumulative subsidence of 2.78 m for the
period 1958-2014 (from Figure 7), the cumulative casing coupling shift of ~2 m in the depth
range 100-171 m (Figure 5) accounts for approximately two thirds of the total estimated
subsidence in the P39A area. Assuming the linear trend 2.68 cm/m can be extrapolated with
depth, the bottom of the compacting layer can be placed at ~204 mGL (182 mRL), which is close
to the bottom of HFF layer (212 mGL, or 174 mRL in WK059) and also 16 meters deeper than
the deepest casing obstructions (188 m). Note, notwithstanding the uncertainties around the
estimated depth interval accommodating deformation (~100-200 mGL), this deformation interval
can be correlated stratigraphically with the shallow swelling clay peaks in WKM14 and WKM15
(Figure 4).
Sepulveda et al.

Figure 7 shows that while a general reduction in subsidence rate with time is observed for all
benchmarks, as dictated by general sigmoidal trends (e.g. Bromley, 2006), second-order
variations in subsidence rate occur in association with pressure changes in the reservoir.

 Benchmark
 Input P128
 Period
 parameters A97 P39A Top Bottom
 Total
 layer layer
 Testing & 1 1.8 0.9 5.5 4.0 0.9
 Early Power factor 2.0 2.7 3.3 3.4 3.0
 Production
 Start year 1952.0 1958.0 1952 1952.0 1952.0
 (pressure
 decline) Mid year 1975.0 1982.0 1970.5 1970.0 1970.0
 2 4.6 2.1 10.7 9.3 1.8
 Production II 3.4
 Power factor 2.0 2.7 3.3 3.0
 (pressure
 decline) Start year 1959.0 1959.0 1959.0 1959.0 1959.0
 Mid year 1987.5 1994.5 1986.2 1985.5 1985.5
 3 -0.2 0.2 -1.0 -0.1 -0.6
 Production III
 Power factor 2.0 2.7 1.8 3.4 3.0
 (pressure
 recovery) Start year 1998.0 1995.0 1998.0 1998.0 1998.0
 Mid year 2010.0 2005.0 2010.0 2010.0 2010.0
 4 0.3 0.2 1.1 0.3 0.6
 Production IV
 Power factor 2.0 2.7 1.8 3.4 3.0
 (pressure
 decline) Start year 2012.0 2012.0 2012 2012.0 2012.0
 Mid year 2019.0 2019.0 2019 2017.0 2017.0
Table 1: Benchmark curve fitting input parameters used in Figure 7.

4. Discussion and conceptual model
One key question to address in this study is the behavior of benchmark levels of the Wairakei
Bowl, namely, benchmarks P128 and A97. These benchmarks appear to mimic, to variable
extent, the pressure trends of the WF reservoir. Specifically:
 1. Benchmark P128 shows a noticeable post-1998 reduction in subsidence rate compared to
 the pre-1998 period;
 2. Benchmark A97 shows comparatively a much more subtle post-1998 reduction;
 3. Both benchmarks show a slight increase in subsidence rate post-2012.
Sepulveda et al.

A refined conceptual model of subsidence is proposed to explain differential subsidence within
the Wairakei subsidence bowl, the key elements of which are:
 1. Hydrothermal swelling clay has a potentially amplifying effect on subsidence due to a
 control on both porosity and rock volume loss components of subsidence (Equation 4);
 2. At the center of the subsidence bowl, two compacting layers are present with both layers
 seeing the effects of pressure recovery (this effect being greater in the bottom layer);
 3. Both pressure decline and pressure recovery events in the WF propagated to HFF
 aquifers;
 4. The variability of swelling clay content in the reservoir is explained by a combination of
 Upper and Lower HFF member spatial distribution, reservoir temperature and closeness
 to discharge of chloride springs, as portrayed in Figure 8.

Figure 7: Level history curve fitting for benchmarks P128, A97, and P39A, using fitted parameters from table
 1 to equations 3 and 4.
Sepulveda et al.

Figure 8: Conceptual model of shallow stratigraphy in Wairakei bowl area (from west (left) to east (right)).
 100°C and 220°C isotherms shown as red segmented lines.

5. Concluding remarks
The availability of unprecedented level of detail (and reduced uncertainty) as to the thickness of
the compaction zone from casing coupling shifts and swelling clay contents, are used to test a
dual, swelling clay-controlled compaction model of subsidence. Based on the concept of
Bromley (2016), the time-dependant component of subsidence is approximated by a sigmoidal
curve, and the magnitude of the subsidence is approximated by means of a simple analytical
relationship (equation 4) calibrated against field pressure history (Figure 3) and reservoir
information (Figures 4 and Figure 5). It is found that the sigmoidal curve fitting presented in this
study successfully replicate level trends for selected benchmarks of the Wairakei bowl.

6. Acknowledgments
The authors would like to thank Contact Energy Ltd for permission to publish data and Energy
Surveys Ltd for levelling data collection and interpretation.

REFERENCES

Allis, R. (2000). Review of subsidence at Wairakei field, New Zealand. Geothermics, 29, 455-
 478.
Allis, R., Bromley, C., & Currie, S. (2009). Update on subsidence at the Wairakei–Tauhara
 geothermal system, New Zealand. Geothermics, 38(1), 169-180.
Allis, R. G., & Zhan, X. (2000). Predicting subsidence at Wairakei and Ohaaki geothermal fields,
 New Zealand. Geothermics, 29(4), 479-497.
Bixley, P. F., Clotworthy, A. W., & Mannington, W. I. (2009). Evolution of the Wairakei
 geothermal reservoir during 50 years of production. Geothermics, 38(1), 145-154.
 doi:https://doi.org/10.1016/j.geothermics.2008.12.007.
Brockbank, K., Bromley, C. J. and Glynn-Morris, T. 2011. Overview of the Wairakei-Tauhara
 Subsidence Investigation Program. Proceedings Stanford Geothermal Workshop.
Sepulveda et al.

Bromley, C. (2006). Predicting subsidence in New Zealand geothermal fields: a novel approach.
 GRC Transactions, 30, 611-616.
Bromley, C.; Currie, S.; Ramsay, G.; Rosenberg, M.; Pender, M.; O’Sullivan, M.; Lynne, B.;
 Lee, S-G.; Brockbank, K.; Glynn-Morris, T.; Mannington, W, Garvey, J. (2010). Tauhara
 Stage II Geothermal Project: Subsidence Report, GNS Science Consultancy Report
 2010/151. 154p.
Bromley C.J., Brockbank, K., Glynn-Morris T., Rosenberg, M., Pender M., O’Sullivan, M.,
 Currie S., (2013), Geothermal subsidence study at Wairakei-Tauhara. Journal of
 Geotechnical Engineering (Special Issue on Renewable Energy) Vol. 166 Issue 2, p211-223.
 http://www.icevirtuallibrary.com/content/article/10.1680/geng.12.00040.
Bromley, C., Currie, S., Jolly, S., Mannington, W. (2015) Subsidence: an Update on New
 Zealand Geothermal Deformation Observations and Mechanisms. Proceedings WGC2015
 Melbourne, April 2015, #02021.
Correa, N. A., Rae, A. J., Sepulveda, F. Distribution of Clay Minerals through a Conductive
 (MT) Zone on the Margins of a High-Temperature Geothermal Reservoir, Wairakei
 Geothermal Field, Taupo Volcanic Zone, New Zealand, GRC Transactions, 37, 459-462.
Gunderson, R., Cumming, W., Astra, D., & Harvey, C. (2000). Analysis of smectite clays in
 geothermal drill cuttings by the methylene blue method: for well site geothermometry
 and resistivity sounding correlation. Proceedings World Geothermal Congress, Kyushu,
 Japan.
Rosenberg, M. D., Bignall, G., & Rae, A. J. (2009). The geological framework of the Wairakei–
 Tauhara Geothermal System, New Zealand. Geothermics, 38(1), 72-84.
 doi:http://dx.doi.org/10.1016/j.geothermics.2009.01.001.
Sepúlveda, F., Mannington, W., Charroy, J., Soengkono, S., Ussher, G (2012). Integrated
 approach to interpretation of magnetotelluric study at Wairakei, New Zealand.
 Proceedings Stanford Geothermal Workshop.
Sepúlveda, F., Andrews, J., Kim, J., Siega, C. Milloy, S. F. (2015). Spatial-temporal
 Characteristics of Microseismicity (2009-2014) of the Wairakei Geothermal Field, New
 Zealand. Proceedings WGC2015 Melbourne, April 2015, #13047.
Taylor, R. K. and Smith, T. J. (1986). The Engineering Geology of Clay Minerals: Swelling,
 Shrinking and Mudrock Breakdown. Clay Minerals, 21, 235, 260.
Villar, M.V. and Lloret, A. (2004). Influence of temperature on the hydro-mechanical behaviour
 of a compacted bentonite. Applied Clay Science, 26, 337– 350
White, P. A., & Hunt, T. M. (2005). Simple modelling of the effects of exploitation on hot
 springs, Geyser Valley, Wairakei, New Zealand. Geothermics, 34(2), 184-204.
 doi:https://doi.org/10.1016/j.geothermics.2004.07.003
You can also read