The Pulse of the Public on Health in the Election and Health Policy - Drew Altman, Ph.D. President and CEO, KFF Founding Publisher, Kaiser Health ...
←
→
Page content transcription
If your browser does not render page correctly, please read the page content below
The Pulse of the Public on Health in
the Election and Health Policy
Drew Altman, Ph.D.
President and CEO, KFF
Founding Publisher, Kaiser Health News

UHF/GNYHA 30th Annual Symposium
November 19, 2019
Figure 2

KFF At A Glance
•    The new KFF, established in 1991

•    Our Mission: “Filling the need for trusted information on national health issues”

     …subtext: a counterweight to the money and politics in health and a voice for people

•    We do this in three main ways: policy analysis; polling/survey research; journalism
     (KHN)

•    California based, with a substantial DC presence

•    We are an endowed non-profit operating organization (a “public charity”), not a
     foundation, supported 70% by our endowment, 30% by external funds

•    No connection to Kaiser Permanente, the big HMO (we call ourselves “KFF” to avoid
     confusion)

•    Good brand, bad name
Figure 3

Why We Poll
    1. Filling a need for independent, unbiased polling data in health
       that’s in the public domain and in the public record

    2. Give the public a voice in the system, especially groups who don’t
       often have one

    3. Show where leadership is necessary and where public information
       is low and education challenges exist

    4. Go beyond opinion, and document the public’s experiences and
       problems

    5. We poll ourselves and with news organizations

    KFF is “the gold standard of health care polling” (Washington Post)
Health As An Election Issue
Figure 5

Health Care Is a Top Issue for Voters
Most important issue facing the country among 2018 voters

                     Health care                                      41%

                    Immigration                             23%

                        Economy                            22%

                      Gun policy              10%

SOURCE: 2018 National exit poll conducted by CNN, ABC, NBC, and CBS
Figure 6

Top Issue Does Not Generally Mean Top Factor To The Vote

                                                       Major Factors in 2018 Vote
            Percent who say each of the following is a major factor in their decision about who
                                          to vote for Congress:

                     The candidates’ character and experience                                                    73%

            The candidates’ support for or opposition to President
                                                                                                                 66%
                                  Trump
              Which party controls Congress, the Republicans or
                                                                                                                 66%
                               the Democrats

                              The candidates’ political party                                                    51%

                                  The candidates’ gender                                                          6%

SOURCE: KFF Election Tracking Poll (conducted September 19-October 2, 2018). See topline for full question wording and response options.
Figure 7

Democrats And Independents In “Blue Wall” States Say Defeating
President Trump Is Their Top Motivation To Vote In 2020 Election
Percent who say each of the following will be the one thing that will motivate them to vote in the 2020
presidential election:
RANK                   TOTAL                          DEMOCRATS                          INDEPENDENTS                          REPUBLICANS

                                                                                                                          To re-elect Trump/Don’t
                To defeat Trump                     To defeat Trump                       To defeat Trump                      want to see a
   1
                     (21%)                               (39%)                                 (20%)                         Democrat elected
                                                                                                                                   (21%)

                It is my civic duty                     Health care                      It is my civic duty                   It is my civic duty
   2
                       (9%)                               (9%)                                  (8%)                                  (12%)

                    Health care                     It is my civic duty                      Health care                         The economy
   3
                      (8%)                                 (7%)                                (7%)                                  (7%)

NOTE: Top 3 responses shown
SOURCE: KFF/Cook Political Report Blue Wall Voices Project (conducted Sept. 23-Oct.15, 2019). See topline for full question wording and
response options.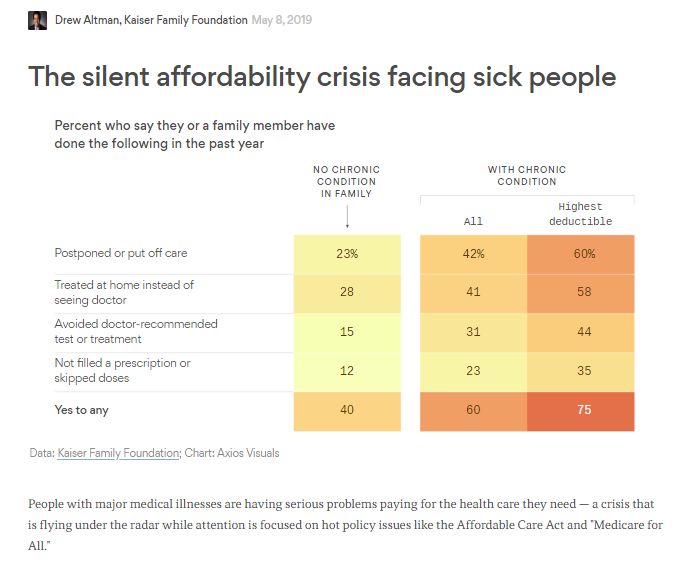
Figure 8

Health Care And The Economy Are Top Issues For Blue Wall
Voters; Other Priorities Differ By Partisans
Percent who say each of the following issues will be the most important in deciding their vote for president
next year:
                                             Democrats            Independents         Republicans
                Health care             21%                             27%                             23%                        11%

             The economy                21%                      13%                                   21%                                 30%

           Climate change            14%                               25%                          16%                             3%

                 Gun policy         13%                          14%                              11%                               15%
  Foreign policy/national                                                                        9%                                13%
         security                  9%                         7%

               Immigration         9%                              4%                            8%                                  15%

                       Taxes      6%                         4%                                 7%                               7%

International trade/tarrifs         1%                         1%                                1%                               1%

SOURCE: KFF/Cook Political Report Blue Wall Voices Project (conducted Sept. 23-Oct.15, 2019). See topline for full question wording and
response options.
Figure 9
Majority Of Likely Democratic 2020 Voters View All Progressive
Platforms As Good Ideas
Do you think each of the following is a good idea or a bad idea?
Good idea Bad idea
Green New Deal 92% 6%
Pathway to citizenship for immigrants in the U.S. illegally 91% 8%
Ban on future sales of assault weapons 88% 12%
Ban on owning assault weapons including mandatory
buybacks 83% 17%
A national Medicare-for-all plan 62% 35%
No longer detaining people for crossing the U.S. border
illegally 56% 40%
A ban on hydraulic fracturing, or fracking 54% 42%
NOTE: Among likely 2020 Democratic voters.
SOURCE: KFF/Cook Political Report Blue Wall Voices Project (conducted Sept. 23-Oct.15, 2019). See topline for full question wording and
response options.Figure 10
Swing Voters Split As To Whether Progressive Policies Are Good
Or Bad Ideas
AMONG SWING VOTERS: Do you think each of the following is a good idea or a bad idea?
Good idea Bad idea
Pathway to citizenship for immigrants in the U.S. illegally 70% 28%
Green New Deal 67% 31%
Ban on future sales of assault weapons 66% 33%
Ban on owning assault weapons including mandatory
buybacks 54% 45%
A ban on hydraulic fracturing, or fracking 40% 54%
A national Medicare-for-all plan 36% 62%
No longer detaining people for crossing the U.S. border
illegally 27% 71%
SOURCE: KFF/Cook Political Report Blue Wall Voices Project (conducted Sept. 20-Oct.15, 2019). See topline for full question wording and
response options.Figure 11
Majorities Across Partisans Name Costs And Maintaining Pre-
Existing Protections As Top Health Priorities For Congress
Percent who say each of the following should be a top priority for Congress:
DEMOCRATS INDEPENDENTS REPUBLICANS
Lowering prescription drug costs 81% 66% 62%
Maintaining ACA's pre-existing condition
87% 68% 51%
protections
Lowering what people pay for health care 72% 65% 51%
Protecting people from surprise high out-of-
network medical bills
68% 55% 42%
Expanding government financial help for those
buying coverage on the ACA marketplace
49% 26% 15%
Implementing a national Medicare-for-all plan 44% 28% 13%
Repealing and replacing the ACA 17% 28% 46%
SOURCE: KFF Health Tracking Poll (conducted September 3-8, 2019). See topline for full question wording and response options.Figure 12
Democrats: More Want Their Leaders To Focus On Improving
And Protecting The ACA Than Passing Medicare-for-all Plan
Do you think Democrats in Congress should focus their efforts on improving and protecting the 2010
Affordable Care Act or should they focus their efforts on passing a national Medicare-for-all plan?
Passing a
national
Improving
Medicare-
and
for-all plan
protecting
39%
the ACA
52%
Other/DK/
Ref.
9%
NOTE: Among Democrats and Democratic-leaning independents.
SOURCE: KFF Health Tracking Poll (conducted April 11-16, 2019). See topline for full question wording and response options.What Is The Health Issue, And Do Democrats Emphasize The Wrong Message?
Figure 14

   The vast majority of Americans are insured, and many
   uninsured people are eligible for ACA coverage

                                                                                                    Ineligible
                                                                 Uninsured                       (includes 4.1 M
                          Insured                                                                 ineligible due      Eligible for
                                                                   8.5%                          to immigration       Coverage or
                           91.5%
                                                                                                      status)          Financial
                                                                                                       45%            Assistance
                                                                                                                          55%

                                 Total = 324 Million                                          Total = 27.4 Million Nonelderly Uninsured

SOURCE: Kaiser Family Foundation analysis of 2019 Current Population Survey.   SOURCE: Kaiser Family Foundation analysis of 2017 American
                                                                               Community Survey (ACS), 1-Year Estimates.
Figure 15
Health Costs for Families with Employer Coverage Now Exceed
the Cost of a VW Beetle
Total health spending VW Beetle
$25,000
$22,885
$20,220
$20,000
$15,950
$15,000
$10,359
$10,000
$5,000
$-
2003 2008 2013 2018
Note: Health spending includes employee and employer premium contributions for family coverage as well as family out-of-pocket spending.
Large employers are those with one thousand or more employees. Auto prices are the MSRP for the lowest cost model/trim that year. Source:
KFF analysis of IBM MarketScan Commercial Claims; Encounters Database and KFF Employer Health Benefits Survey; and newcartestdrive.com
and motortrend.com.Figure 16
Cumulative Increases in Family Coverage Premiums, General
Annual Deductibles, Inflation, and Workers' Earnings, 2009-2019
200%
Workers' Earnings Overall Inflation Family Premiums Deductibles
180%
162%
160%
140%
Cumulative Increases
120%
100%
86%
80%
54%
60%
40% 26% 26%
20% 11%
20%
11%
0%
2009 2010 2011 2012 2013 2014 2015 2016 2017 2018 2019
NOTE: Average general annual deductibles are for single coverage and are among all covered workers. Workers in plans without a general
annual deductible for in-network services are assigned a value of zero.
SOURCE: KFF Employer Health Benefits Survey, 2018-2019; Kaiser/HRET Survey of Employer-Sponsored Health Benefits, 2009-2017.
Bureau of Labor Statistics, Consumer Price Index, U.S. City Average of Annual Inflation (April to April), 2009-2019; Bureau of Labor Statistics,
Seasonally Adjusted Data from the Current Employment Statistics Survey, 2009-2019 (April to April).Figure 17
Half Say They Would Have Trouble Paying Unexpected $500
Medical Bill
Suppose you had an unexpected medical bill, and the amount came to $500. Based on your current financial
situation, how would you pay the bill?
Pay the bill right away by cash or check 34%
Put it on a credit card and pay it off in full at the
13%
next statement
Put it on a credit card and pay it off over time 20%
Borrow money from a bank, payday lender, or NET Would not be
7% able to pay without
friends/family to pay the bill
borrowing/going
Arrange a payment plan with a doctor, provider, or
6% into debt:
hospital (Vol.)
51%
Would not be able to pay the bill at all 19%
SOURCE: KFF Health Tracking Poll (conducted February 13-19, 2017). See topline for full question wording and response options.Figure 18
Increasing Share Of Insured Americans Report Difficulty
Affording Health Care
AMONG THE INSURED: Percent who say it is difficult to afford to pay…
43%
37% 34%
27% 31%
24%
2015 2017 2015 2017 2015 2017
…the cost of health …copays for doctor visits …the deductible you pay for
insurance each month and prescription drugs care before insurance kicks in
SOURCE: KFF Health Tracking Polls. See toplines for full question wording and response options.Figure 19
The Consequences Of Medical Bills
AMONG THOSE WHO HAD PROBLEMS PAYING MEDICAL BILLS: Percent who say they or someone
else in their household did each of the following in the past 12 months in order to pay medical bills:
Cut spending on household items 74%
Put off vacation or major household purchases 68%
Used up all or most of their savings 58%
Taken an extra job or worked more hours 51%
Increased their credit card debt 41%
Borrowed money from friends or family 39%
Taken money out of long-term savings accounts 38%
Sought the aid of a charity or non-profit organization 24%
Changed their living situation 22%
Taken out another type of loan 17%
Borrowed money from a payday lender 10%
Taken out another mortgage on their home 2%
SOURCE: KFF Health Tracking Poll (conducted June 11-20, 2018). See topline for full question wording and response options.Figure 20
4 In 10 Adults Ages 18-64 Living In A Household With A Serious
Medical Condition Have Had Problems Paying Medical Bills
Percent who say they or a household member had problems paying medical bills in the past 12 months:
Total 29%
Serious medical condition in household,
such as cancer, stroke, heart disease, 39%
diabetes, or serious mental health illness
No serious medical condition in household 22%
NOTE: Among adults ages 18-64.
SOURCE: KFF Health Tracking Poll (conducted March 13-18, 2019). See topline for full question wording and response options.Figure 21
Share Of Income Spent On Premium Contributions And Out-
Of-Pocket Costs By Families Making 199% FPL Or Less, 2017
Premium Contribution Out-of-Pocket
16.0%
14.0%
14.0%
12.0%
5.0%
10.0%
8.4%
8.0%
6.0% 4.7%
4.0% 9.0%
2.0% 3.7%
0.0%
Exchange Employer Coverage
NOTE: Premium contributions do not include the amounts paid by the employer or by the premium tax credit.
SOURCE: KFF analysis of the Current Population Survey and exchange premium data collected from Healthcare.gov and state-based exchanges.Figure 22
Prescription Drugs
Figure 25

Majorities Favor Policy Proposals to Keep Rx Drug Costs Down
Percent who favor each of the following actions to keep prescription drug costs down:

 Allowing the government to negotiate with Rx companies to get a
                lower price for people on Medicare                                                                88%

 Allowing the government to negotiate with Rx companies to get a
        lower price for both Medicare and private insurance                                                     85%

 Placing an annual limit on out-of-pocket costs for seniors enrolled
                 in Medicare Rx drug coverage                                                                  81%

       Allowing Americans to buy prescription drugs imported from
                    licensed Canadian pharmacies                                                              78%

Allowing Medicare to place limits on how much Rx companies can
    increase the price of drugs based on annual inflation rates                                              76%

  Increasing taxes on drug companies that refuse to negotiate the
         price of medications with the federal government                                                  72%

 Lowering what Medicare pays for some drugs based on amounts
 in other countries where governments more closely control prices                                      62%

SOURCE: KFF Health Tracking Poll (conducted October 3-8, 2019). See topline for full question wording and response options.
Figure 26
Support For Government Negotiations With Drug Companies
Can Shift With Arguments
Would you favor or oppose allowing the federal government to negotiate with drug companies for lower prices
if you heard…?
Favor Oppose
People could save money on prescription drugs 89% 9%
The federal government could pay less for prescription
79% 17%
drugs for people on Medicare
It could lead to less R&D of new drugs 33% 62%
It could limit access to newer prescription drugs 29% 65%
SOURCE: KFF Health Tracking Poll (conducted October 3-8, 2019). See topline for full question wording and response options.Medicare-for-all
Figure 28

SOURCE: Gallup polls
Figure 29

Decline In Support For Medicare-for-all Since Peak In March
2018
Percent who favor or oppose a national health plan in which all Americans would get their insurance from
a single government plan:
                                         Favor                      Oppose
    100%
     90%
     80%
                                                                           38%     42%    37%      39%       38%                 45%
                                            43%        43%       43%                                                   42%                47%
     70%                          49%
              53%       55%
     60%
     50%
     40%
     30%                                                                   59%            57%
                                            50%        53%       53%               56%             56%       56%       51%       53%      51%
     20%      40%                 46%
                        39%
     10%
      0%
             1998-2000 2002-2004 2008-2009 Feb 2016 June 2017 Sept 2017 Mar 2018 Jan 2019 Feb 2019 Mar 2019 Apr 2019   Jul 2019 Sept 2019 Oct 2019
              (avg of 6 (avg of 2 (avg of 7                            MEDICARE
                polls)    polls)    polls)
                                                                        -FOR-ALL
NOTE: Question wording has included “Medicare-for-all” since 2018.
SOURCE: KFF Polls. See toplines for full question wording and response options.
Figure 30
Large Partisan Divide On National Health Plan
Do you favor or oppose having a national health plan, or Medicare-for-all, in which all Americans would get
their insurance from a single government plan?
Strongly favor Somewhat favor Somewhat oppose Strongly oppose
Total 30% 21% 11% 35%
Democrats 42% 29% 12% 16%
Independents 30% 21% 13% 35%
Republicans 15% 13% 10% 61%
SOURCE: KFF Health Tracking Poll (conducted October 3-8, 2019). See topline for full question wording and response options.Figure 31
The < The Change, The > The Support?
Percent who favor or oppose:
Favor Oppose
100%
90%
24% 24% 18% 18%
80%
47%
70%
60%
50%
40% 77%
73% 74% 75%
30%
51%
20%
10%
0%
Medicare-for-all Public option Optional Medicare-for-all Medicaid buy-in Medicare buy-in for ages
50-64
SOURCE: KFF Health Tracking Polls. See toplines for full question wording and response options.Figure 32
Public’s Views Of Medicare-for-all Can Shift Significantly After
Hearing Arguments Net
Favor Oppose favorability
Do you favor or oppose having a national health plan,
56% 42% +14
sometimes called Medicare-for-all?
Would you favor or oppose a national Medicare-for-all plan if you heard that it would do the following?
Guarantee health insurance as a right for all
71% 27% +45
Americans
Eliminate all health insurance premiums and reduce
out-of-pocket health care costs for most Americans
67% 30% +37
Eliminate private health insurance companies 37% 58% -21
Require most Americans to pay more in taxes 37% 60% -23
Threaten the current Medicare program 32% 60% -28
Lead to delays in people getting some medical tests -44
and treatments
26% 70%
SOURCE: KFF Health Tracking Poll (conducted January 9-14, 2019). See topline for full question wording and response options.Figure 33
Majorities Think Many Aspects Of Health Care System Would
Be Unchanged Under Medicare-for-all
Do you think each of the following would happen under a national health plan, sometimes called Medicare-for-all?
Yes No Don't know
Taxes for most people would increase 78% 19% 2%
People would continue to pay deductibles and co-pays when
69% 27% 4%
they use health care services
All U.S. residents would have health insurance coverage 62% 34% 4%
People with insurance through their jobs would be able to keep
their current plans
55% 38% 7%
People who buy their own insurance would be able to keep their
current plans
55% 39% 7%
Individuals and employers would continue to pay health
insurance premiums
54% 39% 6%
Doctors and hospitals would be paid less 52% 41% 7%
Private health insurance companies would still be the primary
way Americans get coverage
40% 53% 7%
SOURCE: KFF Health Tracking Poll (May 30-June 4, 2019). See topline for full question wording and response options.Figure 34
Most Medicare-for-all Supporters Think They Would Be Able
To Keep Their Health Insurance
Yes, think they and their family would be able to keep their current health insurance
No, think they and their family would not be able to keep their current health insurance
Among those who favor having Among those who oppose having
Total a national health insurance plan a national health insurance plan
or Medicare-for-all or Medicare-for-all
24%
35%
55% 67% 51%
DK 41%
DK
DK
SOURCE: KFF Health Tracking Poll (January 9-14, 2019). See topline for full question wording and response options.Insights From Nine Years Of Polling On The ACA
Figure 36

Favorability On ACA Ticked Up Since Repeal, But Remains
Divided
Given what you know about the health reform law, do you have a generally favorable or generally
unfavorable opinion of it?
     80%    ACA signed into                   Favorable                   Unfavorable                            Don’t know/Refused
            law on March 23,    1st SCOTUS
                  2010           Decision                                        2nd SCOTUS
                                                                                                       Trump
                                  (NFIB v.                                      Decision (King
                                                                                                       Elected
                                 Sibelius)                                        v. Burwell)
                                                 Obama
     60%                                        Re-elected

                                                                                                                                                 51%

     40%                                                                                                                                         40%

     20%

                                                                                                                                                 8%
      0%
      Mar-2010       Mar-2011      Mar-2012       Mar-2013     Mar-2014      Mar-2015       Mar-2016        Mar-2017     Mar-2018     Mar-2019

SOURCE: KFF Health Tracking Polls. See toplines for full question wording and response options.
Figure 37
Deep And Persistent Partisan Divide
Percent who say they have a favorable opinion of the health reform law:
100%
ACA signed Democrats Independents Republicans
into law on
March 23, 2010
80% 81%
60%
51%
40%
20%
15%
0%
Mar-2010 Mar-2011 Mar-2012 Mar-2013 Mar-2014 Mar-2015 Mar-2016 Mar-2017 Mar-2018 Mar-2019
SOURCE: KFF Health Tracking Polls. See toplines for full question wording and response options.Figure 38
Partisan Perceptions Of Law’s Personal Impact Among The
General Public
So far, would you say the health care law has directly helped you and your family, directly hurt you and
your family, or has it not had a direct impact?
Helped Hurt No direct impact
Total 18% 29% 50%
By Political Party ID
Democrats 32% 10% 56%
Independents 16% 32% 49%
Republicans 4% 52% 42%
SOURCE: KFF Health Tracking Poll (conducted June 15-21, 2016). See topline for full question wording and response options.Figure 39
Sadly, Even Primary Care Physicians’ Views Of ACA Divide
Sharply On Party Lines
Overall, what is your opinion of the health care law that was passed in 2010, also known as the
Affordable Care Act (ACA) or Obamacare?
Favorable Unfavorable
Among physicians who are:
Republicans 13% 87%
Independents 42% 58%
Democrats 87% 12%
SOURCE: KFF/Commonwealth Fund 2015 National Survey of Primary Care Providers. See topline for full question wording and response options.Figure 40 Most ACA Provisions Are Popular Across Parties % with a FAVORABLE opinion of each: Total Democrats Independents Republicans Extension of dependent coverage to age 26 82% 90% 82% 66% Insurance exchanges 82 91 78 71 Subsidies for purchasing individual coverage 81 92 82 63 Close Medicare Rx drug “doughnut hole” 81 85 82 80 No-cost preventive services 79 88 78 68 Medicaid expansion option for states 77 91 77 55 Employer mandate 69 88 61 56 No denials for pre-existing conditions 65 70 66 58 Increase Medicare payroll tax 65 77 69 42 SOURCE: KFF Health Tracking Poll (conducted November 14-19, 2018). See topline for full question wording and response options.
Figure 41

Most Unpopular ACA Provision: Individual Mandate
Percent with an unfavorable opinion of the ACA requiring nearly all Americans to have health insurance or
else pay a fine:

                                                                                                                        Congress Sets
     100%
                                                                                                                          Individual
                                                                                                                           Mandate
                                                                                                                        Penalty To $0
      80%           69%                                                                                                  Beginning In
             65%                                                                  64%                                       2019
                                                                 63%                                         63%
      60%
                      65%
             63%                         59%
      40%

      20%

        0%
        Nov-2011              Nov-2012              Nov-2013              Nov-2014                Nov-2015   Nov-2016   Nov-2017

SOURCE: KFF Health Tracking Polls. See toplines for full question wording and response options.
Figure 42
Health Care Is Complicated, Public Knowledge About What The
ACA Actually Does Is Spotty
Since the 2010 health care law was passed, has the share of people who are uninsured…
Stayed
about the
Decreased same
(correct 26%
NET:
answer) 41% 59%
Increased
31%
Don’t
know/Refused
2%
SOURCE: KFF Health Tracking Poll (March 6-12, 2017). See topline for full question wording and response options.Figure 43
Death Panel Myth Persists
To the best of your knowledge, would you say the health reform law does or does not...establish a
government panel to make decisions about end-of-life care for people on Medicare?
Don't know/
Refused
19% Yes, law
does this
41%
No, law
does not do
this
41%
SOURCE: KFF Health Tracking Poll (conducted December 2-9, 2014). See topline for full question wording and response options.Medicaid: Who Loves Ya?
Figure 45

Medicaid: More Popular Than Some People Think, Even In
Non-Expansion States
Percent who say…

                    …they have a favorable view of             74%
                              Medicaid (Feb 2018)              74%
                                                                      Medicaid expansion states
       …Medicaid is very or somewhat important             67%
              for them and their family (Jul 2017)       60%          Non-expansion states

            …they or a close friend or family member
              have received help from Medicaid at
                                                               71%
                               some point (Feb 2018)          67%

            …the Medicaid program is working well      51%
               for most people covered (Feb 2018)       53%

              …they oppose reducing funding for                 75%
              Medicaid to pay for the Republican tax           72%
                                     plan (Nov 2017)

SOURCE: KFF Health Tracking Polls
Figure 46
Majority Of Residents In Non-Expansion States Want Their State
To Expand Their Medicaid Programs
States without Medicaid Expansion (14 States) AMONG THOSE LIVING IN NON-EXPANSION
STATES: Do you think your state should keep
States that have Medicaid Expansion Medicaid as it is today or expand Medicaid to
cover more low-income uninsured people?
VT ME
WA
MT ND NH
OR MN MA
WI NY
ID SD RI
MI
WY PA
CT
NJ
Keep Expand
IA
NE
IL IN
OH DE Medicaid Medicaid to
NV WV MD
CA
UT CO
MO KY
VA DC
as it is cover more
KS
TN
NC today low-income
AZ NM
OK AR SC 34% uninsured
MS AL GA
people
TX LA
AK 59%
FL
HI
Other/DK
8%
SOURCE: KFF Health Tracking Poll (conducted November 14-19, 2018). See topline for full question wording and response options.Figure 47
Future Of Medicaid?
Which of these two descriptions comes closer to your view of what Medicaid should look like in the future?
Block Grant Keep Medicaid as-is
Medicaid should be changed so that instead of Medicaid should largely continue as it is today, with
matching state Medicaid spending, the federal the federal government guaranteeing coverage for
government limits how much it gives states to low-income people, setting standards for who
help pay for Medicaid coverage on a per person states cover and what benefits people get, and
basis but lets states decide which groups of people matching states’ Medicaid spending as the
and what health services they want to cover number of people on the program goes up or down
Total 31% 66%
Democrats 8% 89%
Independents 31% 66%
Republicans 57% 40%
SOURCE: KFF Health Tracking Poll (conducted February 13-19, 2017). See topline for full question wording and response options.Figure 48
Most See Medicaid As Government Health Insurance, Half
Of Republicans View It As Welfare
Which comes closer to your view? Medicaid is primarily a…
…welfare program
…government health insurance program that helps people pay for health care
Total 27% 69%
Democrats 16% 82%
Independents 24% 72%
Republicans 46% 51%
SOURCE: KFF Health Tracking Poll (conducted January 16-21, 2018). See topline for full question wording and response options.The Disconnect?
Figure 50

            A Venn Diagram Of Health Policy Priorities?

                                    The ACA /
                                  Medicare-for-all

                   Delivery &                          The ACA /
                   Payment                           Medicare-for-all
                 Reform “Value”
                                   Pocketbook
                                      Issues
                                   Deductibles
                                    Drug Costs
                                   Surprise Bills
Figure 51
The Many Health Cost Problems
Employer
Premiums
National Health Federal Health
Spending Spending
Value for the Consumer Out-of-
Health Care Pocket Costs
DollarFigure 52 My Big Takeaways 1. Public is divided sharply on partisan lines, with health care as a symbol/proxy for larger partisan divisions in the country. Partisanship, even more than interest groups, is the driving force in health policy today. 2. The health care problem we don’t talk about enough: problems paying health care bills for people who are sick, and lower wage. That’s the heart of our health crisis. 3. The Democratic message could be more focused on costs, especially for the general election. (Is Elizabeth Warren re-focusing the message?) 4. All policies have tradeoffs, and it is a safe bet that future legislation will be much more modest than the ideas being debated today 5. What we are debating today might not be what we’re debating tomorrow. The Texas ACA case, or a Trump win in 2020, could completely change the agenda. 6. Good luck to us all.
Thank you.
You can also read