Lesson Research Proposal for 2018: Simultaneous Linear Relationships - Project Maths
←
→
Page content transcription
If your browser does not render page correctly, please read the page content below
Lesson Research Proposal for 2018: Simultaneous Linear Relationships

                                                                     For the lesson on 31/01/2018
                                    At Davis College Mallow, Ross Durity, 2nd Year, Higher Level
                                                                   Instructor: Ronan O’ Sullivan
                           Lesson plan developed by: Ross Durity, Rose Taylor and Gene Desmond

1.   Title of the Lesson: Power of Algebra through “Simultaneous Games”

2.   Brief description of the lesson

     Students will be presented with a simultaneous linear functions problem. They will be encouraged
     to solve the problem in a variety of ways, which should help them observe a relationship that is
     linear in nature and that can be represented in a variety of ways. In doing so we hope to show the
     pupils the links between different strands and how the world of mathematics and the skills and
     concepts that they learn are all inter-connected.

3.   Research Theme

In Davis College Mallow
                 (a) We want students to develop a positive disposition towards investigating,
                     reasoning and problem solving.
                 (b) We want students to be more motivated, self-directed and self-regulated.
                 (c) As mathematics teachers, we will actively support the achievement of these goals
                     by paying attention to the entry points in our every day classes.
                 (d) Students are regularly given opportunities to use prior learning to investigate
                     problems.

4.   Background & Rationale

     a) We have observed that students lack the skills needed to apply algebra to real life problems and
        hence become demotivated when studying it. This problem and our responses should help the
        students who struggle to model relations by using linear equations. We also want to highlight
        the need for algebra in quickly and efficiently making predictions by comparing its efficacy to
        other methods.
     b) We believe that a great number of our students are visual learners. Hence we will be linking all
        other representations of the problem with the graphical solution and highlighting the links
        between them.
     c) We are also aware of the on-going need to present students with problems that allow them to
        see the links between various strands hence improving their conceptual understanding of the
        course in its entirety. We want to present a problem that allows them to create links between
        strands such as algebra, patterns, functions and co-ordinate geometry. We want to try to
        empower students to develop these links by creating a practical problem that can be interpreted
        in various ways which include tables, diagrams and graphs.

                                                                     Maths Development Team: Lesson Study 2017-2018
5.   Relationship of the Unit to the Syllabus

       Related prior learning       Learning outcomes for this      Related later learning outcomes
              Outcomes                          unit
  In Primary School the child Students should be able to:           Junior Cert
  should be enabled to:          ●
                                   ● use tables to represent a      Co-ordinate Geometry:
  ● explore the concept of a         repeating-pattern situation.      • Finding the equation of
      variable in the context of   ● generalise and explain               the line using -
      simple patterns, tables and    patterns and relationships           y=mx+c
      simple formulae and            in words and numbers.             • Finding the y-intercept
      substitute values for        ● write arithmetic                     and slope of a line
      variables.                     expressions for particular           using y=mx+c
  ● identify and discuss             terms in a sequence               • slope of a line
      simple formulae from         ● use tables, diagrams and          • Intersection of two
      other strands.                 graphs as tools for                  lines
  ● substitute values into           representing and analysing
      formulae and into              linear relations.              Patterns:
      symbolic rules developed     ● develop and use their own         • Identifying and
      from number patterns.          generalising strategies and
                                                                          representing linear
                                     ideas and consider those of
                                                                          patterns and
  In other subjects they will        others.
                                                                          sequences.
  have:                            ● present and interpret
●                                    solutions, explaining and
                                                                    Interpreting real-life graphs
  ● used tables, diagrams and        justifying methods,
      graphs as a tool for           inferences and reasoning          • Exploring
      analysing relations.         ● use representations to               proportionality
  ● developed and used their         reason about the situation        • Making predictions
      own mathematical               from which the                    • Slopes and rates of
      strategies and ideas and       relationship is derived and          change
      considered those of others.    communicate their
  ● presented and interpreted        thinking to others.            Leaving Cert
      solutions, explained and
      justified methods,                                            Algebra
      inferences and reasoning.                                        • Solving simultaneous
                                                                          equations (linear and
                                                                          linear, linear & non-
                                                                          linear)

                                                                    Co-ordinate Geometry:
                                                                       • Finding the equation of
                                                                          the line using
                                                                          y=mx+c
                                                                       • Finding the y-intercept
                                                                          and slope of a line
                                                                          using y=mx+c
                                                                       • slope of a line
                                                                       • Intersection of two
                                                                          lines

                                                                     Maths Development Team: Lesson Study 2017-2018
Sequences and Series
• Identifying and
representing linear,
quadratic and
exponential patterns
and sequences
Calculus:
• Rates of change
• First differentials
• Second differentials
• Interpreting graphs
6. Goals of the Unit
In the course of studying this strand the learner will;
• engage with the concept of a function (that which involves a set of inputs, a set of possible outputs
and a rule that assigns one output to each input).
• emphasise the relationship between functions and algebra.
• connect graphical and symbolic representations of functions.
• use real life problems as motivation for the study and application of functions.
• use appropriate graphing technologies.
7. Unit Plan
Lesson Learning goal(s) and tasks
1 Introduce relations through a real life problem
The Research Use a suitable problem to
Lesson (a) Understand that relations can be expressed and solved
1×50 minutes numerically.
(b) Understand that relations can be expressed and solved
graphically.
(c) Understand that relations can be expressed and solved
algebraically.
Maths Development Team: Lesson Study 2017-20182 Proportional Relations
1×40 minutes The students will explore and hence define what relations are. Students will look
at relations as a relationship between two sets, a set of inputs and outputs using a
table and will link this also to the graph. They will specifically explore
proportional linear relations. The students will represent these relations using
suitable tables and graphs. Students will be able to define what a linear pattern
looks like by linking the numerical patterns that emerge from the problem to the
graphical representation of the problem. Links can be made to co-ordinate
geometry here. (i.e. representing the equation of a line in the form of y=mx+c)
Relate to research lesson
3 Non proportional relations
1×40 minutes Explore non-proportional linear relations. The students will represent these
relations using suitable tables and graphs. Link the numerical pattern that
emerges to the graphical representation of these relations. Reinforce the concept
of looking at relations as a relationship between two sets, a set of inputs and
outputs using a table and link this also to the graph. Links can be made to co-
ordinate geometry here. (i.e. representing the equation of a line in the form of
y=mx+c) Relate to the relations explored in the research lesson.
4 Linear relations
2×40 minutes Represent linear relations using graphs. Reinforce the concept of looking at
relations as a relationship between two sets, a set of inputs and outputs using a
table and link this also to the graph. Relate to the relations explored in the
research lesson
5 Quadratic relations
2×40 minutes Represent quadratic relations using graphs. Reinforce the concept of looking at
relations as a relationship between two sets, a set of inputs and outputs using a
table and link this also to the graph.
6 Exponential relations
1×40 minutes Represent exponential relations using graphs. Reinforce the concept of looking at
relations as a relationship between two sets, a set of inputs and outputs using a
table and link this also to the graph.
7 Introduction to functions
2×40 minutes Introduce the students to functions. Build on the concepts of inputs and outputs.
Represent relations using mapping diagrams and couples. Students will start to
define the 2×40 minutes of a function from a mapping diagram. Link the
mapping diagrams to the graphical representations of the problem.
Create mapping diagrams for the relations explored in the research lesson.
Define the domain, co-domain and range of such relations.
Explore how to define if a relation is or is not a function using a variety of
different representations.
8 Function Notation
3×40 minutes Explore different notation using different mathematical relationships (linear,
quadratic and exponential). Explore different functions in context and link the
function notation and algebraic notation to the different relationships being
explored. Answer questions both graphically and algebraically. The lesson study
problem can be used here also to contextualize the skills being practiced.
Students will begin to graph basic functions.
Maths Development Team: Lesson Study 2017-20188. Goals of the Research Lesson:
a) Students will understand that there is more than one way of representing linear relationships, i.e.
problems involving such relationships can be solved numerically, by using a table, algebraically
(and by using function notation) or graphically.
b) Students will experience how and why algebra is used specifically in relation to representing
relationships between variables.
c) We want students to recognize that all strands are interconnected and that it is important and
that real life problems can be solved in a variety of ways.
d) Key Skills & Statements of Learning
In the planning and design of this lesson the Junior Cycle Key Skills and Statements of
Learning have been considered. This lesson will implement and promote JC Key Skills in the
following ways:
1. Being Literate: Students will have the opportunity to express their ideas clearly and
accurately
2. Being numerate: it will develop a positive disposition towards problem solving
3. Managing myself: Students will have the opportunity to reflect on their own learning
4. Staying well: Students confidence and positive disposition to learning will be promoted
5. Communicating: Students will present and discuss their mathematical thinking
6. Being creative: students will explore options and alternatives as they actively participate in
the construction of knowledge.
7. Working with others: Students will learn with and from each other.
JC Statements of learning:
1. The student communicates effectively using a variety of means in a range of contexts
15. The student recognises the potential uses of mathematical knowledge, skills and understanding
in all areas of learning
16. The student describes, illustrates, interprets, predicts and explains patterns and relationships.
17. The student devises and evaluates strategies for investigating and solving problems using
mathematical knowledge, reasoning and skills.
9. Flow of the Research Lesson:
Steps, Learning Activities Teacher Support Assessment
Teacher’s Questions and Expected Student Reactions
Introduction (2 mins) Students will be made to
Welcome students into the class and make them aware of Does anyone notice anything feel comfortable in order
the role of the teachers in the class to help them feel different about today’s class? that they are willing to
comfortable about the process. Ensure that they know that explore the problem
the teachers are not here to judge and that today’s class is without any stress.
all about participation and enjoyment.
Posing the Task (5mins)
There are two companies that can supply a new video game. At the start after week “0” The first three questions
Game Stopper tells us that it has 40 units in stock but is how much does each supplier are for the students who
selling more than it is producing resulting in its warehouse have? might struggle to
losing 2 units each week. Crazy Games Inc. informs us that What does “losing” and comprehend the nature
it has 20 units in stock but is producing more than it is “gaining” mean? What of the problem?
selling resulting in its warehouse gaining 2 units each week. mathematical operations do
After how many weeks will CrazyGames Inc. have the these apply to? Students need to
Maths Development Team: Lesson Study 2017-2018same number of units as GameStopper? Can you solve this comprehend the problem
problem in as many ways as possible? After week 1 and 2 how many fully to spot the patterns
units do each company have in involved and hence, be
Game Stopper: stock? able to represent the
problem using a table
40 Units How many ways can we solve and graph. In order to do
this problem? How can we so we can look at what
2 Units solve this problem quickly and happens to both
- efficiently? companies’ stock over
the first few weeks.
Crazy Games:
The 4th question is to
ensure that students
approach this problem in
20 Units diverse ways using
2 Units
+ multiple methods.
We want to show the
connections between
different strands by
allowing the pupils to
represent and solve the
problem in a variety of
ways.
Student Individual Work
Response 1:
Numerical Method (Number crunching) If a student is struggling to Response 1
comprehend the problem and If a group is struggling
approach it numerically this hopefully they will be
Crazy Games: Game Stopper: will be the only time that able to use the numerical
20,22,24,26,28,30,32,34 40,38,36,34,32,30,28,26 assistance will be provided. method to solve the
1 2 3 4 5 6 7 1 2 3 4 5 6 7 Otherwise the teacher will problem.
After week 5 they are the same. monitor the progress of the
class and gather appropriate
responses that they will use to
show the flow of logical
responses.
Response 2: Response 2
Creating a table to help explore the relationship We will try to use an
One of many possible responses in table form example of a table that
Week Number shows the relationship
between time and the
of units number of units. Ideally
0 20 we would like a
1 22 highlight a table that
2 24 shows the pattern
emerging through the
3 26 use of multiplication.
4 28
5 30
Maths Development Team: Lesson Study 2017-2018Week Number
of units
0 40
1 38
2 36
3 34
4 32
5 30
Response 3: Response 3
Using Arithmetic: If a student has started to
use this approach and
GameStopper starts with 40 and CrazyGames with 20. not succeeded, we may
Therefore, GameStopper has 20 more than CrazyGames. look at using that
Each week GameStopper reduces by 2 and CrazyGames approach in a further
increases by 2 so the difference is 4 units. class
20/4=5 weeks
Response 4: Response 4 can be
Creating algebraic representations of the relationship. written in different
variables and this must
Number of units = 40 - 2 × number of weeks be taking into account.
number of weeks = x (or another variable possibly) The equations can also
number of units = y (or another variable possibly) be solved
y= 40 - 2x simultaneously or by
using substitution. If
Number of units = 20 + 2 × number of weeks possible we will try to
number of weeks = x (or another variable possibly) find an example of each
number of units = y (or another variable possibly) method.
y = 20 + 2x
Addressing common
Students may use the substitution method or solve the two errors:
equations simultaneously. We can also use an
example that may have
40 - 2x = 20 + 2x failed to change all the
20 = 4x signs when attempting to
5 = x = number of weeks cancel one of the
variables.
Or
y=40-2x
y=20+2x
-------------
0=20-4x
4x=20
x=5
Maths Development Team: Lesson Study 2017-2018Response 5: Response 5
Graphical Method: We will try to find a
50 Number of Games
See If you can use the graph to help you with the Problem graph that has both
40
relationships graphed on
it. If we cannot, we will
30
use a combination of
20
student responses to try
to form the anticipated
10
graphical response that
0
Time in Weeks will be pre-prepared.
0 1 2 3 4 5 6 7 8 9 10
50 Number of Games
Addressing common
errors:
40
If students have mixed
30
y=20+2x
up their x and y values
and have consequently
20
y =40−2x
made mistakes plotting
10
points we can highlight
this common mistake by
showing some of those
Time in Weeks
0
0 1 2 3 4 5 6 7 8 9 10
graphs.
Ceardaíocht /Comparing and Discussing
Response 1: (2 mins) Hands up who used this Show that everyone can
Numerical Method (Number crunching) approach? Do you think this is access a problem by
a good approach? Why? When selecting a student’s
If a group is struggling they should be able to approach the is this method suitable? If the response who may not
problem numerically. If this is the case their numerical numbers were greater in have found further ways
approach will be chosen. The teacher will test the speed and magnitude or more awkward of solving the problem.
efficiency of this approach to predict the future? in nature (i.e dealing with
thousands and fractions)
A response that clearly shows the linear pattern that’s would this be a suitable Assessment worksheet:
created by each companies growing or falling number of method? Can we make quick and
units can be used later to show why a pattern of such is efficient predictions
linear in nature. using this method? -
Ask this question before
We can make reference to the pattern that emerges from the and after asking the
increasing and decreasing number of units of each below questions to see if
company. their opinion has
changed.
After how many weeks
will Gamestopper be out
of stock? How many
units will CrazyGames
have after 27 weeks?
Response 2: (8 mins)
Creating a table to help explore the relationship How many people used a table We are starting to talk
of some sort to find a about a relationship
We will use an example that attempts to identify the solution? Why did you use it? between 2 things and
relationship that the problem is creating between time and What relationship are you how we can present it in
the number of units or each company. If no student has looking at and what does this a structured manner.
done so we will verbally ensure that the students are aware table show us? or Does this Through more structure
of the relationship that they are exploring. We will have a table identify a relationship? we can start to define the
table like the one below that can be filled out in part by How many people used relationship.
students who spot the pattern that emerges between the addition in order to find the
number of weeks and number of units. number of units that each Use a variety of
Maths Development Team: Lesson Study 2017-2018company had? How many responses here in order
Week Number Number of people used multiplication? to include as many
What are the benefits of using people as possible.
of units units
multiplication? Different people might
0 20 20 + 20 show the relationship in
2(0) Are we becoming more a variety of ways so we
1 20+2 20 +2(1) 22 efficient at predicting the need to be adaptable
future? Why? If we can spot here.
2 20+2+2 20+2(2) 24 the pattern is it easier to
3 20+2+2+ 20+2(3) 26 predict what happens next. Assessment worksheet:
2 Can we make
4 20+2+2+ 20+2(4) 28 predictions quickly and
Does this approach allow us to efficiently using this
2+2
define the relationship method. How many
5 20+2+2+ 20+2(5) 30 between weeks and number of units will CrazyGames
+2+2+2 units. Why? have after 33 weeks?
By asking this and
The table helps show how the relationship is formed. Can we express this observing how many
“The number of units = 20 + 2 times the number of weeks” relationship in words? students write 20+2(33)
“The number of units we can assess if the
CrazyGamesd has is always students understand the
20 plus 2 times…The number relationship that the
of units Gamestopper has is table has revealed.
always 40 minus 2 time”
Week Number
of units
0 40 40-2(0) 40
1 40-2 40-2(1) 38
2 40-2-2 40-2(2) 36
3 40-2-2-2 40-2(3) 34
4 40-2-2-2- 40-2(4) 32
2
5 40-2-2-2- 40-2(5) 30
2-2
Once again the table helps show how the relationship is
formed.
“The number of units = 40 minus 2 times the number of
weeks”
If someone has tried and This approach to
Response 3: (2 mins) succeeded to use this problem solving will not
Using Arithmetic: approach we will ask them. be explored in detail as
Why did you use this it has many limitations
If this response is used, we will look at it but will not go approach? Do you think it is and is not really linked
into the fine details of the method. an easier or more efficient to the learning outcomes
approach than the previous of the lesson.
approaches? Why? Can we
predict the future quicker
using this method? Let’s see.
How many units will .. . have
after x weeks?
Ask the class: Here we are showing
Response 4: (10 mins)
Maths Development Team: Lesson Study 2017-2018Creating and using algebraic equations to solve the Can we use algebra by using how a mathematical
problem. variables to solve this relationship can be
problem? Who attempted to defined using algebra.
If no student has used an algebraic response, we will reason do so? We are also showing
the response out in this manner how people can arrive at
If a student has solved this this relationship by
What is the relationship between the number of units that problem using algebra we will being able to put it into
each company has and the number of weeks? Where have question them on the words. This is important
we identified this relationship - link to response 2. – VERY following: as it shows the students
IMPORTANT that there is more than
• How they identified one way to access this
We saw that: the relationship? algebraic solution. We
“The number of units = 20 + 2 times the number of weeks” • Their use of variables are also highlighting the
Number of units = 20 +2 × number of weeks • Their method of power of algebra in
Let’s say we let number of weeks = x and solving the equations efficiently and quickly
let’s say that the number of units = y (simultaneously or predicting events.
Can we create an equation with x and y in it? substitution method)
We will not spend time
For the other company we saw that: We will compare their debating the different
Number of units = 40 - 2 × number of weeks response to the anticipated methods in solving the 2
Let us say we let number of weeks = x and response. equations.
let’s say that the number of units = y
Can we create an equation with x and y in it? Ask the class: We are also introducing
How do people find this the concept of a function
method? Would you use such here as well as briefly
We will show the substitution and simultaneous method of a method to solve other exploring function
solving the equations problems this way? notation in context.
y=20 +2x Does algebra allow us to make
y=40-2x quick and efficient
By substituting y for y we get: predictions? Let’s see. Use Addressing common
40 - 2x = 20 + 2x this method to answer the errors:
20 = 4x following: Incorrect substitution: If
5 = x = number of weeks students have substituted
Assessment worksheet: the values in for the
Or Can you use these equations to wrong variables while
answer the following attempting to answer the
y=40-2x questions? questions on the
y=20+2x How many units will Crazy assessment worksheet
------------- games have after 55 weeks? we can address this
0=20-4x After how many weeks will problem here.
4x=20 Crazy games have 88 units in
x=5 stock? We are also introducing
Wait for student responses and the concept of a function
We can also check if our solution is correct. How? assess the amount of correct and function notation.
responses and the method We will assess their
We can also express this relationship in another way using used. initial understanding
functions. A function is a . ……..
Ask the class:
The two functions we can create are : What were the benefits of
f(x) = 20+2x using algebra compared to
and previous methods? Was this a
g(x) = 40-2x quick method?
If I said f(1) = 22 what do you think that means? Now that we have briefly
If I said g(1) = 38 what does this mean? looked at function notation
can you answer the following
questions?
Maths Development Team: Lesson Study 2017-2018Assessment worksheet :
What is the value of f(2) ?
What is the value of g(3) ?
(Can you find x when f(x) =
4? Optional ) Here we are creating a
link between the
Response 5: (5 mins) Ask the class: graphical representation
Graphical method How many people used a of the relations and the
graph to solve this problem. other responses. This is
We will use the most accurate graph but will also have one How many people just plotted important in showing
prepared to use on the board. If students have not included points? How many people why certain equations
both relationships on the one graph we can use a variety of joined those points? What did and patterns are called
graphical responses to help create the prepared anticipated you see happening when you linear.
responses. did so?
In asking them if they
To the person whose graph is liked solving it this way
50 Number of Games
See If you can use the graph to help you with the Problem chosen: we are exploring why
40
How does this graph help us graphs are used in
solve the problem? What is the representing different
30
point of intersection between relationships in different
20
the two graphs? Did you like subjects and in the real
to solve the problem this way? world.
10
Why?
0
Time in Weeks We are not going to go
into great detail about
0 1 2 3 4 5 6 7 8 9 10
50 Number of Games
Ask the class: how to plot points but
What are the links between we can link response 2
40
this solution and other to how points are created
30
y=20+2x
responses that we have by using a table. Here
explored? we want to show them
20
y =40−2x
that points are plotted in
10
the following manner
Can you link response 2 to the (x,y)
graph? Look at how the table
Time in Weeks
0
0 1 2 3 4 5 6 7 8 9 10
creates ordered couples or Addressing common
points. errors:
We can identify the different functions at this point by If students have mixed
asking: What does this graph show us up their x and y values
“How else can I write y = 20+2x and y = 40-2x” about the relationship between and have consequently
the two variable quantities? made mistakes plotting
Can we see why the equations points we can highlight
are called linear equations. this common mistake.
Can we see why the pattern of Assessment worksheet:
numbers that emerges from
the number of units is called a From the graph can you
linear one. How can we tell if approximate when both
a pattern is linear in nature? companies will have 35
units of stock?
From the graph can you
find f(6) and g(7).
Which of the below
pattern are linear and?
33,36,39,42
-2,-5,-8,-11
21,24,26,29
Maths Development Team: Lesson Study 2017-2018Summing up & Reflection (5 mins)
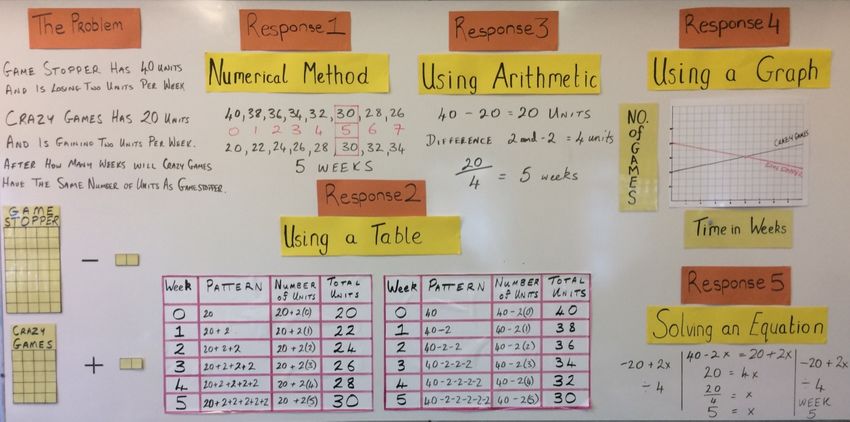
Use the layout of the board work to show the following:
• How a problem can be solved in a variety of ways.
(maths is for everyone!)
• Highlight how maths can teach us to solve
problems creatively and in a variety of ways.
• Show the power of algebra in making quick and
efficient predictions as opposed to other methods.
• Highlight how their algebraic skills stem from the
need to solve problems such as the one being
discussed.
• Show the link that we have made across different
strands –highlight that more can be made including
co-ordinate geometry and patterns. This example
can be used in further classes to help students link
different strands and to make more sense of them
as they can relate what they are learning to a
contextualized problem.
10. Board Plan
11. Evaluation
a) Were students more motivated, self-directed and self-regulated during this research lesson?
b) Do students understand that there is more than one way of representing linear relationships, i.e.
problems involving such relationships can be solved numerically, by using a table, using
arithmetic, algebraically (and by using function notation) or graphically?
c) Do students understand why algebra is used specifically in relation to representing relationships
Maths Development Team: Lesson Study 2017-2018between variables?
d) Do students recognize that all strands of mathematics are interconnected and that real life
problems can be solved in a variety of ways.
12. Reflection
a) During the lesson we hoped to observe four key areas at work.
1. Do students connect strands in mathematics by using problem solving?
2. Will students actually use different methods when solving a problem?
3. During the 10 minutes, will students be more self directed and motivated?
4. Can students use algebra to represent relationships?
b) During the lesson we actually observed the following.
1. Students did actually connect up the different strands in mathematics. They could see
first hand the different areas of mathematics being used.
2. We found that when students are left on their own with the problem they will endeavor to
find different methods from different strands. We were quite surprised at the amount of
students who tackled the problem in different ways. In particular, one interesting
approach which had been predicted, came up in a most unusual fashion.
The students were more motivated and actually took more ownership over the learning
process. It was very interesting to see this in action. There is much research to suggest
that for students from lower socioeconomic backgrounds, lessons are something that the
teacher does ‘to them’. In fact, research by Lubienski (2000) suggests that this is a major
problem facing mathematics teaching. We feel that Lesson Study is one area that will
improve this situation.
3. We did identify conceptual weakness. Not all students were capable of the next step with
this research lesson. That is the idea of using algebra to represent relationships. By the
end of the lesson they did understand that there was a quicker way to answer the
problem. The research lesson did expose a weakness in the students learning and
knowledge.
c) Post lesson Discussion
During the post lesson discussion there was a high air of positivity with the way the lesson had
progressed. We were very impressed with the methods employed by the students. We all agreed
that we as teachers can interfere in the problem solving process. Sometimes when we think we
are helping we might be better leaving students to their own devices for a little longer.
There was a weakness as regards algebra. Students did not fully understand why algebra
is used specifically in relation to representing relationships between variables. However, with
the flow of the lesson this “lack of knowledge’ was apparent to the students even without the
teacher’s intervention. With the use of patterns on the board and with student responses it was
quite easy to develop the knowledge needed to tackle Functions and Algebra.
d) As the instructor I felt that the Lesson was a success overall. This was due in no small part to the
level of work put into the lesson proposal and in particular the boardwork. Everything was
ready, seating plans, handouts and boardplan and this made the lesson run smoothly. Each
observer collected the data from his/her group of students and this led to an informed post lesson
discussion. The teachers were engaged and they observed the protocols. The students displayed a
very positive attitude towards the lesson. The post lesson discussion dealt with the goals and the
research theme of the lesson. We went through the methods employed, misconceptions and the
questions the students asked. We believe the students really gained huge benefit from the class.
They got the opportunity to connect up strands of Mathematics that could not have happened in
Maths Development Team: Lesson Study 2017-2018an ordinary lesson. Overall a thoroughly rewarding experience and possibly the best CPD that
we, as teachers, have done in our careers.
e) We believe this is a great starting point for our schools in the whole process of lesson study. The
knowledge we have gained is invaluable. Even as the process was unfolding over the weeks,
other ideas have come to the teachers involved. Ideas for new lesson Study Research Lessons
have been spoken about. Even the one Research Lesson we developed above could be taken in
so many different directions, covering many different strands of Mathematics. The future then, is
very bright indeed. At this stage the teachers would like to thank all those who guided us through
the process, our instructor Ronan O’ Sullivan and all those involved at national level with the
Project Maths Development Team, (PDST).
STUDENT REFLECTIONS:
Student 1 I learned that there are various ways to do one question and that they are
all linked to each other. It was more interactive and fun than a normal
class. I learned a lot from it.
Student 2 I really enjoyed this lesson as it involved student interaction and it really
taught us something that we can use in the future.
Student 3 I learned that Algebra ties in with large areas of of Maths and that
multiplication can simplify the work. It made me think more about
connections in Maths.
Student 4 Even though I thought there would only be one or two ways to finish the
problem, there were many more. It was fun to be left on your own to do
the sum in as many ways as possible.
Student 5 That there are multiple ways of solving one question, using all the
different methods of maths. Also everything in Maths seem connected to
each other. This lesson gave me a new insight into Maths.
Worksheet for research Lesson:
Research Lesson Davis College 31/01/2018
Enjoy!
There are two companies that can supply a new video game. Game Stopper tells us that
it has 40 units in stock but is selling more than it is producing resulting in its
warehouse losing 2 units each week. Crazy Games Inc. informs us that it has 20 units
in stock but is producing more than it is selling resulting in its warehouse gaining 2
units each week. After how many weeks will CrazyGames Inc. have the same number
of units as GameStopper? Can you solve this problem in as many ways as possible
using the worksheet provided?
Maths Development Team: Lesson Study 2017-2018Game Stopper:
40 Units
2 Units
-
Crazy Games:
20 Units
2 Units
+
Worksheet
Maths Development Team: Lesson Study 2017-201850 Number of Games
See If you can use the graph to help you with the Problem
40
30
20
10
Time in Weeks
0
0 1 2 3 4 5 6 7 8 9 10
Response 1:
How many units will CrazyGames have after 27 weeks?
Response 2:
How many units will CrazyGames have after 33 weeks?
Response 4:
How many units will Crazy games have after 55 weeks?
Response 4:
After how many weeks will Crazy games have 88 units in stock?
What is the value of f(2)?
What is the value of g(3)?
Maths Development Team: Lesson Study 2017-2018(Can you find x when f(x) = 4?
Response 5:
From the graph can you approximate when both companies will have 35 units of stock?
(From the graph can you find f(6) and g(7). – Only question this if we have related the graphs to functions)
Which of the below pattern are linear? State Y or N
33,36,39,42
-2,-5,-8,-11
21,24,26,29
Maths Development Team: Lesson Study 2017-2018You can also read


