Trends in Recreation
     and Sport

                  2011
←
→
Page content transcription
If your browser does not render page correctly, please read the page content below
Trends in Recreation
and Sport
2011
TRENDS IN RECREATION AND SPORT
Overall Participation
The Exercise, Recreation and Sport Survey (ERASS) collects information on adult
participation (aged 15+) in sport and physical activity. ERASS has been collected for 10
continuous years on behalf of the Australian Sports Commission and the state and
territory government agencies responsible for sport and recreation. It provides
important information on the levels, type and frequency of participation and has been
used as the basis for the trends and analysis presented below.
 The ERASS overall participation trend shows that South Australian’s participation rate
is in line with the national average (see Figure 1) and the rate of participation has
shown a steady increase from 74.7% in 2001 to 82.3% in 2010.
Figure 1: Participation trend 2001-2010

                                                  Overall Participation Trend
  Population Participation Rate

                                                           (Adults 15 y.o.+)
                                  100

                                   90
                                                                                                         82.3
                                          74.7
                                   80

                                   70

                                   60

                                   50
                                          2001   2002   2003   2004   2005   2006   2007   2008   2009   2010
                                  Aus %   77.8   77.8   82.5   82.8   83.3   80.5   79.3   83.4   81.7   82.3
                                  SA %    74.7   77.8   82.5   80.1   82.6   79.7   79.4   83.3   82     82.3

Regular Participation
In order to realise a range of social and physical benefits, an individual should partake
in regular physical activity. The be active message is the unified voice of government
advocating for greater physical activity. Awareness of the be active brand continues to
grow as do intentions to adopt positive behaviours. These intentions are showing in the
ERASS series where regular participation (defined as 3 x per week or more) has
increased from one third of the adult population in 2001 to almost half the adult
population in 2010. (see Figure 2)

                                                                                                                2
Figure 2: Regular Participation Trend 2001-2010

                                                             REGULAR Participation Trend
  Population Participation Rate                                (three per week or more)
                                             60
                                                                                                                                48.5
                                             50

                                             40
                                             30
                                                     32.6
                                             20

                                             10
                                              0
                                                    2001    2002      2003     2004    2005   2006   2007      2008    2009     2010
                                            Aus %   37.2    38.8      45.8     47.2    44.2   42.8   43.5      49.3    45.4     47.6
                                            SA %    32.6    37        45.4     42.7    40.8   38.6   41.2      49.9    47.7     48.5

A closer examination of regular participation reveals that women are significantly more
likely to undertake regular physical activity (3x per week or more) than their male
counterparts and this disparity is most significant during middle age (see Figure xx).
Figure XX: Regular Participation in physical activities by age and gender

                                                    Regular Particiaption by Age and Gender (2010)
                                       70

                                       60

                                       50
                     % of population

                                       40

                                       30

                                       20

                                       10

                                       0
                                              15 - 24       25 - 34          35 - 44     45 - 54     55 - 64          65+
                                                                                 Age                                  males
                                                                                                                      females

Type of Participation

One of the key differentiators of participation is the extent the activity is “organised”.
Organised participation is defined when the activity is organised in full or part by a club,
association or other type of organisation. This is an important distinction as it provides an
insight as to where the participation takes place and the human and physical
infrastructure required to facilitate it. And as such has implications for the type of
support required to sustain, grow and/or improve the participation experience.

Modern lifestyles have resulted in a trend of increasing uptake of non-organised physical
activities. Participation in these activities has grown by more than 7% points across
Australia since 2001 (from 63% to 71%).

Despite this trend of increasing participation in non-organised physical activities, overall
participation in organised activities has remained fairly steady (approximately 40% of the
population) for the last 10 years. In 2010, 41% South Australian adults reported
participating in organised physical activities (see Figure 3). Unlike regular activity, males
are more likely to undertake physical activities in an organised environment compared
females (45% vs 37% respectively).

                                                                                                                                       3
Figure 3: Organised vs Non-Organised Participation Trend 2001-2010
Type of Participation
(Organised vs Non-Organised Trend)
80
Population Participation Rate
70.8
70
63.4
60
50
40.2 41
40
30
2001 2002 2003 2004 2005 2006 2007 2008 2009 2010
Aus - Organised 39.9 40.9 42.7 42.7 41.8 39.1 38 40.8 39.1 40
SA - Organised 40.2 39.3 43.5 39.5 42.2 38.8 37.7 40.4 39.8 41
Aus - Non-organised 63.4 62.7 68.1 69.8 69.3 67.1 64.4 72.5 70.7 70.8
SA - Non-organised 62.8 71.9 69.8 71.1
Tracking the participation rate is important from a public health and well-being
perspective as it illustrates the proportion of the population that is physically active and
engaged in their communities. However, for recreation and sport planning it is equally
important to track the gross number of participants to ensure the provision of physical
infrastructure and appropriately trained human resources account for population growth
and meet the needs of the community.
Number of Participants
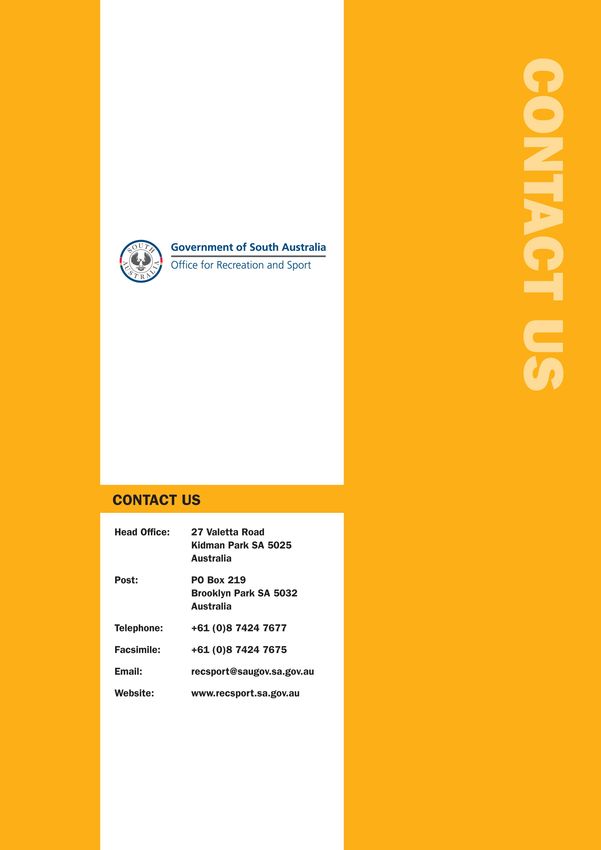
Since 2001, the number of South Australian adults (15 y.o.+) that participate in physical
activities for exercise recreation of sport has grown from 890,000 to 1,080,000. This
includes an additional 62,000 participants involved in organised activities, taking the
total number of organised participants to 538,000. However, it is when we examine the
growth in regular participants that we start to appreciate the strain on the sporting
infrastructure. Since 2001 there are an additional 250,000 regular participants (see
Figure 4). If we assume that on average these additional regular participants have only
doubled their previous exercise and activity regime, our infrastructure has to facilitate
375,000 extra participation occasions per week or almost 20 million extra participation
occasions per annum.
Figure 4: Number of Participants 2001-2010
Number of Participants (000's)
Number of Participants in South Australia
1,250
1,000
750
636.3
500
250 386.7
0
2001 2002 2003 2004 2005 2006 2007 2008 2009 2010
All Participants 886 928.3 993.2 970.3 1006.7 985.6 990.9 1052.7 1060 1079.1
Regular Participants 386.7 441.7 546.1 517.2 497.2 476.5 515 631.1 588.5 636.3
Organised Participants 476.3 469.1 523.3 478.7 514.3 481.3 470.3 511.2 507.3 538.3
4
Popular Activities

In 2010 the most popular activities for adults were walking, aerobics, cycling, swimming
and running. Of these activities walking, cycling and running require little sport specific
infrastructure with the majority being undertaken on footpaths, trails, linear parks and
cycle lanes.

The most popular organised sports were aerobics/fitness, netball, Australian rules,
tennis, golf, lawn bowls, cricket and football (soccer). (see Figure 5) The majority of
these activities are undertaken on specific purpose playing fields or courts maintained by
sport organisations and local government.

Figure 5: Top 20 Activities for Adults (2010)
             Top 20 Activities by Type of Participation
                 South Australian ADULTS 2010
                                  Adult Participants ('000)
                              All Adult Par-       Organised      Proportion
  Activity                       ticipants        Participants    Organised

  Walking (other)                      514.5               22.2         4.3%
  Aerobics/fitness                     319.3              103.7        32.5%
  Cycling                              150.4               16.5        10.9%
  Swimming                             132.9               25.0        18.8%
  Running                              125.7               22.2        17.7%
  Tennis                                91.6               45.5        49.7%
  Netball                               79.6               66.0        82.8%
  Golf                                  69.7               36.8        52.8%
  Australian Rules football             68.6               51.1        74.5%
  Walking (bush)                        60.8                7.9        13.1%
  Cricket (outdoor)                     54.4               35.2        64.8%
  Weight training                       46.3                6.1        13.2%
  Basketball                            46.0               30.9        67.3%
  Football (outdoor)                    44.3               33.6        75.8%
  Yoga                                  42.4               21.1        49.7%
  Lawn bowls                            41.5               36.5        88.0%
  Martial arts                          27.6               23.1        83.7%
  Fishing                               26.5                1.0         3.8%
  Surf sports                           25.7                6.0        23.4%
  Dancing                               21.8               16.1        74.0%

                                                                                              5
Youth Participation              Figure xx: Youth Organised Sport Participation Trend

According to the ABS (2009),                    Youth 5-15y.o. Participation Trend
136,000 youth, (or 71%)

                                 Population Participation Rate
                                                    (Organised Sport or Dancing)
                                         80
played organised sport outside
of school hours. The trend               75
                                                                                    70.9
since 2000 of an increasing              70
participation rate for youth             65
                                             65.2

across Australia has been
replicated in SA. (see Figure            60

xx). Much of this “organised”            55

participation is facilitated             50
through schools or community                 2000         2003            2006     2009
                                       Aus % 64.0          66.7           67.9     68.7
clubs and associations, and is         SA %  65.2          67.3           66.5     70.9
supported by a significant
volunteer effort. In fact, the
ABS estimates that 40% of fathers and more than 20% of mothers of 5-14 y.o.’s volunteer
for a sport and recreation organisation.

The ABS did some analysis of the characteristics of non-participating youth and found that
the country of birth and employment status of parents were significant indicators that
impact on participation. Youth born overseas in non-english speaking countries (40%), or
with parents born overseas in non-english speaking countries (42%) were significantly less
likely to participate in sport than their locally born neighbours (72%). The ABS reported
that 37% of youth with a single (unemployed) parent and 41% of youth in a couple family
(both unemployed) participated in organised sport.

                                                                                             6
The table below illustrates the most popular organised activities for youth in South
Australia. Australian Rules football, swimming and netball all attracted an estimated 30,000
youth participants (see figure xx)

Figure xx: Top 15 Activities for SA Youth (2009)

             Top 15 Organised Activities
            South Australian YOUTH 2009
                           Youth Partici-       Youth Participation
Activity                    pants ('000)            Rate (%)
Bike Riding*                          121.1                   62.7%
Skateboarding/
rollerblading*                           89.4                46.3%
Australian Rules foot-
ball                                     31.2                16.2%
Swimming                                 29.9                15.5%
Netball                                  29.9                15.5%
Basketball                               26.6                13.8%
Dancing                                  24.6                12.8%
Football (outdoor)                       17.8                 9.2%
Tennis                                   16.4                 8.5%
Cricket                                  16.2                 8.4%
Gymnastics                               10.6                 5.5%
Martial Arts                              6.2                 3.2%
Athletics, track and
field                                     3.9                 2.0%
Football (indoor)                         3.5                 1.8%
Hockey                                    1.6                 0.8%
Other organised sports                   23.0                11.9%

At least one organised
sport                                128.0                   66.3%

* includes non-organised participation

Sport makes a significant contribution to the physical,
psychological and social well being of young people and
is an effective way of producing benefits for both the
individual and Australian society. Furthermore, research
investigating the link between youth participation and its
impact on adult physical activity support the conclusion
that persistent participation in sport in particular
increases the probability of a higher level of physical
activity in later life. Thus increasing the quality and
accessibility of youth sport is an important consideration
in the overall sport system.

Regional Snapshot
Regional communities have a reputation for supporting
local sport and recent research would reinforce that
notion. Regional communities are more likely to

                                                                                               7
participate through a club based structure, are                    Figure xx – Key regional stats
more likely to volunteer and more likely to be
a spectator than their metro counterparts                                         Club Player
(see Figure xx).                                         York & Mid North
                                                         Murray & Mallee
                                                          Limestone Coast
                                                                 Far North
In fact in the regional communities an                     Eyre & Western

estimated one third of adults participated in                 Fleurieu & KI
                                                                   Barossa
exercise recreation and sport via their club                 Adelaide Hills
                                                         Western Adelaide
based infrastructure and almost one quarter                      Southern…
                                                                 Northern…
were involved as a coach, official, umpire or             Eastern Adelaide

administrator. The only exception to the
significant region vs metro difference was in                                 0       10          20
                                                                                            % of Population
                                                                                                              30        40

the Murray & Mallee region. Whilst the whole
of South Australia was in drought, the Murray
was in crisis thus the result is not surprising                       Coach/Official/Admin
                                                         York & Mid North
and is perhaps another of the well                       Murray & Mallee
                                                          Limestone Coast
documented social impacts of the extreme                         Far North
                                                           Eyre & Western
environmental event. (Although it should be                   Fleurieu & KI
noted that for both club participation and                         Barossa
                                                             Adelaide Hills
volunteering, the Murray and Mallee was on               Western Adelaide
                                                                 Southern…
par with the state average)                                      Northern…
                                                          Eastern Adelaide

When we examine participation via fitness,                                    0   5        10     15     20        25   30
leisure or indoor/outdoor sports centre,                                                   % of Population

higher participation is observed in
metropolitan regions. Serviced by both the                                        Spectator
commercial and not-for profit sector, supply is
                                                         York & Mid North
                                                         Murray & Mallee
concentrated around areas of high population              Limestone Coast
                                                                 Far North
density.                                                   Eyre & Western
                                                              Fleurieu & KI
                                                                   Barossa
                                                             Adelaide Hills
                                                         Western Adelaide
Sport and Recreation Administration                              Southern…
                                                                 Northern…
Community sports clubs and associations are               Eastern Adelaide

non-profit organisations that exist to provide
                                                                       0       20       40        60    80
sport and recreation opportunities for their                                      % of Population
local communities. Most of these
organisations are administered on a                                      Fitness Centre
volunteer basis. In fact the sport and             York & Mid North
                                                    Murray & Mallee
recreation sector is the biggest beneficiary of Limestone Coast
volunteer labour, with one third of all                    Far North
                                                     Eyre & Western
volunteer effort applied to sport, involving            Fleurieu & KI
                                                             Barossa
367,000 South Australians contributing                 Adelaide  Hills
                                                   Western Adelaide
approximately 48million hours p.a. Further,                Southern…

compared to other sectors, volunteers in the               Northern…
                                                    Eastern Adelaide
sport and recreation field take on significant
responsibilities when you consider that 72%                            0     5      10       15
                                                                                  % of Population
                                                                                                     20 25

commit their efforts to an organisation with
no paid staff. The practical implication of this structure is that volunteers must assume
responsibility for sound governance including increasing regulations around insurance
and risk management, financial accountability, occupational health and safety and child
protection.

Sport and recreation organisations have a hierarchical structure, with National Sport
Organisations providing system leadership to state sport and recreation organisations

                                                                                                                             8
(SSO’s) who in turn provide leadership and support for regional associations and community
clubs. Most national and state organisations have professional paid staff and will assume
responsibility for sound governance, participation planning, high performance pathways,
education and training activities and facility planning. However, anecdotal evidence suggests
that the services that trickle down to community organisations are highly variable depending
on the focus of the national and state organisation and the capabilities of the community
level volunteers, which in itself varies between sites and over time.

The Value of Sport and Recreation
Sport and recreation helps to build communities through social inclusion and a sense of
connection, helps build families through shared experiences and shared achievements and
can help address anti-social behaviour and support education.

Sport’s contribution to Australia’s GDP is approximately 2% – larger than the motor vehicle
industry. It employs 220,000 people, generates $358 million in annual exports and almost
$1 billion in taxation revenue.
For every 10% of the population exercising regularly and moderately, a net benefit of about
$800 million is returned to the economy each year in reduced health care costs – even when
allowing for annual costs of injury resulting from physical activity.

Sport and recreation helps sustain the environment through protecting open space and
natural areas, and through the use of active modes of transport.

Sport and recreation is not the cure-all for society’s issues, but with quality delivery and an
appropriate level of support, it can significantly assist in a positive way.

Research in Western Australia confirms that the benefits derived from sport and recreation
are not only well understood by the community, but the benefits are regarded an extremely
important to both individuals and the community (see Figure xx).

Figure xx: Community Perceptions of Sport and Recreation

                                            %                                                   %
Individual Benefit                         Agre   Community Benefit                            Agre
                                            e                                                   e

Improves physical wellbeing                99%    Provides opportunities to meet others        96%
Teaches fair play and respect              94%    Creates close friendships                    96%
Builds confidence and self esteem          95%    Feeling part of the community                92%
Develops self discipline and commitment    94%    Builds stronger family relationships         87%
Teaches life-skills such as respect and    91%    Provides support networks                    91%
tolerance for others
Provides a sense of achievement            97%    Builds community pride                       89%
Makes you feel better (good) about your-   95%    Creates tolerant communities                 83%
self
Builds communication skills                89%    Reduces anti-social behaviour in the         85%
                                                  community
Develops leadership skills                 86%    Makes the community safer                    81%
Improves ability to cope with stress or    91%    Creates new life opportunities such as       84%
difficult situations                              travel, business contacts, career opportu-

Improves ability to learn                  88%

                                                                                                      9
Sport and recreation organisations facilitate community engagement and foster cohesion
to such an extent that membership is one of a suite of indicators used to measure social
capital. Similarly, volunteering is considered an indicator of social capital and thus both
receive favourable policy consideration from governments.

Implications for Funding Recreation and Sport
It is against this backdrop that we ask you to consider the questions posed as part of the
Office for Recreation and Sport Review of Funding Services. We ask you to bring your
experiences, knowledge and opinions to the table, but we also ask that you consider the
overall sport system when framing your responses. In particular we ask that you consider
the most effective use of resources to achieve our mission of encouraging all South
Australians to enjoy lives enriched through participation in quality sport and active
recreation.

    Australian Bureau of Statistics (2009) Children’s participation in Cultural and Leisure Activities. Catalogue No. 4901.0

    Australian Bureau of Statistics (2009) Voluntary Work, Australia. Catalogue No. 4441.0

    Telama R et al, (1997). Physical activity in childhood and adolescence as predictor of physical activity in young adultho
    Preventative Medicine 1997 Jul‐Aug; 13(4): 317‐23

    Department of Premier and Cabinet (2009) South Australian Strategic Plan Household Survey (Unpublished data)

    Australian Bureau of Statistics (2006) Volunteers in Sport. Catalogue No. 4440 .0.55.001

    Australian Sports Commission (1999) Beyond 2000. p.10

    Sport and Recreation Victoria (1997) The Business of Sport Melbourne, Victoria.

    Government of Western Australia (2008) Sport and Recreation, It’s More Than You Think. Viewed on the web at http://
    assets/files/Research/It's%20More%20than%20you%20think%20single%20page%20for%20web.pdf

    Australian Bureau of Statistics (2006). Sport and Social Capital. Catalogue No. 4917.0

                                                                                                                10
Contents
Review of Grant Funding for Recreation and Sport in SA ............................................................................. 1
Overall Participation ..................................................................................................................................... 2
Regular Participation..................................................................................................................................... 2
Type of Participation ..................................................................................................................................... 3
Number of Participants ................................................................................................................................. 4
Popular Activities .......................................................................................................................................... 4
Youth Participation ....................................................................................................................................... 5
Regional Snapshot......................................................................................................................................... 7
Sport Facilities ............................................................................................................................................... 8
Sport and Recreation Administration ........................................................................................................... 9
The Value of Sport and Recreation ............................................................................................................... 9
Review of Grant Funding for Recreation and Sport in SA
The following information describes the trends in recreation and sport in South Australia and has been
assembled to to inform a review of the Office for Recreation and Sport (ORS) grant funding programs.
We will be asking our stakeholders, including sport clubs and state organisations, councils, elected
members of state parliament and the general community, to provide feedback on a range of issues
during the consultation period.
When considering the questions posed as part of the ORS review of grant funding programs we expect
everyone to bring their experiences, knowledge and opinions to the review. However, we will also ask
that our stakeholders consider the overall sport system when providing feedback. In particular we will
be asking them to consider the most effective use of ORS grant resources to achieve our mission of
encouraging all South Australians to enjoy lives enriched through participation in quality sport and
active recreation.
1|PageOverall Participation
The Exercise, Recreation and Sport Survey (ERASS) collects information on adult participation (aged 15+)
in sport and physical activity. ERASS has been collected for 10 continuous years on behalf of the
Australian Sports Commission and the state and territory government agencies responsible for sport and
recreation. It provides important information on the levels, type and frequency of participation and has
been used as the basis for the trends and
analysis presented below. Figure 1: Participation trend 2001-2010
The ERASS overall participation trend
Overall Participation Trend
shows that South Australian’s
Population Participation Rate
(Adults 15 y.o.+)
100
participation rate is in line with the
90
national average (see Figure 1) and the 74.7
82.3
80
rate of participation has shown a steady
increase from 74.7% in 2001 to 82.3% in 70
2010. 60
50
2001 2002 2003 2004 2005 2006 2007 2008 2009 2010
Aus % 77.8 77.8 82.5 82.8 83.3 80.5 79.3 83.4 81.7 82.3
SA % 74.7 77.8 82.5 80.1 82.6 79.7 79.4 83.3 82 82.3
Regular Participation
In order to realise a range of social and physical benefits, an individual should partake in regular physical
activity. The be active message is the unified voice of government advocating for greater physical
activity. Awareness of the be active brand continues to grow as do intentions to adopt positive
behaviours. These intentions are showing in the ERASS series where regular participation (defined as 3 x
per week or more) has increased from one third of the adult population in 2001 to almost half the adult
population in 2010. (see Figure 2)
Figure 2: Regular Participation Trend 2001-2010
REGULAR Participation Trend
(three per week or more)
Population Participation Rate
60
48.5
50
40
30
32.6
20
10
0
2001 2002 2003 2004 2005 2006 2007 2008 2009 2010
Aus % 37.2 38.8 45.8 47.2 44.2 42.8 43.5 49.3 45.4 47.6
SA % 32.6 37 45.4 42.7 40.8 38.6 41.2 49.9 47.7 48.5
2|PageA closer examination of regular participation reveals that women are significantly more likely to
undertake regular physical activity (3x per week or more) than their male counterparts and this disparity
is most significant during middle age (see Figure 3).
Figure 3: Regular Participation in physical activities by age and gender
Regular Particiaption by Age and Gender (2010)
70
65 males
60 females
% of population
55
50
45
40
35
30
15 - 24 25 - 34 35 - 44 45 - 54 55 - 64 65+
Age
Type of Participation
One of the key differentiators of participation is the extent the activity is “organised”. Organised
participation is defined when the activity is organised in full or part by a club, association or other type
of organisation. This is an important distinction as it provides an insight as to where the participation
takes place and the human and physical infrastructure required to facilitate it. And as such has
implications for the type of support required to sustain, grow and/or improve the participation
experience.
Modern lifestyles have resulted in a trend of increasing uptake of non-organised physical activities.
Participation in these activities has grown by more than 7% points across Australia since 2001 (from 63%
to 71%).
Despite this trend of increasing participation in non-organised physical activities, overall participation in
organised activities has remained fairly steady (approximately 40% of the population) for the last 10
years. In 2010, 41% South Australian adults reported participating in organised physical activities (see
Figure 4). Unlike regular activity, males are more likely to undertake physical activities in an organised
environment compared females (45% vs 37% respectively).
Figure 4: Organised vs Non-Organised Participation Trend 2001-2010
Type of Participation
(Organised vs Non-Organised Trend)
80
Population Participation Rate
70.8
70
63.4
60
Non-Organised trend
50
Organised trend 41
40.2
40
30
2001 2002 2003 2004 2005 2006 2007 2008 2009 2010
Aus - Organised 39.9 40.9 42.7 42.7 41.8 39.1 38 40.8 39.1 40
SA - Organised 40.2 39.3 43.5 39.5 42.2 38.8 37.7 40.4 39.8 41
Aus - Non-organised 63.4 62.7 68.1 69.8 69.3 67.1 64.4 72.5 70.7 70.8
SA - Non-organised 62.8 71.9 69.8 71.1
3|PageNumber of Participants
Tracking the participation rate is important from a public health and well-being perspective as it
illustrates the proportion of the population that is physically active and engaged in their communities.
However, for recreation and sport planning it is equally important to track the gross number of
participants to ensure the provision of physical infrastructure and appropriately trained human
resources account for population growth and meet the needs of the community.
Since 2001, the number of South Australian adults (15 y.o.+) that participate in physical activities for
exercise recreation of sport has grown from 890,000 to 1,080,000. This includes an additional 62,000
participants involved in organised activities, taking the total number of organised participants to
538,000. However, it is when we examine the growth in regular participants that we start to appreciate
the strain on the sporting infrastructure. Since 2001 there are an additional 250,000 regular participants
(see Figure 5). If we assume that on average these additional regular participants have only doubled
their previous exercise and activity regime, our infrastructure has to facilitate 375,000 extra
participation occasions per week or almost 20 million extra participation occasions per annum.
Figure 5: Number of Participants 2001-2010
Number of Participants (000's)
Number of Participants in South Australia
1,250
1,000
750
636.3
500
250 386.7
0
2001 2002 2003 2004 2005 2006 2007 2008 2009 2010
All Participants 886 928.3 993.2 970.3 1006.7 985.6 990.9 1052.7 1060 1079.1
Regular Participants 386.7 441.7 546.1 517.2 497.2 476.5 515 631.1 588.5 636.3
Organised Participants 476.3 469.1 523.3 478.7 514.3 481.3 470.3 511.2 507.3 538.3
Popular Activities
In 2010 the most popular activities for adults were walking, aerobics, cycling, swimming and running. Of
these activities walking, cycling and running require little sport specific infrastructure with the majority
being undertaken on footpaths, trails, linear parks and cycle lanes.
The most popular organised sports were aerobics/fitness, netball, Australian rules, tennis, golf, lawn
bowls, cricket and football (soccer). (see Figure 6) The majority of these activities are undertaken on
specific purpose playing fields or courts maintained by sport organisations and local government.
4|PageFigure 6: Top 20 Activities for Adults (2010)
Top 20 Activities by Type of Participation
South Australian ADULTS 2010
Adult Participants ('000) Proportion
Organised
All Adult Organised
Activity Participants Participants
Walking (other) 514.5 22.2 4.3%
Aerobics/fitness 319.3 103.7 32.5%
Cycling 150.4 16.5 10.9%
Swimming 132.9 25.0 18.8%
Running 125.7 22.2 17.7%
Tennis 91.6 45.5 49.7%
Netball 79.6 66.0 82.8%
Golf 69.7 36.8 52.8%
Australian Rules football 68.6 51.1 74.5%
Walking (bush) 60.8 7.9 13.1%
Cricket (outdoor) 54.4 35.2 64.8%
Weight training 46.3 6.1 13.2%
Basketball 46.0 30.9 67.3%
Football (outdoor) 44.3 33.6 75.8%
Yoga 42.4 21.1 49.7%
Lawn bowls 41.5 36.5 88.0%
Martial arts 27.6 23.1 83.7%
Fishing 26.5 1.0 3.8%
Surf sports 25.7 6.0 23.4%
Dancing 21.8 16.1 74.0%
Figure 7: Youth Organised Sport Participation Trend
Youth Participation
According to the ABS (2009) 1, 136,000 youth, (or Youth 5-15y.o. Participation Trend
Population Participation Rate
(Organised Sport or Dancing)
71%) played organised sport outside of school 80
hours. The trend since 2000 of an increasing 75
70.9
participation rate for youth across Australia has 70
been replicated in SA. (see Figure 7). Much of this 65
65.2
“organised” participation is facilitated through
schools or community clubs and associations, and
60
is supported by a significant volunteer effort. In 55
fact, the ABS estimates that 40% of fathers and 50
2000 2003 2006 2009
more than 20% of mothers of 5-14 y.o.’s volunteer Aus % 64.0 66.7 67.9 68.7
for a sport and recreation organisation 2. SA % 65.2 67.3 66.5 70.9
The ABS did some analysis of the characteristics of non-participating youth and found that the country
of birth and employment status of parents were significant indicators that impact on participation.
Youth born overseas in non-english speaking countries (40%), or with parents born overseas in non-
english speaking countries (42%) were significantly less likely to participate in sport than their locally
1
Australian Bureau of Statistics (2009)Children’s participation in Cultural and Leisure Activities. Catalogue No. 4901.0
2
Australian Bureau of Statistics (2009) Voluntary Work, Australia. Catalogue No. 4441.0
5|Pageborn neighbours (72%). The ABS reported that 37% of youth with a single (unemployed) parent and 41%
of youth in a couple family (both unemployed) participated in organised sport.
Figure 8 below illustrates the most popular organised activities for youth in South Australia. Australian
Rules football, swimming and netball all catered for an estimated 30,000 young South Australians.
Figure 8: Top 15 Activities for SA Youth (2009)
Top 15 Organised Activities
South Australian YOUTH 2009
Youth Youth
Participants Participation
Activity ('000) Rate (%)
Bike Riding* 121.1 62.7%
Skateboarding/rollerblading* 89.4 46.3%
Australian Rules football 31.2 16.2%
Swimming 29.9 15.5%
Netball 29.9 15.5%
Basketball 26.6 13.8%
Dancing 24.6 12.8%
Football (outdoor) 17.8 9.2%
Tennis 16.4 8.5%
Cricket 16.2 8.4%
Gymnastics 10.6 5.5%
Martial Arts 6.2 3.2%
Athletics, track and field 3.9 2.0%
Football (indoor) 3.5 1.8%
Hockey 1.6 0.8%
Other organised sports 23.0 11.9%
At least one organised sport 128.0 66.3%
* includes non-organised participation
Sport makes a significant contribution to the physical, psychological and social well being of young
people and is an effective way of producing benefits for both the individual and Australian society.
Furthermore, research investigating the link between youth participation and its impact on adult
physical activity support the conclusion that persistent participation in sport in particular increases the
probability of a higher level of physical activity in later life 3. Thus increasing the quality and accessibility
of youth sport is an important consideration in the overall sport system.
3
Telama R et al, (1997). Physical activity in childhood and adolescence as predictor of physical activity in young
adulthood. American Journal of Preventative Medicine 1997 Jul-Aug; 13(4): 317-23
6|PageRegional Snapshot
Regional communities have a reputation for supporting
local sport and recent research would reinforce that Figure 9 – Key regional stats
4
notion . Regional communities are more likely to Club Player
participate through a club based structure, are more York & Mid North
Murray & Mallee
Limestone Coast
likely to volunteer and more likely to be a spectator than Far North
Eyre & Western
their metro counterparts (see Figure 9). Fleurieu & KI
Barossa
Adelaide Hills
In fact in the regional communities an estimated one Western Adelaide
Southern…
third of adults participated in exercise recreation and Northern…
Eastern Adelaide
sport via their club based infrastructure and almost one
0 10 20 30 40
quarter were involved as a coach, official, umpire or % of Population
administrator. The only exception to the significant
region vs metro difference was in the Murray & Mallee Coach/Official/Admin
York & Mid North
region. Whilst the whole of South Australia was in Murray & Mallee
Limestone Coast
drought, the Murray was in crisis thus the result is not Far North
Eyre & Western
surprising and is perhaps another of the well Fleurieu & KI
Barossa
documented social impacts of the extreme Adelaide Hills
Western Adelaide
environmental event. (Although it should be noted that Southern…
Northern…
Eastern Adelaide
while the Murray and Mallee region had a lowler rate of
club participation and volunteering than other regional 0 5 10 15 20 25 30
% of Population
areas, both estimates were on par with the state
average.)
Spectator
York & Mid North
Murray & Mallee
Limestone Coast
Far North
Eyre & Western
Fleurieu & KI
Barossa
Adelaide Hills
Western Adelaide
Southern…
Northern…
Eastern Adelaide
0 20 40 60 80
% of Population
Fitness Centre
York & Mid North
Murray & Mallee
Limestone Coast
Far North
Eyre & Western
Masters Games Pt Pirie Fleurieu & KI
Barossa
Adelaide Hills
Western Adelaide
Southern…
When we examine participation via fitness, leisure or Northern…
Eastern Adelaide
indoor/outdoor sports centre, higher participation is
observed in metropolitan regions. Many of these 0 5 10 15
% of Population
20 25
facilities are serviced by the commercial sector and
therefore supply is concentrated around areas of high population density, thus this finding is not
suprising.
4
Department of Premier and Cabinet (2009) South Australian Strategic Plan Household Survey (Unpublished data)
7|PageSport Facilities
Local government is a significant provider of community recreation and sport facilities, including sport
specific facilities, as well as recreation and open spaces. Councils work in varying degrees with their
local clubs to offer sustainable, quality opportunities for participation.
However, unlike participation, there is little state or nation-wide collection of information pertaining to
community sport facilities. In 2009/10, the ABS reported on facility usage and in 2010 the Office for
Recreation and Sport asked households across the state to rate satisfaction with the accessibility and
quality of facilities.
The ABS results 5 showed that more than half the population used public infrastructure such as beaches,
walking trails or footpaths to recreate, almost half used a built facilities such as a gym, pool or court and
one quarter used a sports ground or oval (see Figure 10)
Figure 10: Sport Facilities Used in South Australia
The 2010 SA Household survey
Places and Spaces found that metropolitan and
70
regional participants were mostly
% of Population that use facility
60
50
satisfied with the accessibility of
40 sport and recreation facilities 6 (see
30 figure 11). Interestingly, the
20 findings show that South
10 Australians living in the fast
0
Home Sport Facility Built Facility Public Infrastructure Other
growing urban fringe areas
(oval, sports ground) (gym, pool, court) (trail, path, beach)
(Barossa, Adelaide Hills and
Fleurieu) were the least satisfied
with accessibility of facilities. Overall, the majority of South Australian participants (90%+) were satisfied
with the quality of sport and recreation facilities they used. The quality of sport specific facilities such as
ovals, courts, pools and gyms were rated slightly higher for satisfaction than public infrastructure such
as trails, paths, parks and the beach (figure 12). Participants in the Far North were least satisfied with
the quality of sport grounds and Limestone Coast participants were least satisfied with the quality of
built sport facilities. Regional participants who relied on public infrastructure for recreation were in
general less satisfied with the quality when compared to metro participants.
Figure 11: Satisfaction with accessibility of facilities Figure 12: Satisfaction with quality of facilities
Public Infrastructure
Facility Quality Built Facility
Sport facility
York & Mid North
Murray & Mallee
Limestone Coast
Far North
Eyre & Western
Fleurieu & KI
Barossa
Adelaide Hills
Western Adelaide
Southern…
Northern…
Eastern Adelaide
65 70 75 80 85 90 95 100
% of Population "Satisfied"
5
Australian Bureau of Statistics (2009/10 Participation in Sport and Physical Recreation. Catalogue No. 4177.0
6
Department of Premier and Cabinet (2009) South Australian Strategic Plan Household Survey (Unpublished data)
8|PageSport and Recreation Administration
Community sports clubs and associations are non-profit organisations that exist to provide sport and
recreation opportunities for their local communities. Most of these organisations are administered on a
volunteer basis 7. In fact the sport and recreation sector is the biggest beneficiary of volunteer labour,
with one third of all volunteer efforts going to sport, involving 367,000 South Australians who
contribute approximately 48million hours p.a. Typical sport volunteer roles include coaches, officials,
medical/trainer, scorer/time keeper, and administration.
Compared to other sectors, volunteers in the sport and recreation field take on significant
responsibilities when you consider that 72% commit their efforts to an organisation with no paid staff.
The practical implication of this structure is that sport volunteers must assume responsibility for sound
governance including increasing regulations around insurance and risk management, financial
accountability, occupational health and safety and child protection. Most volunteers in other sectors
are supported by a paid workforce who assume these responsibilities on behalf of the volunteers.
Sport and recreation organisations have a hierarchical structure, with National Sport Organisations
providing system leadership to state sport and recreation organisations (SSO’s) who in turn provide
leadership and support for regional associations and community clubs. Most national and state
organisations have professional paid staff and will assume responsibility for sound governance,
participation planning, high performance pathways, education and training activities and facility
planning. However, anecdotal evidence suggests that the services that trickle down to local clubs are
highly variable depending on the focus of the national and state organisation and the capabilities of the
community level volunteers, which in itself varies between sites and over time.
Local clubs are largely responsible for the participation experience of sport participants in particular.
Thus supporting community level volunteers to operate within legislative requirements and to provide
quality participation opportunities is an important consideration in the overall sport system.
The Value of Sport and Recreation
Sport and recreation helps to build communities through social inclusion and a sense of connection,
helps build families through shared experiences and shared achievements and can help address anti-
social behaviour and support education. Sport and recreation is not the cure-all for society’s issues, but
with quality delivery and an appropriate level of support, it can assist in a positive way socially,
economically and environmentally.
7
Australian Bureau of Statistics (2006) Volunteers in Sport. Catalogue No. 4440 .0.55.001
9|PageSport’s contribution to Australia’s GDP is approximately 2% – larger than the motor vehicle industry. It
employs 220,000 people, generates $358 million in annual exports and almost $1 billion in taxation
revenue 8.
For every 10% of the population exercising regularly and moderately, a net benefit of about $800 million
is returned to the economy each year in reduced health care costs – even when allowing for annual
costs of injury resulting from physical activity 9.
Sport and recreation helps sustain the environment through protecting open space and natural areas,
and through the use of active modes of transport.
Research in Western Australia confirms that the benefits derived from sport and recreation are not only
well understood by the community, but the benefits are regarded an extremely important to both
individuals and the community 10 (see Figure 13).
Figure 13: Community Perceptions of Sport and Recreation
% %
Individual Benefit Community Benefit
Agree Agree
Improves physical wellbeing 99% Provides opportunities to meet others 96%
Teaches fair play and respect 94% Creates close friendships 96%
Builds confidence and self esteem 95% Feeling part of the community 92%
Develops self discipline and commitment 94% Builds stronger family relationships 87%
Teaches life-skills such as respect and tolerance for 91% Provides support networks 91%
others
Provides a sense of achievement 97% Builds community pride 89%
Makes you feel better (good) about yourself 95% Creates tolerant communities 83%
Builds communication skills 89% Reduces anti-social behaviour in the community 85%
Develops leadership skills 86% Makes the community safer 81%
Improves ability to cope with stress or difficult 91% Creates new life opportunities such as travel, 84%
situations business contacts, career opportunities
Improves ability to learn 88%
Sport and recreation organisations facilitate community engagement and foster cohesion to such an
extent that membership is one of a suite of indicators used to measure social capital. 11 Similarly,
volunteering is considered an indicator of social capital and thus both receive favourable policy
consideration from governments.
8
Australian Sports Commission (1999) Beyond 2000. p.10
9
Sport and Recreation Victoria (1997) The Business of Sport Melbourne, Victoria.
10
Government of Western Australia (2008) Sport and Recreation, It’s More Than You Think. Viewed on the web at
http://www.dsr.wa.gov.au/assets/files/Research/It's%20More%20than%20you%20think%20single%20page%20for%20web.pdf
11
Australian Bureau of Statistics (2006). Sport and Social Capital. Catalogue No. 4917.0
10 | P a g eYou can also read