Title: Risk to Space Sustainability from Large Constellations of Satellites - Core
←
→
Page content transcription
If your browser does not render page correctly, please read the page content below
Title: Risk to Space Sustainability from Large Constellations of Satellites
Authors: B. Bastida Virgilia*, J.C. Doladob, H.G. Lewisc, J. Radtked, H. Kraga, B. Revelinb, C.
                      Cazauxb, C. Colomboc, R. Crowthere, M. Metzf

Affiliations:
a
    ESA Space Debris Office, ESOC, ESA. Darmstadt, Germany.
b
    CNES. Toulouse, France.
c
    University of Southampton. UK.
d
    TU Braunschweig. Germany.
e
    UK Space Agency. UK.
f
    DLR Space Administration. Bonn, Germany.
*benjamin.bastida.virgili@esa.int. Robert-Bosch-Str. 5, 64293 Darmstadt, Germany.
Abstract: The number of artificial objects in orbit continues to increase and, with it, a key threat
to space sustainability. In response, space agencies have identified a set of mitigation guidelines
aimed at enabling space users to reduce the generation of space debris by, for example, limiting
the orbital lifetime of their spacecraft and launcher stages after the end of their mission. Planned,
large constellations of satellites in low Earth orbit (LEO), though addressing the lack of basic
internet coverage in some world regions, may disrupt the sustainability of the space environment
enabled by these mitigation practices. We analyse the response of the space object population to
the introduction of a large constellation conforming to the post-mission disposal guideline with
differing levels of success and with different disposal orbit options. The results show that a high
success rate of post-mission disposal by constellation satellites is a key driver for space
sustainability.
Keywords: satellites constellations space debris sustainability
1. Introduction
Since the first orbital launch in 1957, the number of artificial objects in Earth orbit has been
increasing [1]. This has led to a corresponding increase in the threat to active satellites from
hypervelocity collisions, putting in jeopardy crucial services that benefit human society. Some
future scenarios produced by computer models suggest that the space debris population has
reached a tipping point [2] such that collisions will increase in frequency even in the absence of
new space traffic [3]. Whilst such an outcome is not certain, there is growing pressure on space
users to implement mitigation measures aimed at preventing the proliferation of space debris and
enabling the sustainable use of space [4].
Mitigation guidelines were outlined following a consensus of the Inter-Agency Space Debris
Coordination Committee (IADC) in 2002 [5]. These guidelines aim to prevent the generation of
debris in the short-term, through measures typically related to spacecraft design and operation,
and the growth of the debris population over the longer-term, by limiting the lifetime in key
orbital regions after the end of mission. A fundamental assumption was that nature and scale of
future space activities would continue to be similar to what was observed during the 1990s.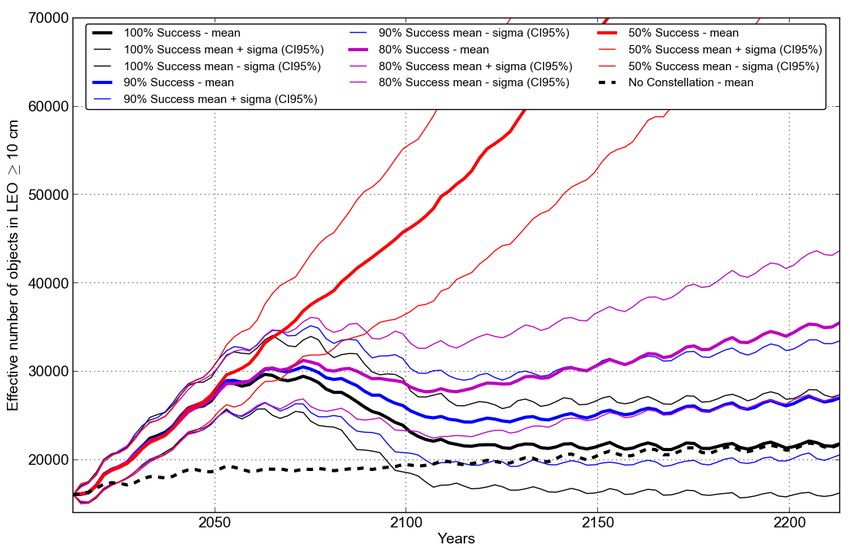
However, the proposed deployment of constellations of satellites in low Earth orbit (LEO) to
provide regular internet access to regions lacking necessary infrastructure [6], and the
enhancement to space traffic beyond what was anticipated by the IADC, represents a potential
source of disruption to the long term sustainability of the space environment. Even the complete
and reliable application of a post-mission disposal guideline might not be sufficient to prevent
the proliferation of debris arising from the use of such large constellations.
     1.1. Constellation description
We analysed the response of the orbital population to the introduction of a large, synthetic
constellation comprising 1080 satellites, each 200 kg with 1 m2 cross-section and a 5-year design
life, distributed in 20 orbital planes at 1100 km altitude and at an inclination of 85°. This
constellation was taken to be indicative, but not an exact representation of proposed
constellations so as to remain valid in view of changing designs and in order to avoid a focus on
a particular constellation proposal. The constellation is operational from 2021 until 2071, with a
build-up from 2018 to 2021 using 20 launches per year and replenishment afterwards using 12
launches per year. Each launch carries 18 satellites, with the launcher performing a de-orbit
manoeuvre after insertion of the satellites at the constellation altitude. The satellites in the
constellation are operational for 5 years, during which time they are able to perform collision
avoidance manoeuvres if required, with a 100% success rate. Afterwards, they perform a
disposal manoeuvre to lower the perigee to an altitude (of around 500 km) where the remaining
orbital lifetime meets the required duration (e.g. 25 years) and are then passivated and de-
activated to avoid explosions, with a 100% success rate. The satellites are considered to be 100%
reliable during their operational phase, but at the end of mission a given percentage fails to
perform the disposal manoeuvre.
    1.2. Background population
For the purposes of the simulations, the background (non-constellation) population consisted of
all objects larger or equal to 10 cm in size, wholly residing in or crossing the LEO region on 1
January 2013, and derived from the MASTER-2009 model [7, 8]. To better understand the effect
of the constellation satellite traffic on the efficacy of the existing debris mitigation guidelines, all
other simulated objects were assumed to have a high post-mission disposal (PMD) success rate.
The non-constellation launch traffic was created from the repetition of launches to LEO from the
historical period 1 January 2005 to 31 December 2012, assuming that no further explosions
occur in orbit and that 90% of new spacecraft and upper stages meet a post-mission disposal
requirement to limit their presence in the LEO region to less than 25 years. The assumptions on
the behaviour of upper-stages and the background are a strict implementation of the mitigation
measures described in the IADC guidelines. The reason for this positive assumption is to isolate
the net environmental effect of the considered constellation and to verify the robustness of
current guidelines with the enhanced traffic. Consequently, the resulting trends will show the
outcome of a widespread implementation of the guidelines, but will be, perhaps, overly
optimistic until technology matures. In contrast, several recent studies [13, 14] have shown that
disposal operations to meet a 25-year post-mission limit in the LEO protected zone is followed
only by approximately 20% of space systems today.
    1.3. Simulation approach and result analysis
A Monte Carlo (MC) approach was used to simulate the evolution of the object population over a
period of 200 years under different post-mission disposal requirements, with four different tools
(MEDEE - Modeling the Evolution of Debris on Earth’s Environment [9], LUCA - Long Term
Utility for Collision Analysis [10], DAMAGE - Debris Analysis and Monitoring Architecture to
the Geosynchronous Environment [11] and DELTA - Debris Environment Long Term Analysis
[12]). For analysis purposes, the effective number of objects was used where the contribution to
the population by each object was weighted by the proportion of the orbital period spent in LEO.

In a first step, four different evolutionary models performed an analysis of two reference
scenarios. One scenario considered only the evolution of the background population and non-
constellation traffic. The second scenario augmented the first with the addition of the
representative constellation, with the requirement that 90% of the constellation satellites
achieved post-mission disposal to orbits with remaining lifetimes of 25 years. The manoeuvres
performed at the mission end to meet the disposal requirement are assumed to be impulsive (i.e.
instantaneous) and result in an eccentric orbit with the apogee near the original (constellation)
altitude and the perigee at an altitude such that the effects of atmospheric drag would cause the
orbit to decay within 25 years. Two of the models considered an apogee remaining at the
operational constellation altitude, while the other two reduced the apogee by 50km. The purpose
of these scenarios is to provide a cross-comparison of the models in terms of their predictions of
the total object population, which take into account the effects of the constellation.
As the distribution of the MC results for the models is of the same nature and the results are
independent, a bootstrapping [20] approach is used to derive the mean, the standard deviation
and the confidence levels at 95% of the combined results of all the MC runs from the four
models (cf. Fig. 1), although not all the models performed the same number of MC runs (see
Tab. 1). The main source of variation inside a particular model’s MC runs included the
randomness in collision activity, while the different models used their own solar activity
forecast.
Table 1. Number of MC runs per scenario performed for each model
 Model              DAMAGE               DELTA               LUCA                 MEDEE
 MC runs            50                   48                  48                   40

2. Results
The analysis was based on a computer simulated evolution of the population of objects in orbit
larger or equal to 10 cm. In Fig. 1, the results for a scenario with the constellation and a case
without are shown. In the constellation scenario, various phases can be distinguished. First, there
is a phase with a steep population increase, which extends from the launch of the first satellites
of the constellation until these satellites start to re-enter due to post-mission disposal manoeuvres
(30 years after their launch in this scenario). Then there is a short phase, from 2051 to 2071, in
which the satellite replacement rate and the re-entry rate are almost the same (differing only
because 10% of the constellation satellites fail to meet the disposal requirement). Third, there is a
phase with a steep population decrease, which starts at the end of the constellation mission and
ends when the last de-orbited satellite re-enters 25 years later. Finally, there is a post-
constellation phase with a gradual population growth that depends only on the behaviour of the
background population and on the effects caused by the constellation satellites that did not meet
the disposal requirement.
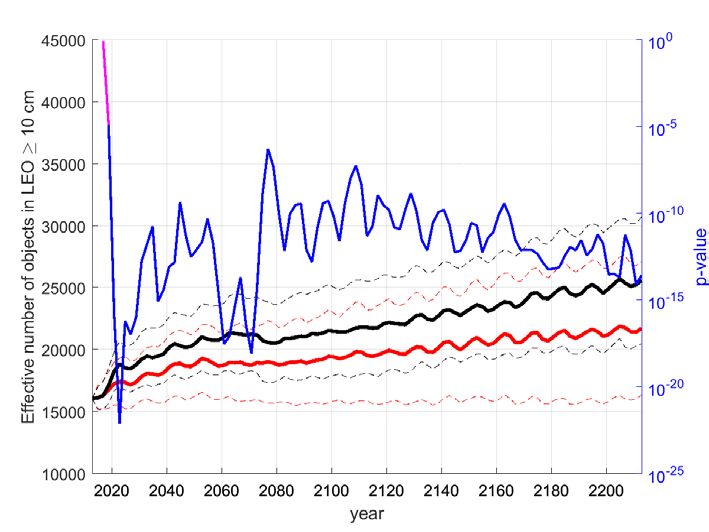
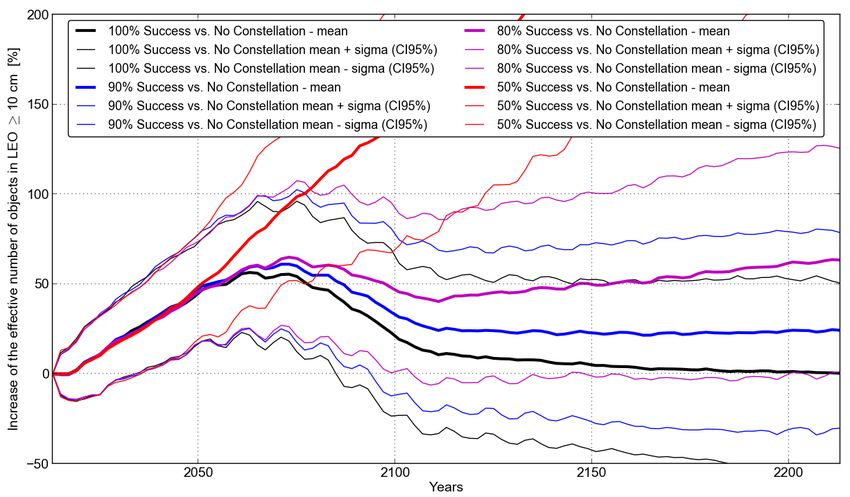
Fig. 1: Comparison of long term evolution of the number of objects in LEO with and
without the constellation. Results are shown for 90% successful implementation of post-
mission disposal guidelines with 25 years orbital lifetime after disposal. Thick lines are the
means of the MC runs and thin lines are the standard deviation around the means with a 95%
confidence interval.
   2.1. Effect of Post-Mission Disposal Rate
Observed PMD success rates in past missions have been below the assumption used for Fig. 1
[13, 14]. To analyse the effect on the distinct phases identified above and arising from different
implementation levels by the constellation satellites of a 25-year PMD requirement, we
compared the trends for PMD implementation levels of 50%, 80%, 90% and 100% (Fig. 2). A
rate of 0% was not considered to be a plausible scenario, given the likely high level of scrutiny
applied by regulators to constellation proposals.
While the steep population increase phase is clearly visible for all scenarios (roughly from 2021
to 2051) in Fig. 2, the long term evolution of the LEO population beyond this phase was greatly
influenced by the extent of successful implementation of the PMD guidelines among the
constellation satellites. The lower the success rate, the higher the number of constellation
satellites that were left in orbit. This accumulation of satellites, and their interaction with the
background population, resulted in a detrimental evolution of the population (e.g. a doubling of
the population by 2071 and a five-fold increase by the end of the projection period for the 50%
PMD implementation level). The collisions were primarily between undisposed constellation
members at the constellation altitude.
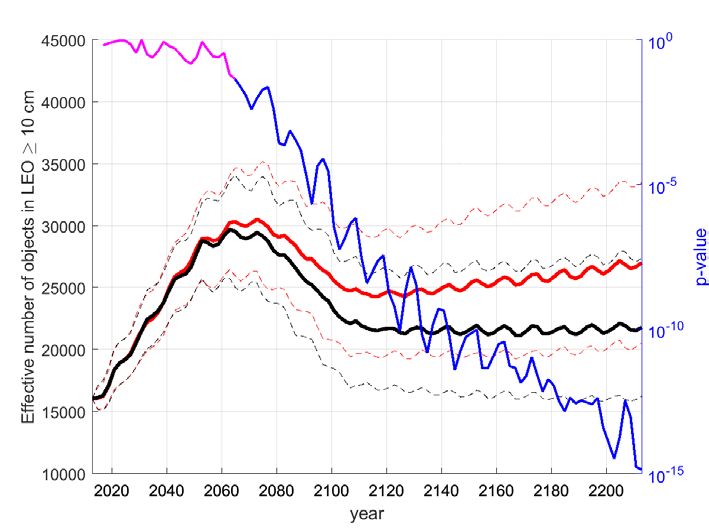
Fig. 2: Effect of constellation post-mission disposal success over the long term. The
evaluation is based on the long term evolution of the LEO population for a range of scenarios
based on a 25-year post-mission lifetime for all constellation satellites. The thick lines are means
of the MC runs and thin lines are the standard deviation around the means with a 95%
confidence interval. The dotted line represents the mean values from the no-constellation
scenario.
Once the operational phase of the constellation ended (i.e. after 2071), the influence of post-
mission disposal on the population remained very clear (Fig. 3). With 100% successful
implementation, the population was brought to levels similar to those observed without the
constellation by the end of the projection period on average. Similarly, the 90% PMD
implementation scenario led to a comparable behaviour with a population growth of 25% by the
end of the projection period. In contrast, the 80% PMD implementation scenario exhibited an
elevated (by 63%) and still-growing population.
Therefore, it can be argued that the successful implementation of post-mission disposal by more
than 90% of the constellation, on average, was expected for an invariant population in the long-
term. Furthermore, if such invariant behaviour was to be guaranteed, a success rate of 100% was
needed.
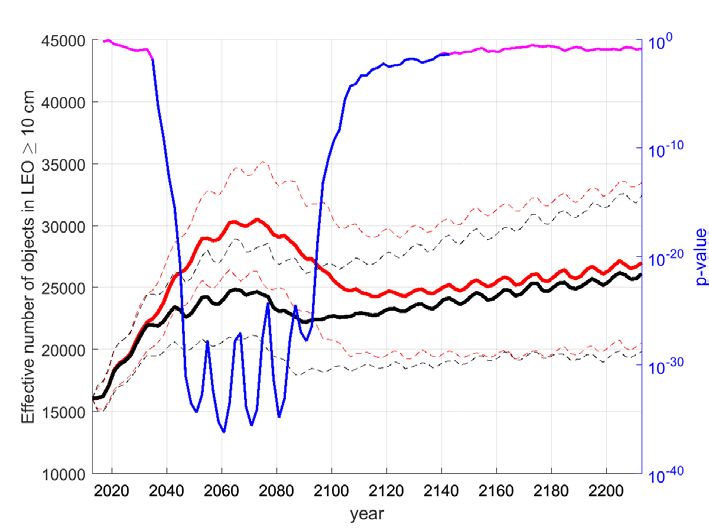
Fig. 3: Increase of the effective number of objects in LEO over the long-term relative to the
no-constellation scenario. The evaluation is based on the long-term increase of the LEO
population for a range of scenarios as a function of the PMD success rate, based on a 25-year
post-mission lifetime for constellation satellites, and compared to a baseline scenario without the
constellation. The thick lines show the difference in the means and the thin lines show the
differences in the standard deviation around the means with a 95% confidence interval.
   2.2. Effect of Post-Mission Disposal Lifetime
Existing space debris mitigation guidelines and standards [5, 15-18] advocate a remaining orbital
lifetime of 25 years or less after the end of the mission as “reasonable and appropriate” (5). This
recommendation, commonly referred to as the “25-year rule”, was adopted as a baseline for the
work presented. However, several of the announced large constellations aim to have shorter post-
mission lifetimes [19], so to understand how these efforts will affect the evolution of the object
population, post-mission lifetime requirements of 0 (direct re-entry), 10 and 25 years were
considered. The successful implementation of these requirements across 90% of the constellation
satellites was assumed.
As can be seen in Fig. 4, the influence of the post-mission lifetime was observed only during the
period from 2023 to 2096: reducing the post-mission lifetime of the constellation satellites from
25 years had a beneficial effect on the environment. Nonetheless, beyond this period the
evolution of the population depended only on the rate at which PMD was successfully
implemented.
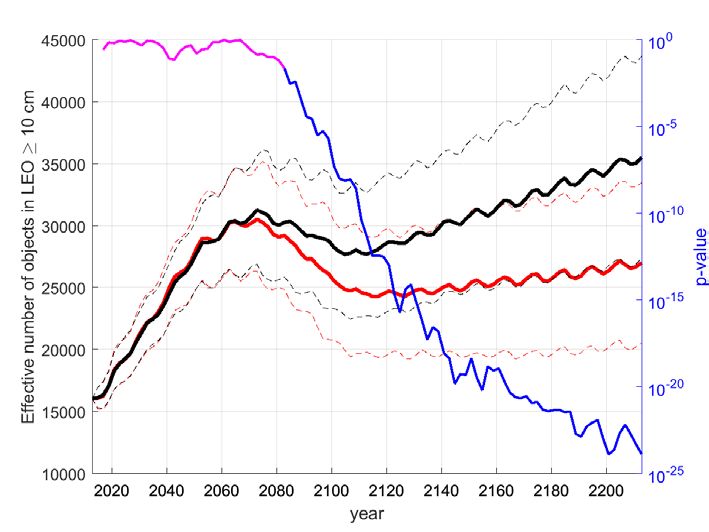
Fig. 4: Effect of residual lifetime after disposal on the long term. The evaluation is based on
the long-term evolution of the LEO population as a function of the post-mission lifetime with a
90% PMD success rate. The thick lines are the means of the MC runs and the thin lines are the
standard deviation around the means with a 95% confidence interval. The dotted line represents
the mean estimated for the no-constellation scenario.
3. Conclusions
The launch of large constellations to LEO to provide telecommunications services is anticipated
to enable ubiquitous access to high-speed internet services. This represents an emerging
opportunity to enable freedom of opinion and expression, and to promote the progress of society,
on a global scale. However, the launch of such constellations will lead to an unprecedented, step
increase in the number of satellites in LEO. As a consequence, those responsible for the
constellations will need to understand the impact that such missions may have on the
sustainability of wider space activities. Such awareness will be needed not only during the
operational phase of their missions but also during the design and testing phases to achieve the
highest reliability for the post-mission disposal operations and the lowest residual lifetime.
While several large constellation projects have announced their willingness to target post-
mission lifetimes far below those advocated within current guidelines (i.e. 25 years), we have
shown that such efforts may still have an effect on the LEO object population, with
consequences that are likely to be dominated by the success, or otherwise, of post-mission
disposal activities within the constellations.
For moderate PMD success rates (i.e. 50%), which are nevertheless higher than today’s levels,
the accumulation of failed constellation satellites may provide a catalyst for a detrimental
population increase. For higher levels, in line with current ambitions (e.g. 90%), the population
may still increase over the long-term (here, by at least one-quarter on average) but such levels
may also be sufficient to prevent further growth. However, the results presented here are likely to
be optimistic, especially if more than one large constellation is deployed into LEO as anticipated.
The greatest challenge will be in delivering the reliability of disposal over the lifetimes of the
satellites and the constellations envisaged. Nevertheless, the post-mission disposal guidelines
appear to be applicable in a general sense to such constellations and represent a valid method for
reducing their impact on the LEO population if implemented satisfactorily.
References
1. Space Debris Program Office, Orbital Debris Quarterly News, Volume 19, Issue 1, page 9,
   January 2015.
2. National Research Council. Ed. Limiting Future Collision Risk to Spacecraft: An Assessment
   of NASA's Meteoroid and Orbital Debris Programs. (Washington, DC: The National
   Academies Press, 2011). doi:10.17226/13244.
3. J.-C. Liou, N. L. Johnson, Risks in Space from Orbiting Debris, Science 20 January 2006,
   Vol. 311 no. 5759 pp. 340 – 341, DOI: 10.1126/science.1121337.
4. R Crowther,: Space Junk--Protecting Space for Future Generations, Science 17 May 2002,
   Vol. 296 no. 5571 pp. 1241-1242, DOI: 10.1126/science.1069725
5. Inter-Agency Space Debris Coordination Committee, IADC Space Debris Mitigation
   Guidelines. IADC-02-01. 2002.
6. United Nations, Broadband Commission for Cultural Development, The state of Broadband
   2015, September 2015.
7. Wiedemann, C., Flegel, S., Kebschull, C., Additional orbital fragmentation events, 65th
   International Astronautical Congress 2014 (IAC 2014), September 29 - October 3, 2014,
   Toronto, Canada, paper IAC-14.A6.P.57.
8. S. Flegel, J. Gelhaus, M. Möckel, et al., Maintenance of the ESA MASTER Model – Final
   Report, European Space Agency, 2011 ESA Contract Number: 21705/08/D/HK.
9. J.C. Dolado-Perez, R. Di-Costanzo, B. Revelin, Introducing MEDEE – A New orbital debris
   evolutionary model, in Proceedings of the Sixth European Conference on Space Debris,
   Darmstadt, Germany, 22–25 April, 2013, European Space Agency Publication (2013).
10. Wiedemann C., Oswald M., Bendisch J., Sdunnus H., Vörsmann P., Cost and Benefit
    Analysis of Space Debris Mitigation Measures, Acta Astronautica, Vol. 55, 2004, pp. 311-
    324.
11. Lewis, H. G., A. Saunders, G. Swinerd, R. J. Newland, Effect of thermospheric contraction
    on remediation of the near-Earth space debris environment, J. Geophys. Res., 116, A00H08,
    doi:10.1029/2011JA016482. (2011).
12. R. Walker, C.E. Martin et al., Analysis of the effectiveness of space debris mitigation
    measures using the DELTA model. Adv. Space Res. Vol. 28, No. 9, pp 1437-1445. 2001.
13. H. Krag, S. Lemmens, T. Flohrer, H. Klinkrad, Global trends in achieving successful end-of-
    life disposal in LEO and GEO, in Proceedings of the Thirteenth International Conference on
    Space Operations, 5–9 May2014, Pasadena, CA.
14. Dolado-Perez, J.C., Morand, V., Le Fevre, C., Handschuh, D.A., Analysis of Mitigation
Guideline Compliance at International Level in Low Earth Orbit, Journal of Space Safety
Engineering, Vol. 1, No. 2, 84 – 92 (2014).
15. International Organization for Standardization 24113 standard, Space Systems – Space debris
mitigation requirements standard (2010).
16. ESA Space Debris Mitigation WG. ESA Space Debris Mitigation Compliance Verification
Guidelines. ESA. 2015.
17. French Space Operation Act, French Republic Official Journal, June 4th 2008.
18. Lazare B., The French Space Operations Act: Technical regulations, Acta Astronautica 92,
(Issue 2), pp. 209 – 212 (2013).
19. Michael Lindsay, OneWeb, 53rd session of the Scientific and Technical Subcommittee of
UNCOPUOS, 2016. http://www.unoosa.org/documents/pdf/copuos/stsc/2016/tech-32E.pdf
20. A.C. Davison, D.V. Hinkley, Bootstrap Methods and their Applications. Cambridge
university press, 1997.
21. S. Siegel, Ed. Nonparametric Statistics for the Behavioral Sciences. (New York: McGraw-
Hill, 1956).Appendix A - Wilcoxon rank sum tests of the scenarios performed
The significance of the differences in the mean results for the single scenarios has been
tested using a Wilcoxon Rank Sum test [21], testing the null-hypothesis at the 5% significance
level. The test was performed for each set of scenarios shown in the paper. The results show that
for all comparisons of the no-constellation scenario against a constellation scenario, the null-
hypothesis is rejected short after the insertion of the constellation (from 2020). Only exception is
the constellation scenario with 100% post mission disposal success, where the means converge
from about the year 2153. For the comparison of scenarios with different disposal success rates,
the results show that the difference is significant in all scenarios in the post-constellation time.
The actual starting point for this lies between the years 2051 and 2083, depending on the cases to
be compared. When comparing the means from the disposal lifetime scenarios, the test shows
that these are significant throughout the beginning of the disposal of constellation objects until a
certain time long after the active constellation time frame, depending on the scenario between
2127 and 2143.
The following figures (Fig. A1–A8) show different Wilcoxon rank sum tests of two
scenarios performed against each other. The red and green lines give the results of the scenarios,
with the standard deviations at 95% confidence intervals as dashed lines. The blue line shows the
p-value of the test, where the magenta line shows that parts where the null-hypothesis cannot be
rejected.
Fig. A1. Baseline scenario without constellation (red lines) vs. constellation scenario where the
constellation disposes to eccentric orbit with 25 year lifetime with 90% success (black lines).
The thick lines are means of the MC runs and the dashed lines are the standard deviation around
the means with a 95% confidence interval.Fig. A2. Baseline scenario without constellation (red lines) vs. constellation scenario where the constellation disposes to eccentric orbit with 25 year lifetime with 100% success (black lines). The thick lines are means of the MC runs and the dashed lines are the standard deviation around the means with a 95% confidence interval. Fig. A3. Constellation scenario where the constellation disposes to eccentric orbit with 25 year lifetime with 100% (black lines) vs. constellation scenario where the constellation disposes to eccentric orbit with 25 year lifetime with 90% success (red lines). The thick lines are means of the MC runs and the dashed lines are the standard deviation around the means with a 95% confidence interval.
Fig. A4. Constellation scenario where the constellation disposes to eccentric orbit with 25 year
lifetime with 80% (black lines) vs. constellation scenario where the constellation disposes to
eccentric orbit with 25 year lifetime with 90% success (red lines). The thick lines are means of
the MC runs and the dashed lines are the standard deviation around the means with a 95%
confidence interval.

Fig. A5. Constellation scenario where the constellation disposes to eccentric orbit with 25 year
lifetime with 80% (black lines) vs. constellation scenario where the constellation disposes to
eccentric orbit with 25 year lifetime with 50% success (red lines). The thick lines are means of
the MC runs and the dashed lines are the standard deviation around the means with a 95%
confidence interval.
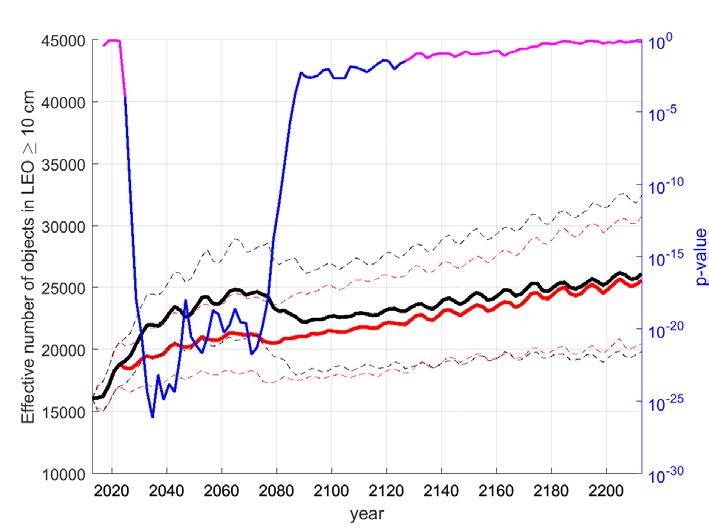
Fig. A6. Baseline scenario without constellation (red lines) vs. constellation scenario where the
constellation performs direct re-entry with 90% success (black lines). The thick lines are means
of the MC runs and the dashed lines are the standard deviation around the means with a 95%
confidence interval.

Fig. A7. Constellation scenario where the constellation performs direct re-entry with 90%
success (red lines) vs. constellation scenario where the constellation disposes to eccentric orbit
with 10 year lifetime with 90% success (black lines). The thick lines are means of the MC runs
and the dashed lines are the standard deviation around the means with a 95% confidence interval.
Fig. A8. Constellation scenario where the constellation disposes to eccentric orbit with 10 year
lifetime with 90% success (black lines) vs. constellation scenario where the constellation
disposes to eccentric orbit with 25 year lifetime with 90% success (red lines). The thick lines are
means of the MC runs and the dashed lines are the standard deviation around the means with a
95% confidence interval.
You can also read