Business development of the Deka Group - as at 31 December 2020 Frankfurt/Main, 30 March 2021
←
→
Page content transcription
If your browser does not render page correctly, please read the page content below

Business development of the Deka Group
as at 31 December 2020
Frankfurt/Main, 30 March 2021
Agenda

The Deka Group at a glance                                                                                                                      3
Business development                                                                                                                            6
Total income and expenses                                                                                                                       7
Total customer assets                                                                                                                           8
Net sales                                                                                                                                       9
Total assets                                                                                                                                   10
Internal capital adequacy                                                                                                                      11
Internal liquidity adequacy                                                                                                                    15
Gross and net loan volume                                                                                                                      16
Financial ratings                                                                                                                              17
Sustainability ratings                                                                                                                         18
Extract from the forecast for 2021 – in the Group Management Report 2020                                                                       19
Appendix                                                                                                                                        A

Presentation “Business development of the Deka Group as at 31 December 2020” published together with the Annual Report 2020 on 30 March 2021
                                                                                                                                                    2
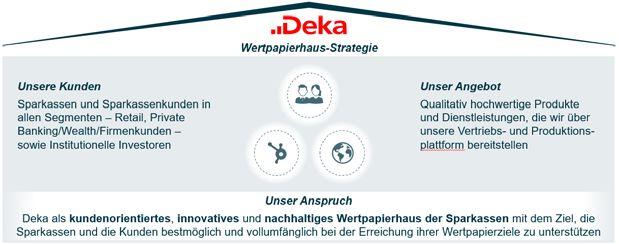
The Deka Group at a glance (1/3)
Deka is the Wertpapierhaus for the savings banks

                                                                                Wertpapierhaus strategy

     Our customers                                                                                                                Our services
     Savings banks and customers of savings                                                                                       High-quality products and services,
     banks in all segments – retail, private                                                                                      which we provide via our sales and
     banking/wealth/corporate customers – and                                                                                     production platform
     institutional investors

                                                                                          Our ambition
   Deka as a customer-focused, innovative and sustainable Wertpapierhaus for savings banks with the aim of providing optimum and
               comprehensive support to savings banks and customers to enable them to achieve their securities objectives

Presentation “Business development of the Deka Group as at 31 December 2020” published together with the Annual Report 2020 on 30 March 2021
                                                                                                                                                                        3
The Deka Group at a glance (2/3)
The five business divisions of the Wertpapierhaus have a clearly
defined range of services
simplified representation
The business divisions of the Wertpapierhaus and their functions
AM Services
Depositary
AM Securities Custody account business
AM Real Estate
Online services for clients
Mutual and special funds Open-ended real estate
who make their own
(shares and bonds) mutual funds
decisions
Multi-asset funds and Open-ended & closed-end
fund-based AM special property funds
Quant. products and ETFs Real estate funds of funds
Alternative investments Credit funds
Capital Markets Financing
Repo/securities lending Financing of savings banks
Trading & Structuring Transport financing
Issues Infrastructure and export financing
AM = Asset Management Commission Business unit Real estate financing
Presentation “Business development of the Deka Group as at 31 December 2020” published together with the Annual Report 2020 on 30 March 2021
4The Deka Group at a glance (3/3)
The asset management and banking business form the basis for the
integrated, customer-centric business model
Savings Banks Sales Institutional Sales
Retail clients Institutional clients
Asset Management (AM) Banking business
AM Securities AM Real Estate AM Services Capital Markets Financing
Corporate Center
Presentation “Business development of the Deka Group as at 31 December 2020” published together with the Annual Report 2020 on 30 March 2021
5Business development
Economic result sharply below previous year’s figure – however,
satisfactory given the circumstances
Economic result (in €m)
448.9 451.8 434.0 At €269.4m, the economic result was
Full year
269.4 down sharply on the previous year’s
figure. This is primarily due to
increased risk provisioning
especially for the transport and real
2017 2018 2019 2020
estate financing sectors, which were
Cost/income ratio and return on equity (before taxes) particularly affected by the
68.8% 69.9% 69.1% 70.2% coronavirus crisis.
Cost/income ratio
Balance sheet based Given the circumstances, however,
return on equity (before tax) profit performance can be
9.9% 9.6% 9.0% 5.5% considered satisfactory.
Total customer assets (in €bn)
282.9 275.9 313.4 339.2
31 Dec 2017 31 Dec 2018 31 Dec 2019 31 Dec 2020
Presentation “Business development of the Deka Group as at 31 December 2020” published together with the Annual Report 2020 on 30 March 2021
6Total income and expenses
Net commission income is the main sustainable income component
Total income (in €m) Total expenses (in €m)
2019 Other 2019
2020 1,561 administrative Bank levy 2020
1,344 1,309 1,388 expenses and deposit
Total Personnel (incl. guarantee Restructuring
expenses expenses depreciation) scheme expenses
58 73 41 20
203 165 198 165
Ʃ €269.4m
(py: €434.0m) 535 535 493 491
-11
-178 -173 -73
Net interest Risk Net Net Other Total 1.127 1.119
income provisions commission financial operating income
lending and income income profit
securities
business
Within the framework of active cost management, expenses were kept
almost stable overall.
Net commission income was only moderately down on the previous year,
mainly due to market-induced provisions for guarantee products. Personnel and other administrative expenses remained almost
unchanged.
Risk provisions increased mainly owing to the transport and real estate
financing sector, which was particularly affected by the coronavirus crisis. The bank levy and the annual contribution to the deposit guarantee
scheme rose compared to the previous year.
Actuarial losses on provisions for pensions had a negative impact on the
other operating profit. Restructuring expenses were incurred in connection with HR
measures and resulted primarily from the strategic cost initiative, which
is focusing on a lasting reduction in personnel and admin. expenses.
Presentation “Business development of the Deka Group as at 31 December 2020” published together with the Annual Report 2020 on 30 March 2021 7Total customer assets
Increase due to a very strong net sales performance
Total customer assets by customer segment (in €bn)
Retail customer
+8%
As a result of a very strong net sales
Institutional customer
313 339 performance the total customer
283 276
167
assets of Deka Group rose by
139 159 €25.7bn to €339.2bn.
137
172
Over the year as a whole, the
144 139 155
investment performance was slightly
31 Dec 2017 31 Dec 2018 31 Dec 2019 31 Dec 2020 positive.
Distributions to investors (€–3.5bn)
Total customer assets by product category (in €m) and maturing certificates (€–3.3bn)
31 Dec 2019 had a mitigating effect.
31 Dec 2020
154,347 161,226 144,695
127,360
22,670 23,712 9,035 9,527
Mutual funds and Special funds Certificates ETFs
fund-based asset and mandates
management
Presentation “Business development of the Deka Group as at 31 December 2020” published together with the Annual Report 2020 on 30 March 2021
8Net sales
Increased to around €32bn in 2020
Net sales by customer segment (in €m)
Retail customer In the retail customer segment net
Institutional customer 32,148 sales increased by €1.5bn
25,671 compared to 2019 to €12.6bn. Fund
12,600
12,309 18,040 sales increased to €8.0bn. In the
11,773 reporting period equity funds
11,117
19,548
13,362 11,296 (€4.7bn) and real estate funds
6,923
477 (€2.5bn) accounted for a significant
2017 2018 2019 2020 share. Sales of certificates
Net sales by product category (in €m) amounted to €4.6bn.
The institutional customer
2019
16,945
segment recorded a strong
2020 increase with net sales of €19.5bn
7,905 8,637 compared to the previous year
6,567 6,743 (€6.9bn). The fund business
4,084
555 accounted for €17.4bn1). Certificates
in the amount of €2.2bn were sold.
-1,248
Mutual funds and Special funds Certificates ETFs
fund-based asset and mandates
management
1) Also favoured by a change in master KVG by a major client.
Presentation “Business development of the Deka Group as at 31 December 2020” published together with the Annual Report 2020 on 30 March 2021
9Total assets
At year-end around €86bn
Total assets (in €bn)
Total assets decreased by 12.1%.
93.8 100.4 97.3 Securities in the banking book were significantly
85.5
reduced as part of active risk management. In the
course of liquidity management, maturing reverse
repo and short-term money market transactions
were not fully replaced.
31 Dec 2017 31 Dec 2018 31 Dec 2019 31 Dec 2020
On the liabilities side, there was a reduction in
refinancing (especially commercial papers).
Assets (in €bn) Liabilities (in €bn)
31 Dec 2020 9.2 17.1
16.4
21.7
24.6
85.5 85.5 7.7
23.0 30.5
1.8 10.6 5.6 2.9
Other assets Financial Financial Due from Due from Cash Total Total
Total Due to banks Due to Securitised Financial Equity Other
investments assets customers banks reserves customers liabilities liabilities liabilities
measured measured
at fair value at fair value
Presentation “Business development of the Deka Group as at 31 December 2020” published together with the Annual Report 2020 on 30 March 2021
10Internal capital adequacy (1/4)
Economic perspective
Change in total risk1) (in €m) and utilisation ratios as at 31 Dec 2020
2,821 Risk capacity utilisation in the
2,492 2,395
2,035 economic perspective was overall
at a non-critical level as at year-
70.5%
53.9% end 2020.
Utilisation of risk appetite (70.5%)
31 Dec 2017 31 Dec 2018 31 Dec 2019 31 Dec 2020 showed an increase compared to
Risk Risk
capacity appetite the end of the previous year
(63.9%). Significantly increased
Total risk1) and internal capital (in €m) market price and business risks
5,236 as well as moderately higher
4,000 operational risk were offset by a
2,821
significant decline in counterparty
541 20 risk.
1,157 279
825 At 53.9%, utilisation of risk
capacity was also slightly than at
Counterparty Market Operational Business Shareholding Total risk Risk Risk year-end 2019 (50.7%).
risk price risk risk risk risk capacity appetite
1) Value-at-Risk (VaR): confidence level of 99.9%, holding period of one year
Presentation “Business development of the Deka Group as at 31 December 2020” published together with the Annual Report 2020 on 30 March 2021 11Internal capital adequacy (2/4)
Normative perspective
Development of regulatory capital and RWA
19.8% 18.4% The decline in credit risk is primarily
Total capital ratio 18.1%
17.0% 15.7% due to the portfolio optimisation
Tier 1 capital ratio 15.7%
Common Equity Tier 1 capital ratio
15.4% 14.2% measures initiated as part of active
14.2%
risk management and the associated
reduction in securities holdings in the
in €m 32,229 31.307 banking book. In market risk, a
29,021
significant decrease in general market
Credit risk 19,147 17,605 risk was offset by a significant
18,744 increase in market risk according to
Market risk
Operational risk the standard approach.
6,348 9,269 9,578
CVA risk
3,365 565 3,243 570 3,485 638 The slight decrease in Common Equity
Tier 1 capital is mainly due to a larger
31 Dec 2018 31 Dec 2019 31 Dec 2020 shortfall of provisions and the
in €m neutralisation of valuation effects from
own issues from the 2019 financial
Own funds 5,741 5,828 5,753
year. This is offset by a positive effect
Tier 1 capital 4,933 5,053 4,911
from the reinvestment of profits from
CET1 capital 4,460 4,579 4,437 the 2019 annual financial statements.
The SREP requirements as at 31 December 2020 for the Common Equity Tier 1
capital ratio were 8.42%, for the Tier 1 capital ratio (phase in) 9.92% and for the Total
capital ratio (phase in) 12.3%. These requirements were clearly exceeded at all times.
Presentation “Business development of the Deka Group as at 31 December 2020” published together with the Annual Report 2020 on 30 March 2021 12Internal capital adequacy (3/4)
Normative perspective
MREL-Ratio (balance sheet-based)1)
As at the reporting date, the MREL
22.0% 25.2%
Own funds and MREL-eligible liabilites (in € bn)
ratio increased by 3,2 percentage
Own funds and Total liabilities -TLOF (in € bn) 89.8 points to 25.2% and was thus
75.9 significantly above the specified
minimum ratio.
19.8 19.2
The subordination ratio (calculated
31 Dec 2019 31 Dec 2020
using the balance sheet-based
approach) as at 31 December 2020
Composition of own funds and MREL-eligible liabilities (in €bn) was 19.2% and was thus significantly
above the minimum ratio to be
19.2
0.1
complied with.
Unsecured subordinated liabilities 3.7
Senior Preferred Emisssions
Senior Non-Preferred Emissions
9.6
Own funds
5.8
31 Dec 2020
1) The balance sheet-based approach comprises the sum of own funds and MREL-eligible liabilities, which are set in relation to the sum of own funds and total liabilities (TLOF).
Presentation “Business development of the Deka Group as at 31 December 2020” published together with the Annual Report 2020 on 30 March 2021 13Internal capital adequacy (4/4)
Normative perspective and cross-perspective statements
Leverage Ratio (fully loaded)
The leverage ratio (fully loaded) was
5.6% 5.6%.
4.7% 4.6% 4.9%
The increase was largely attributable
to a significantly reduced leverage
ratio exposure (€–14,607m; decline in
line with the development of total
assets) to €88,039m, while Tier 1
31 Dec 2017 31 Dec 2018 31 Dec 2019 31 Dec 2020 capital was down by €142m to
€4,911m.
The minimum ratio of 3.0% that must
be adhered to from June 2021
onwards was therefore substantially
Cross-perspective statements regarding the internal capital adequacy
exceeded at all times.
The Deka Group held adequate capital throughout the reporting period.
In particular, the utilisation of risk capacity and risk appetite as well as the Common
Equity Tier 1 capital ratio remained at non-critical levels throughout the entire
reporting period.
Presentation “Business development of the Deka Group as at 31 December 2020” published together with the Annual Report 2020 on 30 March 2021
14Internal liquidity adequacy
Normative perspective and cross-perspective statements
Liquidity Coverage Ratio (LCR)
The liquidity and funding position
185.6% remained comfortable, as expressed
170.6%
152.5% 149.8% in a liquidity coverage ratio (LCR) of
185.6%, has increased by 15
percentage points compared to
previous year.
In percentage terms, the decline in
net cash outflows was greater than
the decline in holdings of high-
31 Dec 2017 31 Dec 2018 31 Dec 2019 31 Dec 2020
quality liquid assets.
The LCR was always substantially
above the minimum of 100%
Cross-perspective statements regarding the internal liquidity adequacy applicable in 2020.
The Deka Group continued to have ample liquidity, measured using the liquidity
balances and LCR, throughout the reporting period.
Even in the severe stress situation on the money and capital markets caused by the
Corona pandemic from March 2020 onwards, there were no breaches of the internal
limits and emergency triggers as well as the external minimum requirements of the
LCR at any time.
Presentation “Business development of the Deka Group as at 31 December 2020” published together with the Annual Report 2020 on 30 March 2021
15Gross and net loan volume
Difference between gross and net loan volume shows extent of
collateralisation
Gross and net loan volume (in €bn)
Gross loan volume Net loan volume The average rating for the gross loan
volume deteriorated by one notch to a
151 142
137
120 rating of 3 according to the DSGV
master scale (corresponds to BBB on
72 65 61
55 the S&P scale).
31 Dec 2017 31 Dec 2018 31 Dec 2019 31 Dec 2020
Gross loan volume by countries and segments (as at 31 Dec 2020)
Other
Savings banks
Other The eurozone accounted for 72.5% of
Germany Property risks 6% the gross loan volume (year-end 2019:
25% 7%
9% 68.0%).
44% Financial institutions
Transport and export finance 4% 47%
France 8% 10%
10% Public sector Germany
7%
Luxembourg 13% 9%
Corporates
UK Funds (transactions and units)
Presentation “Business development of the Deka Group as at 31 December 2020” published together with the Annual Report 2020 on 30 March 2021
16Financial ratings
Good rating assessments remain unchanged
Standard & Poor´s Moody´s
Issuance Ratings
Preferred Senior Unsecured Debt A+ Aa2 (stable)
Senior Unsecured Debt Senior Unsecured Debt
Non-Preferred Senior Unsecured Debt A A1
Senior Subordinated Debt Junior Senior Unsecured Debt
Public Sector & Mortgage Covered Bonds N/A
N/A Aaa
Public Sector Covered Bonds and
Bank Ratings Mortgage Covered Bonds
Issuer Rating A+ (negative) Aa2 (stable)
Issuer Credit Rating Issuer Rating
Counterparty Rating A+ Aa2
Counterparty Credit Rating Counterparty Risk Rating
Deposit Rating N/A Aa2
Bank Deposits
Own financial strength bbb baa2
Stand-alone Credit Profile Baseline Credit Assessment
Short-term Rating A-1 P-1
Short-term Rating Short-term Rating
As at: 30 March 2021
The Issuer has received ratings from the rating agencies Moody’s Deutschland GmbH („Moody’s“), und S&P Global Ratings Europe Limited, Dublin („S&P“). For
current rating reports see: https://www.deka.de/deka-group/investor-relations-en/ratings-1
Presentation “Business development of the Deka Group as at 31 December 2020” published together with the Annual Report 2020 on 30 March 2021 17Sustainability ratings
Ratings confirm sustainability of our corporate governance
As of 2020, Deka
C+ (prime) 17,8 (# 4 / 350)
received an MSCI
„Industry Leader“ „Low Risk“**
ESG Rating of
AA*
2018 2019 2020 2018 2019 2020 2019 2020
AA AA AA C+ C+ C+ 19,1 17,8
Status of sustainability ratings according to the respective rating reports: MSCI: 20 November 2020; ISS-ESG: 22 June 2020; Sustainalytics: 16 September 2020
7
*Copyright ©2020 MSCI, **Copyright ©2020 Sustainalytics. Further Details: https://www.deka.de/deka-gruppe/unsere-verantwortung/wie-wir-nachhaltigkeit-leben/nachhaltigkeitsberichte--ratings
Presentation “Business development of the Deka Group as at 31 December 2020” published together with the Annual Report 2020 on 30 March 2021 18Extract from the forecast for 2021 – in the Group Management
Report 2020
“Following the hit to earnings in 2020 due to the COVID-19 crisis, the Deka Group expects its economic
result in 2021 to return to around €400m – the average figure for the last five years. This will ensure that
DekaBank remains able to distribute profits and to make the reinvestments necessary for the purposes of
“It is still not yet capital management.”
possible to reach a
conclusive estimate
as to the effects of “The Deka Group anticipates a moderate year-on-year rise in total customer assets in 2021.”
the coronavirus
pandemic on the
world economy for “Total net sales are expected to fall significantly short of the previous year’s high level. However, net sales
the year 2021. Thus, to retail customers are expected to be higher than in 2020. In institutional customer business, we expect net
there is still a high sales to be below the previous year’s high figure.”
degree of uncertainty
regarding future “We continue to aim for a Common Equity Tier 1 capital ratio above the strategic target of 13%.”
market
developments.”
“In the risk-bearing capacity analysis, risk appetite utilisation is expected to rise slightly, particularly due to
the planned new business in the Financing business division, but not to a critical level. There is increased
uncertainty about risk development, however, with regard to the future development of the market
environment.”
The Deka Group plans future economic development on the basis of assumptions. See also disclaimer at the end of the presentation.
Presentation “Business development of the Deka Group as at 31 December 2020” published together with the Annual Report 2020 on 30 March 2021 19APPENDIX
Glossary (1/2)
Economic result
As a key management indicator, together with the risk in the economic and normative perspective, the economic result forms the basis for
risk/return management in the Deka Group and is, in principle, determined in accordance with accounting and measurement policies of IFRS.
In addition to the total profit or loss before tax, it also includes:
change in the revaluation reserve before tax,
the interest rate and currency related valuation result from financial instruments recognised at amortised cost, which are not recognised in the
income statement under IFRS but are relevant for assessing financial performance,
the interest expense of the AT1 bond, which is recognised directly in equity, and also
potential future charges that are considered possible in the future but that are not yet permitted to be recognised under IFRS due to the fact that
accurate details are not yet available.
The economic result is therefore a control variable on an accrual basis whose high level of transparency enables recipients of the external financial
reporting to consider the company from the management’s perspective.
Total customer assets
The key management indicator total customer assets mainly includes the income-relevant volume of mutual and special fund products (including
ETFs), direct investments in the funds of cooperation partners, the portion of fund-based asset management activities attributable to cooperation
partner funds, third party funds and liquidity, master funds and advisory/management mandates and certificates.
Net sales
Key management indicator of sales success in asset management and certificate sales. This figure essentially consists of total direct sales of mutual
and special funds, fund-based asset management, funds of cooperation partners, master funds and advisory/management mandates, ETFs and
certificates. Net sales in investment fund business corresponds to gross sales less redemptions and maturities. Sales generated through proprietary
investment activities are not taken into account. Redemptions and maturities are not taken into account for certificates because in the certificates
business the impact on earnings primarily occurs at the time of issue.
Presentation “Business development of the Deka Group as at 31 December 2020” published together with the Annual Report 2020 on 30 March 2021 21Glossary (2/2)
Economic perspective
The economic perspective is one of two approaches on which the internal capital and liquidity adequacy assessment processes (ICAAP and ILAAP)
are based: In the context of the ICAAP, the economic perspective is implemented via the concept of risk-bearing capacity. It serves to secure the
capital of the Deka Group in the long term, thus making a key contribution to ensuring the institution’s survival. The aim is also to protect creditors
against losses from an economic view. In the context of the integrated quantification, management and monitoring of liquidity risk (ILAAP), the key
risk measure in the economic perspective is the “combined stress scenario” funding matrix defined by the Board of Management as being relevant for
management purposes.
Risk-bearing capacity: The aim of the risk-bearing capacity analysis is to ensure the adequacy of capital resources from an economic view.
Sufficient assets must be available to cover risk events, even those which materialise extremely rarely. This involves combining all risk types with a
holding period of one year and a correspondingly high confidence level of 99.9%, which is consistent with DekaBank’s target rating. Subsequently,
the overall risk is compared to the internal capital, which corresponds to the risk capacity.
Normative perspective
The normative perspective is one of two approaches on which the internal capital and liquidity adequacy assessment processes (ICAAP and ILAAP)
are based: in the context of the ICAAP, the normative perspective includes all internal instruments, regulations, controls and processes aimed at
ensuring that regulatory and supervisory capital requirements are met on an ongoing basis, i.e. also prospectively, over the next few years. This
means that it directly pursues the objective of ensuring that the institution can continue as a going concern. In the context of the integrated
quantification, management and monitoring of liquidity risk (ILAAP), the key risk measure in the normative perspective is the LCR in accordance with
the CRR in conjunction with Commission Delegated Regulation (EU) 2015/61.
Gross loan volume
In accordance with the definition set out in section 19 (1)KWG, the gross loan volume includes debt instruments issued by public authorities and bills
of exchange, amounts due from banks and customers, bonds and other fixed-interest securities, shares and other non fixed-interest securities
including fund units, equity investments and shares in affiliated companies, equalisation claims against the public sector, items for which lease
agreements have been concluded as the lessor, irrespective of their recognition in the balance sheet, other assets where they are subject to
counterparty risk, sureties and guarantees, irrevocable lending commitments as well as market values of derivatives. In addition, the gross loan
volume includes underlying risks from derivative transactions, transactions for the purposes of covering guarantee payments on guarantee funds, as
well as the volume of off-balance sheet counterparty risks.
Presentation “Business development of the Deka Group as at 31 December 2020” published together with the Annual Report 2020 on 30 March 2021 22Contact persons
Contact Michael Hahn Sven Jacoby
Head of Reporting & Rating Reporting & Rating
DekaBank Head of External Reporting & Rating
Deutsche Girozentrale +49 (0)69 7147-5169
Reporting & Rating investor.relations@deka.de +49 (0)69 7147-2469
Hahnstraße 55 investor.relations@deka.de
60528 Frankfurt/Main
Claudia Büttner Markus Ottlik
Reporting & Rating Reporting & Rating
External Reporting & Rating External Reporting & Rating
+49 (0)69 7147-1514 +49 (0)69 7147-7492
investor.relations@deka.de investor.relations@deka.de
Silke Spannknebel-Wettlaufer
Reporting & Rating
External Reporting & Rating
+49 (0)69 7147-7786
investor.relations@deka.de
Presentation “Business development of the Deka Group as at 31 December 2020” published together with the Annual Report 2020 on 30 March 2021
23Disclaimer This presentation has been prepared by DekaBank for the purpose of informing the respective stakeholders. The assessments submitted here have been made to the best of our knowledge and belief and come (in part) from sources that are not verifiable by us and are generally accessible. Liability for the completeness, timeliness and accuracy of the information provided to the extent permitted by law, including the legal remarks, is excluded. The information does not constitute an offer, an invitation to subscribe or purchase financial instruments or a recommendation to purchase. The information or documents are not intended to form the basis of any contractual or other obligation. The Deka Group Annual Report and the Interim Financial Report as well as the corresponding presentations contain forward-looking statements as well as expectations and forecasts. These are based on the information available to us at this time, which we have deemed to be reliable after careful consideration. We do not assume an obligation to update based on new information and future events after the publication of this information. We have derived our estimations and conclusions from these forward-looking statements, expectations and forecasts. We expressly point out that all our future-oriented statements are associated with known or unknown risks or imponderables and are based on conclusions relating to future events, which depend on risks, uncertainties and other factors that are outside of our area of influence. Such developments can result from, among other things, a change in the general economic situation, the competitive situation, the development of the capital markets, changes in the tax law and legal framework and from other risks. The events actually occurring in the future may thus turn out to be considerably different from our forward-looking statements, expectations, forecasts and conclusions. We can therefore assume no liability for their correctness and completeness or for the actual occurrence of the information provided. The presentation may not be reproduced in excerpts or as a whole without the written permission of DekaBank or passed on to other persons. The English translation of the Deka Group Annual Report is provided for convenience only. The German original is definitive. Due to rounding, numbers and percentages in this presentation may not add up precisely to the totals provided. Annual figures refer to both key dates and time periods. © 2021 DekaBank Deutsche Girozentrale, Mainzer Landstr. 16, 60325 Frankfurt/Main Disclaimer Presentation “Business development of the Deka Group as at 31 December 2020” published together with the Annual Report 2020 on 30 March 2021 24
You can also read