Business development of the Deka Group - as at 30 June 2020 Frankfurt/Main, 26 August 2020

Page created by Eleanor Ayala
 
CONTINUE READING
Business development of the Deka Group - as at 30 June 2020 Frankfurt/Main, 26 August 2020
Business development of the Deka Group
as at 30 June 2020
Frankfurt/Main, 26 August 2020
Business development of the Deka Group - as at 30 June 2020 Frankfurt/Main, 26 August 2020
Agenda

 The Deka Group at a glance                                                                                                                  3
 Business development                                                                                                                        7
 Total income and expenses                                                                                                                   8
 Total customer assets                                                                                                                       9
 Net sales                                                                                                                                   10
 Total assets                                                                                                                                11
 Internal capital adequacy                                                                                                                   12
 Internal liquidity adequacy                                                                                                                 16
  Gross and net loan volume                                                                                                                  17
  Financial ratings                                                                                                                          18
  Sustainability ratings                                                                                                                     19
  Extract from the forecast in the Interim Report 2020                                                                                       20
  Appendix                                                                                                                                   A

Presentation “Business development of the Deka Group as at 30 June 2020” published together with the Interim Report 2020 on 27 August 2020        2
Business development of the Deka Group - as at 30 June 2020 Frankfurt/Main, 26 August 2020
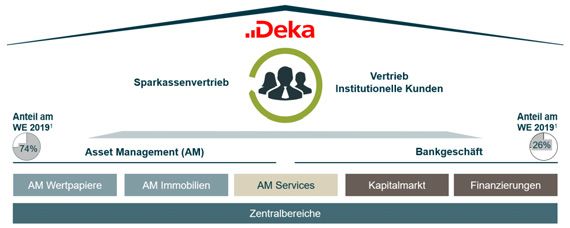
The Deka Group at a glance (1/4)
Wertpapierhaus – the asset management & banking business
divisions form the basis of our integrated business model

                                              Savings Banks Sales                                                             Institutional Sales
                                                      Retail clients                                                           Institutional clients

                             Asset Management (AM)                                                                                           Banking business

         AM Securities                            AM Real Estate                             AM Services                            Capital Markets        Financing

                                                                                         Corporate Center

Presentation “Business development of the Deka Group as at 30 June 2020” published together with the Interim Report 2020 on 26 August 2020                             3
The Deka Group at a glance (2/4)
The five business divisions of the Wertpapierhaus offer a clearly
defined range of services
                                                                                                                                                            simplified representation
The business divisions of the Wertpapierhaus and their functions

                                                                                              AM Services
                                                                                    Depositary
                                AM Securities                                       Custody account business
                                                                                                                                                    AM Real Estate
                                                                                    Online services for clients
                        Mutual and special funds                                                                                              Open-ended mutual
                                                                                     who make their own
                         (shares and bonds)                                                                                                     property funds
                                                                                     decisions
                        Multi-asset funds and                                                                                                 Open-ended & closed-end
                         fund-based AM                                                                                                          special property funds
                        Quant. products and ETFs                                                                                              Funds of property funds
                        Alternative investments                                                                                               Credit funds

                                                            Capital Markets                                                       Financing
                                                      Repo / securities lending                                          Financing of savings banks
                                                      Trading & Structuring                                              Transport financing
                                                      Issues                                                             Infrastructure and export financing
                                                      Commission Business unit                                           Real estate financing
AM = Asset Management

Presentation “Business development of the Deka Group as at 30 June 2020” published together with the Interim Report 2020 on 26 August 2020                                              4
The Deka Group at a glance (3/4)
Our journey to becoming a customer-focused, innovative & sustainable
Wertpapierhaus for the savings banks

                                                2                                                        Management agenda 2025: Our journey to becoming a
                                                                                                         customer-focused, innovative and sustainable Wertpapierhaus
                                     Strong range of                                                     for the savings banks
                                       products &
                                         services

                                                                                                         Five action areas defined to enable achievement of the Agenda
                                                                                                         targets by 2025
       1       Target                                                Growth       3
             customer-                                               through
           oriented sales                                          sustainability

                                                                                                         Creation of benefits and focusing on customers as a key factor
                                                                                                         in successful implementation

             Modern organisation,                       Digitalisation &
              process orientation                       future-proof IT
                 & innovation                            architecture
                                                                                                         Seizing organic and inorganic growth opportunities
                     5                                                     4

Presentation “Business development of the Deka Group as at 30 June 2020” published together with the Interim Report 2020 on 26 August 2020                                5
The Deka Group at a glance (4/4)
Management Agenda 2025 as a further development – Deka as a
customer-focused, innovative and sustainable Wertpapierhaus

                                                                                 Wertpapierhaus strategy

     Our customers                                                                                                                           Our services
     Savings banks and customers of savings
                                                                                                                                             High-quality products and services,
     banks in all segments – retail, private
                                                                                                                                             which we provide via our sales and
     banking/wealth/corporate customers – and
                                                                                                                                             production platform
     institutional investors

                                                                                            Our ambition
   Deka as a customer-focused, innovative and sustainable Wertpapierhaus for savings banks with the aim of providing optimum and
               comprehensive support to savings banks and customers to enable them to achieve their securities objectives

Presentation “Business development of the Deka Group as at 30 June 2020” published together with the Interim Report 2020 on 26 August 2020                                         6
Business development
Economic result down year-on-year owing to the coronavirus crisis

 Economic result (in €m)
                                            448.9                   451.8                    434.0                                            Given the circumstances, business
      Full year
                                                                                                                                               development in the first half of 2020
      Half year
                                                                                                                      162.5                    was satisfactory, though the
                                                                                             223.1                                             economic result of €162.5m was
                                                                                                                                               down on the comparative figure for
                           2017           2018                                               2019                1st half 2020
                                                                                                                                               the previous year (€223.1m).
 Cost/income ratio and return on equity (before taxes)
                                                                                                                                              This was principally due to higher
      Cost/income ratio                 68.8%                    69.9%                   69.1%                    69.4%                        risk provisions, for the transport
      Return on equity (before tax)                                                                                                            sector, which was particularly
                                                                                                                                               affected by the coronavirus crisis,
                                                9.9%                    9.6%                     9.0%                     6.6%                 and an increase in general
                                                                                                                                               provisions.
 Total customer assets (in €bn)

                                            282.9                    275.9                   313.4                    309.8

                                      31 Dec 2017              31 Dec 2018             31 Dec 2019              30 Jun 2020

                                                                                                                                                                                       7
Presentation “Business development of the Deka Group as at 30 June 2020” published together with the Interim Report 2020 on 26 August 2020
Total income and expenses
Net commission income is the main sustainable income component,
accounting for 76% of income
 Total income (in €m)                                                                                        Total expenses (in €m)
      1st half 2019                                                                                                                                                                    1st half 2019
      1st half 2020                                                          771 758                                                                    Operating       Bank levy      1st half 2020
                                                                                                                                                        expenses       and deposit
                                591 577
                                                                                                                       Total            Personnel         (incl.        guarantee    Restructuring
                                                                                                                     expenses           expenses       depreciation)     scheme       expenses
                                                                                                                                                                                        3    22
                                               148 178                                         Ʃ €162,5m                                                                 58 73
   98 97
                                                                                               (py: €223,1m)                                             219 225
                                                                                                                                             269 277
                 -11                                           -54 -24
                       -69
                                                                                                                       548 596
Net interest    Risk       Net    Net                          Other            Total
 income provisions commission financial                      operating        income
             lending and income income                        income
              securities
              business

   Risk provisions increased mainly owing to the transport sector, which was                                  Personnel and operating expenses rose moderately in line with
    particularly affected by the coronavirus crisis.                                                            expectations.
   Net financial income was up significantly on the same period of the previous                               The bank levy and the annual contribution to the deposit guarantee
    year, owing to an increase in net financial income from the trading book. Net                               scheme increased compared with the first half of 2019.
    financial income from the banking book was influenced by positive net                                      Restructuring expenses resulted primarily from the strategic cost
    income from own issues and other own credit quality effects, while valuation                                initiative, which is focusing on a lasting reduction in personnel and
    results on securities in the wake of spread movements had a negative effect.                                operating expenses through initiatives to improve and consolidate
    An amount of €50.0m was added to the general provision for potential risks.                                 operations.

Presentation “Business development of the Deka Group as at 30 June 2020” published together with the Interim Report 2020 on 26 August 2020                                                        8
Total customer assets
Market-induced decline in the first half of 2020

 Total customer assets by customer segment (in €bn)
      Retail customer                                                                                   -1%
                                                                                                                                              Despite the very positive sales
      Institutional customer                                                             313                           310                     performance of over €14bn,
                               283                          276
                                                                                                                                               total customer assets fell by €3.7bn
                               139                                                       159                           155
                                                            137                                                                                compared with year-end 2019
                                                                                                                                               to €309.8bn.
                               144                          139                          155                           155

                        31 Dec 2017                 31 Dec 2018                   31 Dec 2019                   30 Jun 2020                   This was due to a crisis-related
                                                                                                                                               negative investment performance
 Total customer assets by product category (in €m)                                                                                             (€–14.0bn), distributions to
                                                                                                                                               investors (€–1.9bn) and
      31 Dec 2019
      30 Jun 2020 154,347 150,668
                                                                                                                                               maturing certificates (€–2.1bn).
                                                   127,360 128,547

                                                                                  22,670 22,218                   9,035 8,326

                     Mutual funds and                Special funds                  Certificates                      ETFs
                     fund-based asset                and mandates
                       management

Presentation “Business development of the Deka Group as at 30 June 2020” published together with the Interim Report 2020 on 26 August 2020                                            9
Net sales
Significant growth despite the coronavirus crisis

 Net sales by customer segment (in €m)
      Retail customer                                                                                                                         In the retail customer segment net
      Institutional customer                              18,040                                                                               sales increased. Fund sales rose to
                                                                                                                     14,470                    €4.6bn. In particular, equity funds
                            11,773
                                                          11,117                                                                               (€2.5bn), real estate funds (€1.6bn)
                                                                                                                      6,923
                                                                                        6,703                                                  and mixed funds (€0.7bn) accounted
                            11,296
                                                          6,923                         4,434                         7,547                    for a significant share of this.
                                                                                                   2,269
                               477                                                                                                             Certificate sales came to €2.3bn.
                  2018               2019                                         1st half 2019                1st half 2020                  The institutional customer
 Net sales by product category (in €m)                                                                                                         segment also recorded strong
                                                                                                                                               growth. This positive development
      1st half 2019
                                                               5,645                                                                           was chiefly attributable to the
      1st half 2020              4,558                                                                                                         institutional fund business (€6.1bn).
                                                                                     3,565 3,711                                               Sales of certificates came to €1.4bn.
                                                       2,201
                         1,238
                                                                                                                           556

                                                                                                                   -302
                      Mutual funds and               Special funds                   Certificates                     ETFs
                      fund-based asset               and mandates
                        management

Presentation “Business development of the Deka Group as at 30 June 2020” published together with the Interim Report 2020 on 26 August 2020                                             10
Total assets
Around €106bn at mid-year
 Total assets (in €bn)
                                                                                                                                                     Total assets were up by 9%
                                                                 100.4                       97.3                     106.1
                                       93.8                                                                                                           compared with the end of 2019
                                                                                                                                                     On the liabilities side, this was due
                                                                                                                                                      to higher volumes in the repo
                                                                                                                                                      business and increased amounts
                                31 Dec 2017                31 Dec 2018                31 Dec 2019                30 Jun 2020                          due to customers.
                                                                                                                                                     Opposite these, on the assets side,
                                                                                                                                                      were increased balances with
                                                                                                                                                      central banks.
 Assets (in €bn)                                                                                       Liabilities (in €bn)

 30 Jun 2020                                                                 12.6
                                                                                                                            25.9
                                                               24.0
                                                                                                                                             29.4
                                                 28.1                                      106.1            106.1
                                                                                                                                                         10.5
                                  28.5                                                                                                                                   31.9
      1.4           11.5                                                                                                                                                                2.8         5.6
 Other assets     Financial    Financial       Due from     Due form         Cash          Total            Total      Due to banks       Due to      Securitised     Financial        Other       Equity
                investments      assets       customers      banks         reserves                                                     customers      liabilities     liabilities   liabilities
                               measured                                                                                                                               measured
                              at fair value                                                                                                                          at fair value

Presentation “Business development of the Deka Group as at 30 June 2020” published together with the Interim Report 2020 on 26 August 2020                                                                  11
Internal capital adequacy (1/4)
Economic perspective

 Change in total risk1) (in €m) and utilisation ratios as at 30 June 2020

                                                                 3,272                                                                        Risk capacity utilisation in the
                               2,492            2,395                                                                                          economic perspective was overall
            2,035                                                                                                                              at a non-critical level as at mid-
                                                                                                                                 81.8%
                                                                                                                64.2%                          2020.
                                                                                                                                              Utilisation of risk appetite (81.8%)
        31 Dec 2017         31 Dec 2018      31 Dec 2019      30 Jun 2020                                         Risk                         was up significantly compared
                                                                                                                                  Risk
                                                                                                                capacity        appetite       with the end of the previous year
                                                                                                                                               (63.9%), mainly due to the
 Total risk1) and internal capital (in €m)                                                                                                     development of market price,
                                                                                                                5,095                          counterparty and business risk
                                                                                                                                  4,000        given the impact of the
                                                                                              3,272                                            coronavirus crisis.
                                                                 481             49
                                               276                                                                                            At 64.2%, utilisation of risk
      1,499                 967
                                                                                                                                               capacity was also well above
                                                                                                                                               year-end 2019 (50.7%).
Counterparty              Market         Operational         Business        Shareholding   Total risk          Risk              Risk
   risk                  price risk         risk               risk              risk                         capacity          appetite

) Value-at-Risk   (VaR): confidence level of 99.9%, holding period of one year

Presentation “Business development of the Deka Group as at 30 June 2020” published together with the Interim Report 2020 on 26 August 2020                                            12
Internal capital adequacy (2/4)
Normative perspective

 Development of regulatory capital and RWA
                                                    19.8%                             18.1%                                                   The Common Equity Tier 1 capital
      Total capital ratio                                                                                                     16.5%
      Common Equity Tier 1 capital ratio
                                                                                                                                               ratio amounted to 13.0%.
                                               15.4%                                  14.2%                                                   The SREP requirements as at
                                                                                                                              13.0%
                                                                                                                                               30 June 2020 for the Common Equity
 in €m                                                                                                                                         Tier 1 capital ratio (phase in) were
                                                                                                                       34,489
                                                                                     32,229                                                    9.04%. For the total capital ratio
                                                   29,021
      Credit risk                                                                                                                              (phase in) they were 12.54%.
      Market risk                                                                    19,147                            20,153
                                                   18,744                                                                                     Both requirements were clearly
      Operational risk
                                                                                                                                               exceeded at all times.
      CVA risk
                                                    6,348                             9,269                            10,254
                                                                                                                                              Risk-weighted assets rose by 7%.
                                                    3,365     565                     3,243     570                     3,447     635
                                                                                                                                               The increase in market risk was mainly
                                              31 Dec 2018                       31 Dec 2019                       30 Jun 2020                  due to significantly higher general
                                                                                                                                               market risks given increased volatility
 in €m
                                                                                                                                               and spread risk in the coronavirus
                                                                                                                                               crisis. In particular, rating downgrades
Own funds                                          5,741                                5,828                          5,703
                                                                                                                                               linked to the coronavirus crisis led to a
Tier 1 capital                                     4,933                                5,053                          4,954
                                                                                                                                               rise in credit risk.
CET1 capital                                       4,460                                4,579                          4,481

Presentation “Business development of the Deka Group as at 30 June 2020” published together with the Interim Report 2020 on 26 August 2020                                             13
Internal capital adequacy (3/4)
 Normative perspective
 MREL-Ratio (balance sheet based1))
                                                                                                                                                         As at the reporting date, the MREL
                                                                                                                                 19.9%
          Own funds and MREL-eligible liabilites (in € bn)                                                                                                ratio stood at 19.9% (end of 2019:
          Own funds and Total liabilities -TLOF (in € bn)                                                                                  94,8           22.0%), well above the specified
                                                                                                                              18,9
                                                                                                                                                          minimum ratio.
                                                                                                                                                         European banks must hold a
                                                                                                                                                          minimum volume of own funds and
                                                                                                                                                          MREL-eligible liabilities in order to
                                                                                                                             30 Jun 2020
                                                                                                                                                          provide sufficient loss coverage and
                                                                                                                                                          recapitalisation in the event of
                                                                                                                                                          resolution.
 Composition of own funds and MREL-eligible liabilities (in €bn)

          Unsecured subordinated liabilities                                                                                         18,9
                                                                                                                                     3,5          0,1
          Senior Preferred Emisssions
          Senior Non-Preferred Emissions
                                                                                                                                     9,5
          Own funds

                                                                                                                                     5,7

                                                                                                                              30 Jun 2020

1) The   balance sheet based approach calculates the ratio of own funds and MREL-eligible liabilities to own funds and total liabilities (TLOF).

 Presentation “Business development of the Deka Group as at 30 June 2020” published together with the Interim Report 2020 on 26 August 2020                                                       14
Internal capital adequacy (4/4)
Normative perspective and statement on both perspectives
 Leverage Ratio (fully loaded)
                                                                                                                                              The decrease is attributable to a
                                                                                        4.9%                                                   reduction in Tier 1 capital,
                           4.7%                          4.6%                                                         4.5%                     accompanied by an increase in
                                                                                                                                               leverage ratio exposure – in line with
                                                                                                                                               the development of total assets.
                                                                                                                                              The minimum ratio of 3.0% that must
                                                                                                                                               be adhered to from June 2021
                                                                                                                                               onwards was significantly exceeded.
                     31 Dec 2017                   31 Dec 2018                   31 Dec 2019                    30 Jun 2020

 Statement on both perspectives regarding the internal capital adequacy

  The Deka Group held adequate capital throughout the reporting period.

Presentation “Business development of the Deka Group as at 30 June 2020” published together with the Interim Report 2020 on 26 August 2020                                              15
Internal liquidity adequacy
Normative perspective and statement on both perspectives
 Liquidity Coverage Ratio (LCR)

                                                                                                                                              The regulatory requirements for the
                                                                                        170.6%                                                 LCR were fulfilled throughout the
                              152.5%                       149.8%                                                    149.2%
                                                                                                                                               reporting period.
                                                                                                                                              The LCR at Deka Group level was
                                                                                                                                               down compared with 31 December
                                                                                                                                               2019, owing to a greater increase in
                                                                                                                                               percentage terms in cash outflows
                                                                                                                                               compared with holdings of high-
                                                                                                                                               quality, liquid assets.
                         31 Dec 2017                  31 Dec 2018                  31 Dec 2019                  30 Jun 2020
                                                                                                                                              The LCR as at mid-year 2020 stood
                                                                                                                                               at 149.2%. It was thus always
                                                                                                                                               substantially above the minimum
                                                                                                                                               limit of 100% applicable in 2020.
 Statement on both perspectives regarding the internal liquidity adequacy

   The Deka Group had ample liquidity, measured using the liquidity balances and the
    LCR, throughout the first half of 2020.

Presentation “Business development of the Deka Group as at 30 June 2020” published together with the Interim Report 2020 on 26 August 2020                                            16
Gross and net loan volume
Difference between gross and net loan volume shows extent of
collateralisation
 Gross and net loan volume (in €bn)
     Gross loan volume         Net loan volume                                                                                                The average rating for the gross loan
                                                                                                                                               volume deteriorated by one notch to a
                                               151                               142                               143
             137                                                                                                                               rating of 3 on the DSGV master scale
                                                                                                                                               (corresponds to BBB on the S&P
                                                         72                                65                                 76
                       55                                                                                                                      scale).

          31 Dec 2017                       31 Dec 2018                        31 Dec 2019                       30 Jun 2020

 Gross loan volume by countries and segments (as at 30 June 2020)
                                                                                             Other
                    Other                                                                                                                     72.1% of the gross loan volume
                                                                          Savings banks
                            25%                  Germany                                                                                       related to the eurozone (2019: 68.0%).
                                                                                      8% 11%
                                          44%                         Property risks 8%                             Financial institutions
                                                                                                             47%
              France 7%                                                               8%
                      10%                                     Public sector Germany     8%
          Luxembourg             14%                                                      11%
                                                                             Corporates
                                  UK                                                     Funds

Presentation “Business development of the Deka Group as at 30 June 2020” published together with the Interim Report 2020 on 26 August 2020                                          17
Financial ratings
Good ratings remain unchanged
                                                                                 Standard & Poor´s                                             Moody´s
Issuance Ratings
 Preferred Senior Unsecured Debt                                                              A+                                               Aa2 (stable)
                                                                                     Senior Unsecured Debt                                   Senior Unsecured Debt

 Non-Preferred Senior Unsecured Debt                                                           A                                                     A1
                                                                                     Senior Subordinated Debt                                Junior Senior Unsecured Debt

 Public Sector & Mortgage Covered Bonds                                                        N/A
                                                                                              N/A                                                   Aaa
                                                                                                                                             Public Sector Covered Bonds and
Bank Ratings                                                                                                                                 Mortgage Covered Bonds

 Issuer Rating                                                                         A+ (negative)                                            Aa2 (stable)
                                                                                     Issuer Credit Rating                                    Issuer Rating

 Counterparty Rating                                                                           A+                                                   Aa2
                                                                                     Counterparty Credit Rating                              Counterparty Risk Rating

 Deposit Rating                                                                               N/A                                                   Aa2
                                                                                                                                             Bank Deposits

 Own financial strength                                                                       bbb                                                   baa2
                                                                                     Stand-alone Credit Profile                              Baseline Credit Assessment

 Short-term Rating                                                                            A-1                                                    P-1
                                                                                     Short-term Rating                                       Short-term Rating

As at: 25 August 2020

Presentation “Business development of the Deka Group as at 30 June 2020” published together with the Interim Report 2020 on 26 August 2020                                     18
Sustainability ratings
Ratings confirm sustainability of our governance

                                                                                                                               Sustainability Rating:
                                                                                                                               Positive BB
          As of 2019, Deka                                                                                                     Mortgage Covered Bonds:
       received an MSCI ESG                                               C+ (prime)                                           Positive BBB                                                        83 (# 11 / 332)
            Rating of AA*                                             „Industry Leader“                                        Public Sector Covered                                                 „Leader“
                                                                                                                               Bonds: Positive BBB

      2017          2018          2019                             2018           2019          2020                            2018          2019          2020                             2013            2015   2017

       AA             AA            AA                               C+            C+             C+                               B            BB            BB                               66             73     83

* THE USE BY DekaBank Deutsche Girozentrale (“Deka”) OF ANY MSCI ESG RESEARCH LLC OR ITS AFFILIATES (“MSCI”) DATA, AND THE USE OF MSCI LOGOS, TRADEMARKS, SERVICE MARKS OR INDEX NAMES HEREIN, DO NOT CONSTITUTE A
SPONSORSHIP, ENDORSEMENT, RECOMMENDATION, OR PROMOTION OF Deka BY MSCI. MSCI SERVICES AND DATA ARE THE PROPERTY OF MSCI OR ITS INFORMATION PROVIDERS, AND ARE PROVIDED ‘AS-IS’ AND WITHOUT WARRANTY. MSCI NAMES
AND LOGOS ARE TRADEMARKS OR SERVICE MARKS OF MSCI.
Status of sustainability ratings according to the respective rating reports: MSCI: 26 August 2019; ISS-ESG: 22 June 2020; imug rating: 3 Mach 2020 (Sustainability Rating: positive (BB); Mortgage Covered
Bonds: positive (BBB); Public Sector Covered Bonds: positive (BBB)) Sustainalytics: 12 October 2017 (update 2020 in progress)
Presentation “Business development of the Deka Group as at 30 June 2020” published together with the Interim Report 2020 on 26 August 2020                                                                                 19
Extract from the forecast in the Interim Report 2020

                                              “For 2020, the Deka Group anticipates that the economic result will be between 20% and 30% below the
                                               prior-year figure. This prediction takes particular account of higher than planned risk provisions in the
                                               lending and securities business and lower than originally planned commission-based earnings components
    “It is still not yet                       due to market conditions.”
    possible in mid-2020
    to reach a
    conclusive estimate                       “Despite the negative investment performance in the first half of the year, moderate year-on-year growth in
    as to the effects of                       total customer assets is still expected in the fund and certificates business for 2020 as a whole. However,
    the coronavirus                            market conditions mean this will not be as high as originally planned.”
    pandemic on the                           “Total net sales are still expected to exceed the previous year’s level. The forecast for net sales to retail
    world economy. This                        customers remains slightly up on the 2019 figure, which was well into positive territory. A stronger year-on-
    means that a high                          year increase is predicted for institutional customer business.”
    degree of
    uncertainty remains
    about future market                      “We continue to aim for a Common Equity Tier 1 capital ratio above the strategic target of
    developments”                             13%. Due to the effects of the coronavirus crisis, we anticipate that this ratio will be on a level with the
                                              strategic target at the end of 2020, i.e. approximately equal to the ratio at mid-year.”

                                              “In terms of risk-bearing capacity analysis, risk appetite utilisation is expected to remain at a non-critical
                                               level in future. The further development of the market environment will be a major driver of changes in risk in
                                               the second half of the year.”

The Deka Group plans its future economic development on the basis of the assumptions that appear most likely from today’s viewpoint. However, plans and statements about future development in 2020 are subject to
uncertainty.

Presentation “Business development of the Deka Group as at 30 June 2020” published together with the Interim Report 2020 on 26 August 2020                                                                       20
APPENDIX
Glossary 1/2

     Economic result
      As a key management indicator, together with the risk in the economic and normative perspective, the economic result forms the basis for risk/return
        management in the Deka Group and is, in principle, determined in accordance with accounting and measurement policies of IFRS.
        As well as the total of profit or loss before tax, the economic result also includes:
         changes in the revaluation reserve before tax,
         the interest rate and currency related valuation result from financial instruments recognised at amortised cost, which are not recognised in the income
          statement under IFRS but are relevant for assessing financial performance,
         the interest expense in respect of AT1 bonds, which is recognised directly in equity, and also
         potential future charges that are considered possible in the future but that are not yet permitted to be recognised under IFRS due to the fact that
          accurate details are not yet available.
     The economic result is therefore a control variable on an accrual basis whose high level of transparency enables recipients of the external financial reporting
     to consider the company from the management perspective.

   Total customer assets
    The key management indicator total customer assets mainly includes the income-relevant volume of mutual and special fund products (including ETFs),
     direct investments in the funds of cooperation partners, the portion of fund-based asset management activities attributable to cooperation partner funds, third
     party funds and liquidity, master funds and advisory/management mandates and certificates.

   Net sales
    Key management indicator of sales success in asset management and certificate sales. This figure essentially consists of total direct sales of mutual and
     special funds, fund-based asset management, funds of cooperation partners, master funds and advisory/management mandates, ETFs and certificates. Net
     sales in investment fund business corresponds to gross sales less redemptions and maturities. Sales generated through proprietary investment activities are
     not taken into account. Redemptions and maturities are not taken into account for certificates be-cause in the certificates business the impact on earnings
     primarily occurs at the time of issue.

Presentation “Business development of the Deka Group as at 30 June 2020” published together with the Interim Report 2020 on 26 August 2020                             22
Glossary 2/2

     Economic perspective
      The economic perspective is one of two approaches on which the internal capital and liquidity adequacy assessment processes (ICAAP and ILAAP) are
       based: In the context of the ICAAP, the economic perspective is implemented via the concept of risk-bearing capacity. It serves to secure the capital of the
       Deka Group in the long term, thus making a key contribution to ensuring the institution’s survival. The aim is also to protect creditors against losses from
       an economic view. In the context of the integrated quantification, management and monitoring of liquidity risk (ILAAP), the key risk measure in the
       economic perspective is the “combined stress scenario” funding matrix defined by the Board of Management as being relevant for management purposes.
      Risk-bearing capacity: The aim of the risk-bearing capacity analysis is to ensure the adequacy of capital resources from an economic view. Sufficient
       assets must be available to cover risk events, even those which materialise extremely rarely. This involves combining all risk types with a holding period of
       one year and a correspondingly high confidence level of 99.9%, which is consistent with DekaBank’s target rating. The overall risk is then compared
       against the internal capital derived from the balance sheet, taking corresponding deductible items into account.

     Normative perspective
      The normative perspective is one of two approaches on which the internal capital and liquidity adequacy assessment processes (ICAAP and ILAAP) are
       based: in the context of the ICAAP, the normative perspective includes all internal instruments, regulations, controls and processes aimed at ensuring that
       regulatory and supervisory capital requirements are met on an ongoing basis, i.e. also prospectively, over the next few years. This means that it directly
       pursues the objective of ensuring that the institution can continue as a going concern. In the context of the integrated quantification, management and
       monitoring of liquidity risk (ILAAP), the key risk measure in the normative perspective is the LCR in accordance with the CRR in conjunction with
       Commission Delegated Regulation (EU) 2015/61.

   Gross loan volume
    Based on the definition of section 19 (1) of the German Banking Act (Kreditwesengesetz – KWG), gross loan volume includes additional risk exposures such
     as, among other things, underlying risks from derivative transactions and transactions for the purposes of covering guarantee payments on guarantee funds,
     as well as the volume of off-balance sheet counterparty risks.

Presentation “Business development of the Deka Group as at 30 June 2020” published together with the Interim Report 2020 on 26 August 2020                             23
Contact persons

Contact                                                     Michael Hahn                                                        Sven Jacoby
                                                            Head of Reporting & Rating                                          Reporting & Rating
DekaBank                                                                                                                        Head of External Reporting & Rating
Deutsche Girozentrale                                       +49 (0)69 7147-5169
Reporting & Rating                                          investor.relations@deka.de                                          +49 (0)69 7147-2469
Hahnstraße 55                                                                                                                   investor.relations@deka.de
60528 Frankfurt/Main
                                                            Claudia Büttner                                                      Markus Ottlik
                                                            Reporting & Rating                                                   Reporting & Rating
                                                            External Reporting & Rating                                          External Reporting & Rating
                                                            +49 (0)69 7147-1514                                                  +49 (0)69 7147-7492
                                                            investor.relations@deka.de                                           investor.relations@deka.de

                                                            Silke Spannknebel-Wettlaufer
                                                            Reporting & Rating
                                                            External Reporting & Rating
                                                            +49 (0)69 7147-7786
                                                            investor.relations@deka.de

Presentation “Business development of the Deka Group as at 30 June 2020” published together with the Interim Report 2020 on 26 August 2020                            24
Disclaimer

This presentation has been prepared by DekaBank for the purpose of informing the respective stakeholders. The assessments submitted here have been made to
the best of our knowledge and belief and come (in part) from sources that are not verifiable by us and are generally accessible. Liability for the completeness,
timeliness and accuracy of the information provided to the extent permitted by law, including the legal remarks, is excluded. The information does not constitute an
offer, an invitation to subscribe or purchase financial instruments or a recommendation to purchase. The information or documents are not intended to form the
basis of any contractual or other obligation.
The Deka Group Annual Report and the Interim Financial Report as well as the corresponding presentations contain forward-looking statements as well as
expectations and forecasts. These are based on the information available to us at this time, which we have deemed to be reliable after careful consideration. We
do not assume an obligation to update based on new information and future events after the publication of this information. We have derived our estimations and
conclusions from these forward-looking statements, expectations and forecasts. We expressly point out that all our future-oriented statements are associated with
known or unknown risks or imponderables and are based on conclusions relating to future events, which depend on risks, uncertainties and other factors that are
outside of our area of influence. Such developments can result from, among other things, a change in the general economic situation, the competitive situation, the
development of the capital markets, changes in the tax law and legal framework and from other risks. The events actually occurring in the future may thus turn out
to be considerably different from our forward-looking statements, expectations, forecasts and conclusions. We can therefore assume no liability for their correctness
and completeness or for the actual occurrence of the information provided.
The presentation may not be reproduced in excerpts or as a whole without the written permission of DekaBank or passed on to other persons. The English
translation of the Deka Group Annual Report is provided for convenience only. The German original is definitive.
Due to rounding, numbers and percentages in this presentation may not add up precisely to the totals provided.
Annual figures refer to both key dates and time periods.
© 2020 DekaBank Deutsche Girozentrale, Mainzer Landstr. 16, 60325 Frankfurt/Main

Disclaimer

Presentation “Business development of the Deka Group as at 30 June 2020” published together with the Interim Report 2020 on 26 August 2020                         25
You can also read