Business development of the Deka Group - as at 30 June 2021 Frankfurt/Main, 26 August 2021

Page created by Darryl Reyes
 
CONTINUE READING
Business development of the Deka Group - as at 30 June 2021 Frankfurt/Main, 26 August 2021
Business development of the Deka Group
as at 30 June 2021
Frankfurt/Main, 26 August 2021
Business development of the Deka Group - as at 30 June 2021 Frankfurt/Main, 26 August 2021
Agenda

The Deka Group at a glance                                                                                                                    3
Business development                                                                                                                          6
Total income and expenses                                                                                                                     7
Total customer assets                                                                                                                         8
Net sales                                                                                                                                     9
Total assets                                                                                                                                 10
Internal capital adequacy                                                                                                                    11
Internal liquidity adequacy                                                                                                                  15
Gross and net loan volume                                                                                                                    16
Financial ratings                                                                                                                            17
Sustainability ratings                                                                                                                       18
Excerpt from the forecast in the Interim Report 2021                                                                                         19
Appendix                                                                                                                                      A

Presentation “Business development of the Deka Group as at 30 June 2021” published together with the Interim Report 2021 on 26 August 2021
                                                                                                                                                  2
Business development of the Deka Group - as at 30 June 2021 Frankfurt/Main, 26 August 2021
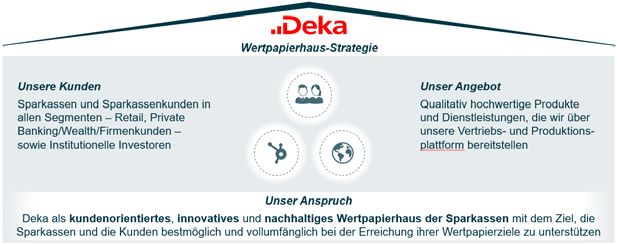
The Deka Group at a glance (1/3)
Deka is the Wertpapierhaus for the savings banks

                                                                                Wertpapierhaus strategy

   Our customers                                                                                                                   Our services
   Savings banks and customers of savings                                                                                          High-quality products and services,
   banks in all segments – retail, private                                                                                         which we provide via our sales and
   banking/wealth/corporate customers – and                                                                                        production platform
   institutional investors

                                                                                          Our ambition
 Deka as a customer-focused, innovative and sustainable Wertpapierhaus for savings banks with the aim of providing optimum and
             comprehensive support to savings banks and customers to enable them to achieve their securities objectives

 Presentation “Business development of the Deka Group as at 30 June 2021” published together with the Interim Report 2021 on 26 August 2021                              3
Business development of the Deka Group - as at 30 June 2021 Frankfurt/Main, 26 August 2021
The Deka Group at a glance (2/3)
The five business divisions of the Wertpapierhaus have a clearly
defined range of services
                                                                                                                                                              simplified representation
 The business divisions of the Wertpapierhaus and their functions

                                                                                         AM Services
                                                                               Depositary
                          AM Securities                                        Custody account business
                                                                                                                                                  AM Real Estate
                                                                               Online services for clients
                  Mutual and special funds                                                                                                   Open-ended real estate
                                                                                who make their own
                   (shares and bonds)                                                                                                          mutual funds
                                                                                decisions
                  Multi-asset funds and                                                                                                      Open-ended & closed-end
                   fund-based AM                                                                                                               special property funds
                  Quant. products and ETFs                                                                                                   Real estate funds of funds
                  Alternative investments                                                                                                    Credit funds

                                                       Capital Markets                                                       Financing
                                                 Repo/securities lending                                            Financing of savings banks
                                                 Trading & Structuring                                              Transport financing
                                                 Issues                                                             Infrastructure and export financing
 AM = Asset Management                           Commission Business unit                                           Real estate financing

Presentation “Business development of the Deka Group as at 30 June 2021” published together with the Interim Report 2021 on 26 August 2021
                                                                                                                                                                                          4
The Deka Group at a glance (3/3)
The asset management and banking business form the basis for the
integrated, customer-centric business model

                                              Savings Banks Sales                                                             Institutional Sales
                                                      Retail clients                                                           Institutional clients

                             Asset Management (AM)                                                                                           Banking business

         AM Securities                            AM Real Estate                             AM Services                            Capital Markets             Financing

                                                                                         Corporate Center

Presentation “Business development of the Deka Group as at 30 June 2021” published together with the Interim Report 2021 on 26 August 2021
                                                                                                                                                                            5
Business development
Economic result more than doubles year-on-year

 Economic result (in €m)
                                            451.8                   434.0                                                                     Given the overall conditions, business
      Full year                                                                                                       342.9                    development and profit performance
      Half year                                                                              269.4
                                                                                                                                               can be considered very satisfactory.
                                                                                             162.5                                            At €342.9m, the economic result
                           2018           2019                                               2020               1st half 2021                  increased significantly compared to
 Cost/income ratio and return on equity (before taxes)                                                                                         the same period of the previous year
                                                                                                                                               (€162.5m).
                                        69.9%                    69.1%                   70.2%                    64.6%
     Cost/income ratio
     Balance sheet based
     return on equity (before tax)
                                                9.6%                    9.0%                                              13.5%
                                                                                                 5.5%

 Total customer assets (in €bn)

                                                                     313.4                   339.2                    368.3
                                            275.9

                                      31 Dec 2018              31 Dec 2019             31 Dec 2020              30 Jun 2021

Presentation “Business development of the Deka Group as at 30 June 2021” published together with the Interim Report 2021 on 26 August 2021
                                                                                                                                                                                        6
Total income and expenses
Net commission income remains the main earnings component,
accounting for 80% of total income
 Total income (in €m)                                                                                        Total expenses (in €m)
      1st half 2020                                                                                                                                        Other
                                                                                                                                                       administrative Bank levy
      1st half 2021                                                                928
                                                                                                                                                         expenses     and deposit
                                      738                                    758                                       Total            Personnel          (incl.      guarantee    Restructuring
                                577                                                                                  expenses           expenses       depreciation)    scheme       expenses
                                                                                                                                                                                           -2
                                               178                                             Ʃ €342.9m                                                                               22
   97 75                                                             72                                                                                                 73 80
                       18                            25                                        (py: €162.5m)
                                                                                                                                                         225 223
                                                                                                                                             277 285
                 -69                                           -24
                                                                                                                                                                                     1st half 2020
Net interest    Risk        Net          Net         Other     Total
                                                                                                                       596 585                                                       1st half 2021
 income provisions commission financial operating income
             lending and income        income        profit
              securities
              business
   Net commission income increased primarily due to higher portfolio-related
                                                                                                              Total expenses were down on the prior-year figure despite a noticeable
     commission.
                                                                                                               increase in the bank levy.
   Positive risk provisioning result in the reporting period; no new specific
                                                                                                              Personnel expenses rose slightly in line with expectations, principally
     provisions set up. Rating improvements and transfers to other stages led to                               due to the acquisition of IQAM Invest GmbH and collectively agreed
     reversals of provisions.
                                                                                                               wage and salary increases.
   Net financial income from the banking book was primarily influenced by
                                                                                                              Other administrative expenses remained virtually unchanged.
     allocations to the general provision for potential risks.
                                                                                                              Within restructuring expenses, there was a net reversal of
   Other operating profit was positively affected by actuarial gains on
                                                                                                               restructuring provisions.
     provisions for pensions.
Presentation “Business development of the Deka Group as at 30 June 2021” published together with the Interim Report 2021 on 26 August 2021                                                           7
Total customer assets
Increase driven by net sales, positive investment performance and the
integration of IQAM Invest GmbH
 Total customer assets by customer segment (in €bn)
      Retail customer                                                                                  +9%                                    Net sales, coupled with positive
      Institutional customer                                                                                           368                     performance and the integration of the
                                                            313                          339
                               276                                                                                                             total customer assets of IQAM Invest
                                                                                         167                           181                     GmbH at the beginning of 2021
                               137                          159
                                                                                                                                               (around €7bn), fuelled an increase in
                                                            155                          172                           187                     total customer assets.
                               139

                        31 Dec 2018                 31 Dec 2019                   31 Dec 2020                   30 Jun 2021

 Total customer assets by product category (in €m)
      31 Dec 2020
      30 Jun 2021                179,850
                     161,226
                                                   144,695 153,178

                                                                                  23,712 24,073                   9,527 11,217
                     Mutual funds and                Special funds                  Certificates                      ETFs
                     fund-based asset                and mandates
                       management

Presentation “Business development of the Deka Group as at 30 June 2021” published together with the Interim Report 2021 on 26 August 2021                                              8
Net sales
Totalled €13.6bn at mid-year

 Net sales by customer segment (in €m)
    Retail customer                                                                                                                           In the retail customer segment, there
    Institutional customer                                32,148                                                                               was a year-on-year increase in net
                                                                                                                                               sales to €11.0bn. Fund sales rose to
                                                          12,600                                                                               €7.7bn. Equity funds, bond funds and
                             18,040
                                                                                       14,470                        13,553                    real estate funds accounted for a
                             11,117                                                     6,923                                                  particularly significant share. Sales of
                                                          19,548                                                     11,050
                             6,923                                                      7,547                                   2,503          certificates totalled €3.4bn.
                             2019                         2020                    1st half 2020                1st half 2021                  The institutional customer segment
                                                                                                                                               recorded net sales of €2.5bn. The
 Net sales by product category (in €m)
                                                                                                                                               lower figure was due to a major master
    1st half 2020
                                                                                                                                               funds client changing investment
    1st half 2021                                                                                                                              management company. As a result, the
                                 7,769
                                                                                                                                               institutional investment fund business
                                                       5,645
                         4,558                                                               4,498                                             accounted for net sales of €1.4bn.
                                                                                     3,711
                                                                                                                                               Certificate sales to institutional
                                                               872                                                 556 414                     customers came to €1.1bn.

                      Mutual funds and               Special funds                   Certificates                     ETFs
                      fund-based asset               and mandates
                        management

Presentation “Business development of the Deka Group as at 30 June 2021” published together with the Interim Report 2021 on 26 August 2021                                                9
Total assets
Approximately €94bn at mid-year
 Total assets (in €bn)
                                                                                                                          Total assets rose by 10.3%, in line with expectations.
             100.4                       97.3                                                 94.3
                                                                    85.5                                                  This was mainly due to the increase in excess short-
                                                                                                                           term liquidity from repo transactions and current
                                                                                                                           account deposits on the liabilities side, which was
                                                                                                                           also a result of the low interest rate environment.
                                                                                                                           These transactions on the liabilities side were
        31 Dec 2018               31 Dec 2019                31 Dec 2020                30 Jun 2021                        also reflected in increased cash reserves on the
                                                                                                                           assets side.

 Assets (in €bn)                                                                                       Liabilities (in €bn)

30 Jun 2021
                                                                             18.7                                           21.6
                                                               14.9
                                                                                                                                             23.1
                                                 29.9                                       94.3            94.3                                       11.1

                                  19.4                                                                                                                                 29.6
      1.5           9.8                                                                                                                                                             5.8        3.0
 Other assets     Financial    Financial       Due from     Due from         Cash          Total            Total
                                                                                                            Total      Due to banks       Due to    Securitised     Financial      Equity     Other
                investments      assets       customers      banks         reserves                                                     customers    liabilities     liabilities            liabilities
                               measured                                                                                                                             measured
                              at fair value                                                                                                                        at fair value

Presentation “Business development of the Deka Group as at 30 June 2021” published together with the Interim Report 2021 on 26 August 2021                                                           10
Internal capital adequacy (1/4)
Economic perspective

     Change in total risk1) (in €m) and utilisation ratios as at 30 Jun 2021

                                                2,821                                                                                         The utilisation ratios in the
              2,492            2,395                                                                                                           economic perspective were at a
                                                                 2,045
                                                                                                                                               non-critical level at the end of June
                                                                                                                                 51.1%         2021.
                                                                                                                36.8%
                                                                                                                                              Utilisation of risk appetite was
           31 Dec 2018      31 Dec 2019      31 Dec 2020      30 Jun 2021                                                                      51.1%, representing a significant
                                                                                                                Risk              Risk
                                                                                                                                               decrease from the 70.5% at the end
                                                                                                              capacity          appetite
                                                                                                                                               of 2020. This was mainly due to
     Total risk1) and internal capital (in €m)                                                                                                 significant reductions in
                                                                                                                5,560
                                                                                                                                               counterparty, market price and
                                                                                                                                               business risk.
                                                                                                                                  4,000
                                                                                                                                              At 36.8%, utilisation of risk capacity
                                                                                              2,045                                            was also significantly below the
                                                                 396              23
          867
                            479                280                                                                                             figure for year-end 2020 (53.9%).

 Counterparty             Market         Operational         Business         Investment   Total risk           Risk              Risk
    risk                 price risk         risk               risk               risk                        capacity          appetite

1)   Value-at-Risk (VaR): confidence level of 99.9%, holding period of one year

Presentation “Business development of the Deka Group as at 30 June 2021” published together with the Interim Report 2021 on 26 August 2021                                          11
Internal capital adequacy (2/4)
Normative perspective
 Development of regulatory capital and RWA
                                                   18.1%                                    18.4%
      Total capital ratio                                                                                                    19.5%            There was a year-on-year fall in risk-
                                                                                            15.7%                            16.8%             weighted assets to €30.7bn.
      Tier 1 capital ratio                  15.7%
      Common Equity Tier 1 capital ratio                                                    14.2%                         15.3%
                                                   14.2%                                                                                      As expected, credit risk was higher
                                                                                                                                               than at the end of 2020 due to the first-
 in €m                                              32,229                                                                                     time application of CRR II. This was
                                                                                      31,307                           30,716
                                                                                                                                               offset by a fall in market risk.
      Credit risk
      Market risk                                   19,147                            17,605                           20,017
                                                                                                                                              The increase in Common Equity Tier 1
      Operational risk                                                                                                                         capital was due primarily to the
      CVA risk                                                                                                                                 inclusion of year-end effects from 2020
                                                     9,269                  3,485     9,578                   3,505     6,678                  (profit retention and inclusion of the
                                          3,243                570                               638                               516
                                                                                                                                               risk provisions set up in 2020 in the
                                               31 Dec 2019                      31 Dec 2020                       30 Jun 2021                  comparison of provisions).
 in €m

  Own funds                                         5,828                              5,753                            5,981
                                                                                                                      5,981
  Tier 1 capital                                    5,053                              4,911                            5,168
                                                                                                                      5,168
  CET1 capital                                      4,579                              4,437                            4,694
                                                                                                                      4,694

   The SREP requirements as at 30 June 2021 for the Common Equity Tier 1 capital ratio
   were 8.44%, for the Tier 1 capital ratio (phase in) 9.94% and for the Total capital ratio
   (phase in) 12.32%. These requirements were clearly exceeded at all times.

Presentation “Business development of the Deka Group as at 30 June 2021” published together with the Interim Report 2021 on 26 August 2021                                              12
Internal capital adequacy (3/4)
Normative perspective
MREL ratios (RWA-based/ LRE-based)1)
         Own funds and MREL-eligible liabilites (in € bn)                                                                                                      Both MREL ratios were well above the
                                                                                                61.6%                          21.0%
         Risk-weighted assets; (in € bn)                                                                                                                        minimum ratios that will apply as of
         Leverage Ratio-Exposure; (in € bn)                                                          30.7                               90.1                    1 January 2022.
                                                                                           18.9                            18.9                                Compared against year-end 2020
                                                                                                                                                                (€19.2bn), there was a slight reduction
                                                                                                                                                                in own funds and MREL-eligible
                                                                                                                                                                liabilities to €18.9bn.
                                                                                         30 Jun 2021                      30 Jun 2021

 Composition of own funds and MREL-eligible liabilities (in €bn)
         Unsecured subordinated liabilities                                                                                     18.9                            As at the reporting date, the
         Senior Preferred Emisssions                                                                                                      0.2                    subordinated MREL requirements1)
                                                                                                                                  4.3
         Senior Non-Preferred Emissions                                                                                                                          under the RWA-based approach were
         Own funds                                                                                                                                               44.8%, while the figure under the
                                                                                                                                  8.5
                                                                                                                                                                 LRE-based approach came to 15.3%.
                                                                                                                                                                Both ratios were well above the
                                                                                                                                  6.0
                                                                                                                                                                 minimum ratios that will apply as of
                                                                                                                         30 Jun 2021                             1 January 2022.

1) The   MREL requirements were changed to an RWA- and LRE-based calculation method in the middle of 2021. The subordinated MREL requirements were also calculated using the RWA- and LRE-based method.

Presentation “Business development of the Deka Group as at 30 June 2021” published together with the Interim Report 2021 on 26 August 2021                                                                13
Internal capital adequacy (4/4)
Normative perspective and cross-perspective statements
 Leverage Ratio (fully loaded)
                                                                                                                                              The leverage ratio (fully loaded) was
                                                                                                                      5.7%                     5.7%.
                                                                                        5.6%
                           4.6%                          4.9%                                                                                 This was substantially above the
                                                                                                                                               minimum leverage ratio of 3.0%
                                                                                                                                               to be adhered to from June 2021
                                                                                                                                               onwards.

                     31 Dec 2018                   31 Dec 2019                   31 Dec 2020                    30 Jun 2021

 Cross-perspective statements regarding the internal capital adequacy

 The Deka Group held adequate capital throughout the reporting period.
 In particular, the Common Equity Tier 1 capital ratio and utilisation of risk capacity and
  of the risk appetite remained at non-critical levels throughout.

Presentation “Business development of the Deka Group as at 30 June 2021” published together with the Interim Report 2021 on 26 August 2021                                             14
Internal liquidity adequacy
Normative perspective and cross-perspective statements
 Liquidity Coverage Ratio (LCR)

                                                          170.6%                       185.6%                                                 The regulatory LCR requirements
                             149.8%                                                                                 149.7%                     were met throughout the first half
                                                                                                                                               2021.
                                                                                                                                              In percentage terms, the increase in
                         31 Dec 2018                 31 Dec 2019                  31 Dec 2020                  30 Jun 2021                     net cash outflows was greater than
                                                                                                                                               that in holdings of high-quality, liquid
 Net Stable Funding Ratio (NSFR)                                                                                                               assets. This resulted in a reduction in
                                                                                                                    118.5%                     the LCR at Deka Group level
                                                                                                                                               compared to 31 December 2020.
                                                                                                                                              The NSFR was substantially above
                                                                                                               30 Jun 2021                     the minimum of 100% applicable
                                                                                                                                               from June 2021.
 Cross-perspective statements regarding the internal liquidity adequacy

 The Deka Group continued to have ample liquidity, measured using the liquidity balances
  and LCR, throughout the first half of 2021.
 The pandemic is no longer having an impact on the liquidity side. The share of refinancing
  via commercial papers remains low compared to the overall refinancing profile.

Presentation “Business development of the Deka Group as at 30 June 2021” published together with the Interim Report 2021 on 26 August 2021                                                15
Gross and net loan volume
Difference between gross and net loan volume shows extent of
collateralisation
 Gross and net loan volume (in €bn)
     Gross loan volume         Net loan volume                                                                                                The average rating for the gross loan
                                                                                                                                               volume deteriorated by one notch to
             151                               142
                                                                                 120                               128                         a rating of 4 on the DSGV master
                                                                                                                                               scale (corresponds to “BBB–” on the
                       72                                65                                61                                 68               S&P scale).

          31 Dec 2018                       31 Dec 2019                        31 Dec 2020                       30 Jun 2021

 Gross loan volume by countries and segments (as at 30 Jun 2021)
                                                                                                     Other
                                                                                    Savings banks
                      Other                                                                                                                   The eurozone accounted for 77.9% of
                                                                                Property risks     5%
                            23%
                                                                                                                                               the gross loan volume (year-end
                                                 Germany Transport and export finance
                                                                                             4% 8% 6%
                                                                                                                                               2020: 72.5%).
               France 7%
                                           50%                      Public sector Germany 8%                    53% Financial institutions
                       11%                                                                    7%
                                                                                  Corporates    9%
            Luxembourg    9%
                              UK                                    Funds (transactions and units)

Presentation “Business development of the Deka Group as at 30 June 2021” published together with the Interim Report 2021 on 26 August 2021                                         16
Financial ratings
Good rating assessments remain unchanged
                                                                                 Standard & Poor´s                                                            Moody´s
Issuance Ratings
  Preferred Senior Unsecured Debt                                                              A                                                              Aa2 (stable)
                                                                                     Senior Unsecured Debt                                                  Senior Unsecured Debt

  Non-Preferred Senior Unsecured Debt                                                          A-                                                                   A1
                                                                                     Senior Subordinated Debt                                               Junior Senior Unsecured Debt

  Public Sector & Mortgage Covered Bonds                                                       N/A
                                                                                              N/A                                                                  Aaa
                                                                                                                                                            Public Sector Covered Bonds and
Bank Ratings                                                                                                                                                Mortgage Covered Bonds

  Issuer Rating                                                                           A (stable)                                                           Aa2 (stable)
                                                                                     Issuer Credit Rating                                                   Issuer Rating

  Counterparty Rating                                                                         N/A                                                                  Aa2
                                                                                                                                                            Counterparty Risk Rating

  Deposit Rating                                                                              N/A                                                                  Aa2
                                                                                                                                                            Bank Deposits

  Own financial strength                                                                      bbb                                                                  baa2
                                                                                     Stand-alone Credit Profile                                             Baseline Credit Assessment

  Short-term Rating                                                                           A-1                                                                   P-1
                                                                                     Short-term Rating                                                      Short-term Rating
As at: 26 August 2021
The Issuer has received ratings from the rating agencies Moody’s Deutschland GmbH („Moody’s“), und S&P Global Ratings Europe Limited, Dublin („S&P“). For
current rating reports see: https://www.deka.de/deka-group/investor-relations-en/ratings-1
Presentation “Business development of the Deka Group as at 30 June 2021” published together with the Interim Report 2021 on 26 August 2021                                                    17
Sustainability ratings
Ratings confirm sustainability of our corporate governance

     As of 2020, Deka                                              C+ (prime)
                                                                                                                             17.4 (# 8 / 376)                                          55/100 (# 13 / 97)
    received an MSCI                                           “Industry Leader”
                                                                                                                              “Low Risk”**                                                “Robust”
    ESG Rating of AA*

  2019         2020         2021                             2018         2019         2020                              2019        2020         2021                              2020         2021

   AA           AA           AA                                C+          C+           C+                               19.1         17.8        17.4                               41               55

Status of sustainability ratings according to the annual rating reports: MSCI: 28.08.2020 (last update: 28.05.2021); ISS-ESG: 22.06.2020; Sustainalytics: 10.08.2021; V.E: 05.2021
*Copyright ©2020 MSCI, **Copyright ©2021 Sustainalytics. Further informationen: https://www.deka.de/deka-group/our-responsibility/how-we-practice-sustainability/sustainability-reports-and-ratings
Presentation “Business development of the Deka Group as at 30 June 2021” published together with the Interim Report 2021 on 26 August 2021                                                                  18
Excerpt from the forecast in the Interim Report 2021

                                              “The updated forecast for the interim report takes the adjusted estimates into account. Based on current
                                               market and business developments, the Deka Group expects to see an economic result at the end of 2021
                                               that could be around 20% to 40% higher than the previous forecast.”
    “The global impacts
    of the coronavirus
    pandemic on the                          “Total customer assets are still forecast to show moderate growth compared to year-end 2020.”
    economy still cannot
    be reliably predicted                     “Total net sales are expected to continue to fall well short of the previous year’s high level. However, net
    at the halfway point                       sales to retail customers are once again expected to be higher than in 2020. In institutional customer
    of 2021. There thus                        business, we expect net sales to be below the previous year’s high figure.”
    remains a level of
    uncertainty regarding
    future market                            “The Deka Group continues to aim for a Common Equity Tier 1 capital ratio above the strategic
    developments.”                            target of 13%.”

                                             “In terms of risk-bearing capacity analysis, risk appetite utilisation is expected to remain at a non-critical
                                              level. As far as risk development is concerned, however, elevated uncertainty regarding the further
                                              development of the market environment cannot be ruled out.”

The Deka Group plans future economic development on the basis of assumptions. See also disclaimer at the end of the presentation.

Presentation “Business development of the Deka Group as at 30 June 2021” published together with the Interim Report 2021 on 26 August 2021                     19
APPENDIX
Glossary (1/2)
   Economic result
    As a key management indicator, together with the risk in the economic and normative perspective, the economic result forms the basis for
     risk/return management in the Deka Group and is, in principle, determined in accordance with accounting and measurement policies of IFRS.
     In addition to the total profit or loss before tax, it also includes:
      change in the revaluation reserve before tax,
      the interest rate and currency related valuation result from financial instruments recognised at amortised cost, which are not recognised in the
        income statement under IFRS but are relevant for assessing financial performance,
      the interest expense of the AT1 bond, which is recognised directly in equity, and also
      potential future charges that are considered possible in the future but that are not yet permitted to be recognised under IFRS due to the fact that
        accurate details are not yet available.
   The economic result is therefore a control variable on an accrual basis whose high level of transparency enables recipients of the external financial
   reporting to consider the company from the management’s perspective.

 Total customer assets
  The key management indicator total customer assets mainly includes the income-relevant volume of mutual and special fund products (including
   ETFs), direct investments in the funds of cooperation partners, the portion of fund-based asset management activities attributable to cooperation
   partner funds, third party funds and liquidity, master funds and advisory/management mandates and certificates.

 Net sales
  Key management indicator of sales success in asset management and certificate sales. This figure essentially consists of total direct sales of mutual
   and special funds, fund-based asset management, funds of cooperation partners, master funds and advisory/management mandates, ETFs and
   certificates. Net sales in investment fund business corresponds to gross sales less redemptions and maturities. Sales generated through proprietary
   investment activities are not taken into account. Redemptions and maturities are not taken into account for certificates because in the certificates
   business the impact on earnings primarily occurs at the time of issue.

 Presentation “Business development of the Deka Group as at 30 June 2021” published together with the Interim Report 2021 on 26 August 2021                  21
Glossary (2/2)
 Economic perspective
  The economic perspective is one of two approaches on which the internal capital and liquidity adequacy assessment processes (ICAAP and ILAAP)
   are based: In the context of the ICAAP, the economic perspective is implemented via the concept of risk-bearing capacity. It serves to secure the
   capital of the Deka Group in the long term, thus making a key contribution to ensuring the institution’s survival. The aim is also to protect creditors
   against losses from an economic view. In the context of the integrated quantification, management and monitoring of liquidity risk (ILAAP), the key
   risk measure in the economic perspective is the “combined stress scenario” funding matrix defined by the Board of Management as being relevant for
   management purposes.
  Risk-bearing capacity: The aim of the risk-bearing capacity analysis is to ensure the adequacy of capital resources from an economic view.
   Sufficient assets must be available to cover risk events, even those which materialise extremely rarely. This involves combining all risk types with a
   holding period of one year and a correspondingly high confidence level of 99.9%, which is consistent with DekaBank’s target rating. Subsequently,
   the overall risk is compared to the internal capital, which corresponds to the risk capacity.

  Normative perspective
   The normative perspective is one of two approaches on which the internal capital and liquidity adequacy assessment processes (ICAAP and ILAAP)
    are based: in the context of the ICAAP, the normative perspective includes all internal instruments, regulations, controls and processes aimed at
    ensuring that regulatory and supervisory capital requirements are met on an ongoing basis, i.e. also prospectively, over the next few years. This
    means that it directly pursues the objective of ensuring that the institution can continue as a going concern. In the context of the integrated
    quantification, management and monitoring of liquidity risk (ILAAP), the key risk measure in the normative perspective is the LCR in accordance with
    the CRR in conjunction with Commission Delegated Regulation (EU) 2015/61 as well as 2018/1620 and the NSFR in accordance with the
    requirements of the CRR.

  Gross loan volume
   In accordance with the definition set out in section 19 (1)KWG, the gross loan volume includes debt instruments issued by public authorities and bills
    of exchange, amounts due from banks and customers, bonds and other fixed-interest securities, shares and other non fixed-interest securities
    including fund units, equity investments and shares in affiliated companies, equalisation claims against the public sector, items for which lease
    agreements have been concluded as the lessor, irrespective of their recognition in the balance sheet, other assets where they are subject to
    counterparty risk, sureties and guarantees, irrevocable lending commitments as well as market values of derivatives. In addition, the gross loan
    volume includes underlying risks from derivative transactions, transactions for the purposes of covering guarantee payments on guarantee funds, as
    well as the volume of off-balance sheet counterparty risks.

 Presentation “Business development of the Deka Group as at 30 June 2021” published together with the Interim Report 2021 on 26 August 2021                  22
Contact persons

Contact                                                   Michael Hahn                                                        Sven Jacoby
                                                          Head of Finance                                                     Reporting & Rating
DekaBank                                                                                                                      Head of External Reporting & Rating
Deutsche Girozentrale                                     +49 (0)69 7147-5169
Reporting & Rating                                        investor.relations@deka.de                                          +49 (0)69 7147-2469
Hahnstraße 55                                                                                                                 investor.relations@deka.de
60528 Frankfurt/Main
                                                          Claudia Büttner                                                      Markus Ottlik
                                                          Reporting & Rating                                                   Reporting & Rating
                                                          External Reporting & Rating                                          External Reporting & Rating
                                                          +49 (0)69 7147-1514                                                  +49 (0)69 7147-7492
                                                          investor.relations@deka.de                                           investor.relations@deka.de

                                                          Silke Spannknebel-Wettlaufer
                                                          Reporting & Rating
                                                          External Reporting & Rating
                                                          +49 (0)69 7147-7786
                                                          investor.relations@deka.de

 Presentation “Business development of the Deka Group as at 30 June 2021” published together with the Interim Report 2021 on 26 August 2021                         23
Disclaimer

This presentation has been prepared by DekaBank for the purpose of informing the respective stakeholders. The assessments submitted here have been made to
the best of our knowledge and belief and come (in part) from sources that are not verifiable by us and are generally accessible. Liability for the completeness,
timeliness and accuracy of the information provided to the extent permitted by law, including the legal remarks, is excluded. The information does not constitute an
offer, an invitation to subscribe or purchase financial instruments or a recommendation to purchase. The information or documents are not intended to form the
basis of any contractual or other obligation.
The Deka Group Annual Report and the Interim Financial Report as well as the corresponding presentations contain forward-looking statements as well as
expectations and forecasts. These are based on the information available to us at this time, which we have deemed to be reliable after careful consideration. We
do not assume an obligation to update based on new information and future events after the publication of this information. We have derived our estimations and
conclusions from these forward-looking statements, expectations and forecasts. We expressly point out that all our future-oriented statements are associated with
known or unknown risks or imponderables and are based on conclusions relating to future events, which depend on risks, uncertainties and other factors that are
outside of our area of influence. Such developments can result from, among other things, a change in the general economic situation, the competitive situation, the
development of the capital markets, changes in the tax law and legal framework and from other risks. The events actually occurring in the future may thus turn out
to be considerably different from our forward-looking statements, expectations, forecasts and conclusions. We can therefore assume no liability for their correctness
and completeness or for the actual occurrence of the information provided.
The presentation may not be reproduced in excerpts or as a whole without the written permission of DekaBank or passed on to other persons. The English
translation of the Deka Group Annual Report and the Interim Financial Report is provided for convenience only. The German original is definitive.
Due to rounding, numbers and percentages in this presentation may not add up precisely to the totals provided.
Annual figures refer to both key dates and time periods.
© 2021 DekaBank Deutsche Girozentrale, Mainzer Landstr. 16, 60325 Frankfurt/Main

Disclaimer

Presentation “Business development of the Deka Group as at 30 June 2021” published together with the Interim Report 2021 on 26 August 2021
                                                                                                                                                                   24
You can also read