New Zealand Asian Wellbeing & Mental Health Report 2021
←
→
Page content transcription
If your browser does not render page correctly, please read the page content below
New Zealand Asian
                                                       Wellbeing & Mental Health Report 2021
                                                                                               - A snapshot survey

                                                                                                                           June 2021

                                                                                  Confidential - Do not duplicate or distribute in any form of
                                                                                           communication without written permission from
                                                                                                  Asian Family Services & Trace Research Ltd

                                                                                Dr Andrew Zhu | Director of Trace Research
Copyright © 2011- 2021 Trace Research Ltd. All Rights Reserved.
44.4% The stigma towards people Top 6 Help Seeking Barriers
86.5% of Asians are of Asians showed with mental illnesses in New Lack of awareness of
Zealand is a major cause for 49.0%
satisfied with their life in symptoms of depression,
mental disorders
New Zealand especially amongst concern - 98.7%of Asians Limited knowledge of
available services 48.3%
(mean score 7.5 out of 10) believe the public hold
younger Asians, 61.3% negative stereotypes against
Lack of language support
48.3%
or cultural support when…
(self-reported results according to Centre for
Epidemiological Studies Depression Scale) people with mental illnesses
84.8% of Asians felt the
Privacy 43.5%
things they do in their life Limited knowledge about
42.5%
New Zealand Asian
2021
mental health services…
are worthwhile The stigma associated
(mean score 7.5 out of 10) 42.2%
Wellbeing & Mental Health with mental disorders
Ranking of Life Satisfaction by
Survey 47.9%
Ethnicity (population distribution >3%) of Asians cannot access
Top 5 Concerns due to COVID-19 Top 5 Expressions of Public Stigma language and/or cultural
Filipino 8.0
Surrounding Mental Illnesses support regularly when they
Cannot return to home
50.2% Being withdrawn, use health services in New
country for reunion 43.6%
isolated, lonely Zealand
Indian 7.9 Recession
High risk of suicide Needs for Language & Cultural Support
43.6% and self-harm 40.7%
tendencies Cultural and social support 49.2%
Korean 7.8 Being insecure/
Free interpreting services 39.7%
Racial discrimination 40.3% 40.6%
lacking confidence Culturally appropriate clinical
services 39.5%
Chinese 7.1 Health system being
38.9%
Being not
Culturally appropriate
psychological intervention… 35.7%
overloaded 37.8%
normal/unusual
Translated health resources 32.5%
Average 7.5/10 Increased mental
38.8% Being vulnerable/weak
Ongoing updates on health-
related articles via ethnic… 24.7%
All Asians stress 36.8%
None 8.7%
Sample Size = 663 Asians in New Zealand ( +/-3.8%)
Copyright © 2021 AFS & Trace Research Ltd. All rights reserved.
Executive Summary

Key Findings
Asian Wellbeing
    Overall, Asians tend to be satisfied with their life in New Zealand as a whole (86.5%);
             Across different ethnicities, Filipinos report the highest level of life satisfaction whilst Chinese report the lowest level of life satisfaction (although still reaching 80.2%);
             Males are slightly more satisfied with their life in NZ as a whole, compared to Females. And those who are older (50+ years) are more satisfied than those who are younger (under 50 years of age);
             Across regions, Asians living in Christchurch have the highest level of life satisfaction in New Zealand (92.3%). The lowest level of life satisfaction lies with the Rest of the North Island (73.0%);
    84.8% of Asians feel the things they do in their life are worthwhile in New Zealand;
             Filipinos report the highest level of life worthwhileness in New Zealand (91.1%), and the lowest is reported by Koreans (although levels still reach 79.9%);
             Females report slightly higher levels of life worthwhileness in New Zealand compared to Males;
             Across age, those 65+ report the highest level of life worthwhileness (96.1%). In contrast, those under 30 years report the lowest level of life worthwhileness;
             Across the different regions, those living in Christchurch report the highest level of life worthwhileness (92.4%), closely following by those living in Wellington (90.4%);
             In terms of the Total Asian Wellbeing Index, those who score higher than total levels tend to be Indian, Filipino, 65+ years, and those living in Wellington and Christchurch. In contrast, those who score
             lower than total levels tend to be Chinese, under 30 years, and those living in Hamilton and the Rest of the North Island;
Asian Mental Health
    The top 3 symptoms of depression experienced by Asians ‘all of the time’ were feeling lonely (11.5%), feeling everything that they did was an effort (11.0%), and that their sleep was restless
    (8.8%), however levels all sit relatively low;
    In total, 44.4% of Asians are at risk of depression, Koreans are the most likely group to be at risk of depression, followed by Indians and Filipinos;
             Females are only slightly more at risk of depression compared to Males;
             Across age, those who are younger (under 30 years) have the highest risk of depression (61.3%) whilst those who are older (65+ years) have the lowest risk of depression (23.4%);
             Across region, those living in Christchurch have the highest risk of depression (59.0%) followed by those living in Hamilton (57.0%), and the Rest of the North Island (50.7%);
    On average, Asians tend to worry about 4-5 issues as a result of Covid-19. The top 5 worries are (1) not being able to return to their home country for a reunion, (2) a recession, (3) racial
    discrimination, (4) the health system being overloaded, and (5) increased mental stress;
             On average, Chinese, those aged 65+, and those living in Hamilton worry the most as a result of Covid-19, and Females worry more than Males.

                                                                                                                                                                                                                           3
Executive Summary

Key Findings
Asian Mental Health Stigma
    98.7% of Asians believe the public hold negative stereotypes against people with mental illnesses. On average, there are 4-5 expressions of public stigma surrounding mental illnesses. The top
    5 are (1) being withdrawn, isolated, lonely, (2) high risk of suicide and self-harm tendencies, (3) being insecure/lacking confidence, (4) being not normal/unusual, and (5) being
    vulnerable/weak;
             Across ethnicity, on average, Indians have the highest expressions of public stigma surrounding mental illness, in particular, they are more likely to report expressions of public stigma around being
             insecure/lacking confidence, being not normal/unusual, and being hopeless/useless;
             Across gender, on average, Females have slightly more expressions of public stigma surrounding mental illnesses compared to Males. In particular, Females are more likely to report expressions of
             public stigma around high risk of suicide and self-harm tendencies, being hopeless/useless, being less worthy than normal people, and from a dysfunctional family;
             Across age, on average, those aged 65+ express the most public stigma surrounding mental illnesses;
             Across region, on average, those living in Wellington and the Rest of the South Island express the most public stigma surrounding mental illnesses;
Asian Mental Health Support
    On average, Asians perceive 4-5 barriers for seeking mental health support in the Asian community. The top 5 are (1) lack of awareness of mental disorders, (2) limited knowledge of available
    services, (3) lack of language support or cultural support when accessing mental health services, (4) privacy, and (5) limited knowledge about mental health services and its effectiveness,
             Across ethnicity, on average, Chinese perceive the most barriers for seeking mental health support in the Asian community;

    Overall, 47.9% of Asians have difficulty accessing language and/or cultural support regularly when using health services in New Zealand (i.e., ability to access support is sometimes - never).
    Filipinos have the most difficulty, followed by Chinese, then Korean;
    Females experience more difficulty accessing language and/or cultural support regularly than Males;
    On average, 2-3 language and/or cultural support areas are needed to encourage Asians to access New Zealand health services. The top 3 areas are (1) cultural and social support, (2) free
    interpreting services, and (3) culturally appropriate clinical services;
             Across ethnicity, on average, Chinese report the highest number of language/cultural support areas needed to access New Zealand’s health services. In particular, Chinese are more likely to say they
             need language/cultural support around free interpreting services, culturally appropriate clinical services, culturally appropriate psychological intervention services, translated health resources, and
             ongoing updates on health-related articles via ethnic social media.

                                                                                                                                                                                                                        4
Contents

Section 1   Introduction & Methodology                                              6-9

Section 2   Asian Wellbeing Satisfaction | Worthwhileness                          10-19

Section 3   Asian Mental Health Depression | Impact of COVID-19                    20-31

Section 4   Mental Health Stigma Stigmatisation                                    32-37

Section 5   Asian Mental Health Support Barriers | Language and Cultural Support   38-53

                                                                                           5
Section 1
Introduction & Methodology
6Introduction – Research Background & Purpose:
Understanding Asians’ wellbeing and mental health are pivotal for Asian mental health and wellbeing service providers to formulate
targeted solutions, services, and strategies;
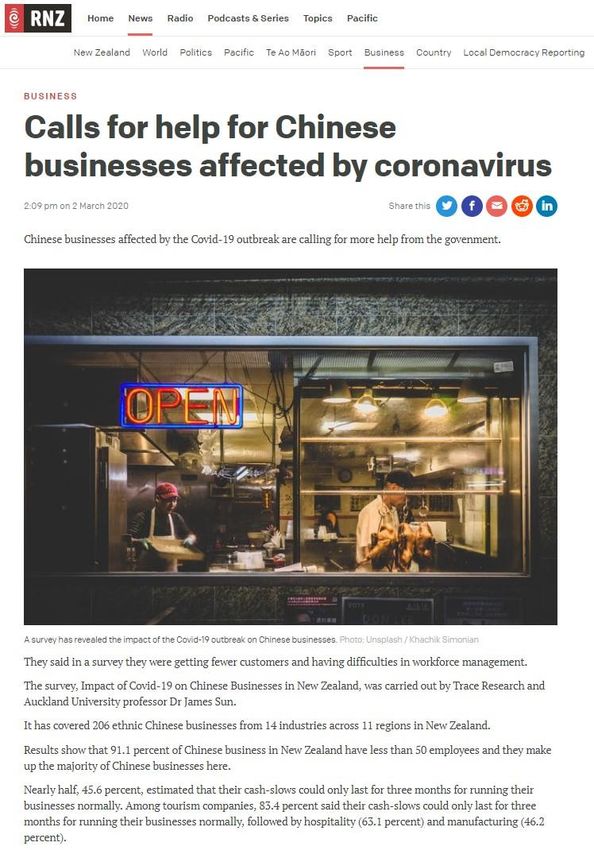
Since the outbreak of COVID-19, the Asian communities living in New Zealand have experienced tremendous difficulties and challenges,
which have led to stress, anxiety, and other mental health and social wellbeing issues. Asian Family Services (AFS) is an NGO service
provider for Asians who have been affected by mental health issues and gambling harm. Our frontline clinicians working with diverse Asian
communities have seen how high stress, anxiety, and isolation resulting from the pandemic, are taking a toll on Asians’ mental health;
Furthermore, AFS is witnessing more diverse family distress, mental health, and social care needs of our Asian clients. For instance, The
Asian Helpline, AFS’s telephone counselling service offered in seven Asian languages, recorded a 150% surge in the number of calls, whilst
mental health counselling sessions for our Asian clients saw a 138% surge from May to July 2020;
For almost two decades, no new research systematically taps into Asians’ wellbeing and mental health in New Zealand. The last
nationwide Asian mental health research was carried out in 2002;
The purpose of this project is to explore Asians’ mental wellbeing, their help-seeking behaviours around mental health, as well as correlate
social and cultural issues, especially in the latter stages of COVID-19, and investigate how the pandemic has impacted Asians’ mental
wellbeing.
7Methodology
In 2019, Trace Research Ltd conducted a telecommunication study (New Zealand broadband and online video streaming survey 2019),
which showcased that a large proportion of people (62% of Asians and 76% of Chinese specifically) can no longer be reached by
landline. Thus, the representativeness of telephone surveys based only on a random sample of households with landline service has
come under increased scrutiny;
The same telecommunication study also found that over 96.8% of Asians had access to both home broadband and 4G/5G data loaded
mobile phones in New Zealand, which was the highest level of ownership. Therefore, an online survey is the most appropriate and
effective method to reach the population of interest.;
The questionnaire used in this research was developed by Trace Research in collaboration with Asian Family Services. All scales adopted
were empirically validated by academic studies. The study adhered to the guidelines of the New Zealand Ethics Committee and judged
to be low risk; therefore was approved for a field study by Asian Family Services. Participants gave written informed consent to
participate electronically before the online survey;
Data for this report was independently collected by Trace Research Ltd between the 15th of April and the 7th of May 2021;
The results of this study are based on an online survey distributed to a nationally representative group of Asians who live in New
Zealand. The ethnic Chinese sample was collected through Trace Research’s Chinese Immigrants Research Panel (by email invitation). All
other Asian ethnic samples were collected from Trace’s partner online panel. Quota sampling was used (according to the 2018 NZ Census, Asian
Adult population distribution) to ensure representativeness of all Asian ethnic groups;
The results of this study are based on a sample of 663 Asians who currently live in New Zealand. They are spread across 17 regions in
New Zealand but originally come from more than 15 Asian countries. The margin of error is ±3.8% at the 95% confidence interval. A full
sample composition breakdown is provided in the following slide.
8Sample Composition
Gender % Count Location % Count Job Status % Count
Male 49.3% 327
Northland Region 0.6% 4 8.1% 54
Female 50.7% 336 Retired
Total 100.0% 663 Auckland Region 65.0% 431
Student 9.1% 60
Waikato Region - Hamilton 3.4% 23
Ethnicity1 % Count Unemployed 3.8% 26
Waikato Region - other 1.0% 7
Chinese 34.7% 230
Bay of Plenty Region 3.0% 20 Homemaker 8.8% 58
Indian 33.5% 222
Filipino 10.2% 67 Hawke's Bay Region 0.4% 3 Self-employed 8.7% 58
Korean 5.0% 33 Taranaki Region 0.4% 3 50.5% 335
Full-time employed
Japanese 2.5% 17 Manawatu-Wanganui Region 1.9% 13
Part-time employed 11.0% 73
Sri Lankan 2.4% 16 Wellington Region 7.7% 51
Vietnamese 1.4% 9 0.1% 1 Total 100.0% 663
Tasman Region
Cambodian 1.4% 9
Marlborough Region 0.1% 1
Other Asian 9.1% 60
Canterbury Region - Christchurch 12.4% 82
Total 100.0% 663
Canterbury Region - other 1.0% 7
Age Groups % Count 1.4% 9
Otago Region - Dunedin
18-29 years 33.4% 221
Otago Region - Queenstown 0.3% 2
30-49 years 35.1% 233
23.4% 155 Otago Region - other 0.2% 1
50-64 years
65 years + 8.1% 53 Southland Region 1.1% 7
Total 100.0% 663 Total 100.0% 663
Note: 1. Including 39 NZ born Asians.
9Section 2
Asian Wellbeing
10Section 2.1
Asian Wellbeing
Satisfaction of Life in New Zealand
11Overall, Asians tend to be satisfied with their life in New Zealand as a whole (86.5%). Across different ethnicities, Filipinos
report the highest level of life satisfaction whilst Chinese report the lowest level of life satisfaction (although still
reaching 80.2%).
Life Satisfaction in New Zealand1
Mean (out of 10) 7.1 7.9 #1 8.0 7.8 7.5
100%
7.1% 9.8% 10.8% 12.8%
90% 9.2% 20.4%
80% 17.3%
28.5%
70% 34.3%
31.5% 20.7%
60%
29.3%
50% 13.1%
30.0%
28.6%
40% 21.8%
14.5%
30% 17.2%
10.6% 12.0%
20% 19.3%
20.4% 9.9%
7.1%
10%
9.3%
0%
Chinese Indian Filipino Korean Total
Satisfied (6-10) 80.2% 88.8% 96.9% 93.1% 86.5%
0 Totally Dissatisfied 1 2 3 4 5 Neutral 6 7 8 9 10 Totally satisfied
Note 1: Q6. Overall, how satisfied are you with your life in New Zealand as a whole these days? Please rate from 0 to 10, where 0 = “Totally Dissatisfied,” and 5 = “Neutral,”,
and 10 = “Totally satisfied.”
Base: Total sample *ethnic groups with sample sizeMales are slightly more satisfied with their life in New Zealand as a whole compared to Females. Moreover, those who
are older (50+ years) are more satisfied than those who are younger (under 50 years of age).
Life Satisfaction in New Zealand1 by Gender | Age
Mean (out of 10) 7.6 7.5 7.3 7.4 7.7 8.4
100%
11.7% 12.6% 9.2%
13.8% 13.7%
90%
26.5%
80% 16.4% 17.4%
15.8%
18.1% 17.8%
70%
21.0%
60% 26.5% 28.6%
30.9%
27.7% 32.6%
50%
40%
17.8% 18.4% 34.9%
18.3% 16.2%
30%
17.7%
9.5%
20% 10.1% 11.7%
9.7%
10.5% 8.2%
10%
2.5%
0%
Male Female 18-29 years 30-49 years 50-64 years 65 years +
Satisfied (6-10) 87.6% 85.3% 82.2% 85.3% 92.3% 93.1%
0 Totally Dissatisfied 1 2 3 4 5 Neutral 6 7 8 9 10 Totally satisfied
Note 1: Q6. Overall, how satisfied are you with your life in New Zealand as a whole these days? Please rate from 0 to 10, where 0 = “Totally Dissatisfied,” and 5 = “Neutral,”,
and 10 = “Totally satisfied.”
Base: Total sample 13Across the different regions, Asians living in Christchurch have the highest level of life satisfaction in New Zealand
(92.3%). The lowest level of life satisfaction lies with those living in the Rest of the North Island (73.0%).
Life Satisfaction in New Zealand1 by Region
Mean (out of 10) 7.5 7.6 6.9 6.7 #1 8.0 7.8
100%
9.6% 6.4%
13.4% 16.9%
90% 22.0% 23.4%
80% 15.1% 27.7%
26.2%
70% 16.7% 24.0%
19.3%
60%
30.1%
50% 21.9% 27.5% 33.2%
18.8%
40% 35.6%
18.5% 11.4% 11.5%
30%
25.9% 22.1%
20% 14.8% 8.6%
9.5%
10% 7.2% 0.0%
0%
Auckland Wellington Hamilton Rest of the North Island Christchurch Rest of the South Island
Satisfied (6-10) 86.6% 86.8% 89.2% 73.0% 92.3% 89.4%
0 Totally Dissatisfied 1 2 3 4 5 Neutral 6 7 8 9 10 Totally satisfied
Note 1: Q6. Overall, how satisfied are you with your life in New Zealand as a whole these days? Please rate from 0 to 10, where 0 = “Totally Dissatisfied,” and 5 = “Neutral,”,
and 10 = “Totally satisfied.”
Base: Total sample 14Section 2.2
Asian Wellbeing
Worthwhileness
1584.8% of Asians feel the things they do in their lives are worthwhile in New Zealand. Filipinos report the highest level of
life worthwhileness in New Zealand (91.1%), and the lowest is reported by Koreans (although levels still reach 79.9%).
Life Worthwhileness in New Zealand1
Mean (out of 10) 7.2 7.7 #1 7.8 7.1 7.5
100%
5.3%
12.8% 15.9% 13.9%
90% 18.0%
12.1%
80% 11.7%
16.7%
19.0% 20.3%
70%
25.6% 36.9%
60%
27.6%
50%
30.5% 33.7%
40% 18.2%
14.5%
16.5%
30%
13.0% 11.5% 11.1%
12.3%
20% 10.1%
7.7%
8.9%
10%
0%
Chinese Indian Filipino Korean Total
Worthwhileness 81.3% 86.7% 91.1% 79.9% 84.8%
(6-10)
0 Totally Not Worthwhile 1 2 3 4 5 Neutral 6 7 8 9 10 Totally Worthwhile
Note 1: Q7. Overall, to what extent do you feel the things you do in your life are worthwhile in New Zealand? Please rate from 0 to 10, where 0 = “Totally Not Worthwhile,”
and 5 = “Neutral,”, and 10 = “Totally Worthwhile.”
Base: Total sample *ethnic groups with sample sizeFemales report slightly higher levels of life worthwhileness in New Zealand compared to Males. Across age, those 65+
report the highest level of life worthwhileness (96.1%). In contrast, those under 30 years report the lowest level of life
worthwhileness.
Life Worthwhileness in New Zealand1 by Gender | Age
Mean (out of 10) 7.4 7.5 7.1 7.5 7.6 #1 8.5
100%
12.1% 10.1% 12.6%
90% 15.7% 16.3%
28.3%
80% 16.2% 14.3%
20.6% 12.9%
19.0%
70%
60% 28.2% 27.5% 22.4%
28.8%
26.4%
50% 25.3%
40%
15.5% 19.1%
15.0% 17.9% 32.4%
30% 17.3%
11.8%
20% 9.9% 10.2% 11.4% 6.8%
6.5%
10%
6.5%
0%
Male Female 18-29 years 30-49 years 50-64 years 65 years +
Worthwhileness 84.0% 85.5% 81.8% 84.9% 84.7% 96.1%
(6-10)
0 Totally Not Worthwhile 1 2 3 4 5 Neutral 6 7 8 9 10 Totally Worthwhile
Note 1: Q7. Overall, to what extent do you feel the things you do in your life are worthwhile in New Zealand? Please rate from 0 to 10, where 0 = “Totally Not Worthwhile,”
and 5 = “Neutral,”, and 10 = “Totally Worthwhile.”
Base: Total sample 17Across the different regions, those living in Christchurch reported the highest level of life worthwhileness (92.4%), closely
following by those living in Wellington (90.4%). Those living in the Rest of the North Island report the lowest life worth
(69.7%).
Life Worthwhileness in New Zealand1 by Region
Mean (out of 10) 7.5 7.9 6.9 6.7 7.9 7.1
100%
5.8% 5.1% 5.1%
15.4% 14.4% 16.4%
90%
13.0% 17.3%
80% 28.0%
15.3%
22.3% 13.0% 17.3%
70%
26.0%
60% 9.7%
26.9% 28.2%
50%
7.9% 37.5%
35.8%
40% 33.8%
13.4%
16.8%
30% 21.5%
20% 10.2% 11.9% 13.8%
8.4%
6.0% 7.4%
10%
0%
Auckland Wellington Hamilton Rest of the North Island Christchurch Rest of the South Island
Worthwhileness 84.6% 90.4% 81.5% 69.7% 92.4% 85.0%
(6-10)
0 Totally Not Worthwhile 1 2 3 4 5 Neutral 6 7 8 9 10 Totally Worthwhile
Note 1: Q7. Overall, to what extent do you feel the things you do in your life are worthwhile in New Zealand? Please rate from 0 to 10, where 0 = “Totally Not Worthwhile,”
and 5 = “Neutral,”, and 10 = “Totally Worthwhile.”
Base: Total sample 18Regarding the Total Asian Wellbeing Index, those who score higher than total levels tend to be Indian, Filipino, 65+ years,
and those living in Wellington and Christchurch. In contrast, those who score lower than total levels tend to be Chinese,
under 30 years, and those living in Hamilton and the Rest of the North Island.
Total Asian Wellbeing Index
8.5 8.5
8.4 8.4
8.0
8.0 8.0 8.0
7.9 7.9 7.8 7.9 7.9
7.8 7.8 7.8 7.8
7.7 7.7 7.7 7.5
7.6 7.6 7.6
7.5 7.57.5 7.5
7.5 7.5 7.5 7.5
7.5 7.5 7.5 7.5
7.2 7.4 7.4 7.4 7.4
7.3
7.2
7.1 7.1 7.1 7.1
7.0 7.1 6.9 6.9
6.9
6.7 6.7
6.7
6.5
6.0
Satisfaction Worthwhileness Total Wellbeing Index
19Section 3
Asian Mental Health
20Section 3.1
Asian Mental Health
Depression
21The top 3 symptoms of depression experienced by Asians ‘all of the time’ were feeling lonely (11.5%), feeling everything
that I did was an effort (11.0%), and that their sleep was restless (8.8%); however, levels all sit relatively low.
Centre for Epidemiological Studies Depression (CES-D10) (Radloff 1977)
This research adopted a short, 10-item version of the Centre Overall response of CES-D10 scale among Asians
for Epidemiological Studies Depression (CES-D) scale
(see scale items on the right) to measure Asians’ feelings in
I felt hopeful about the future 7.4% 24.7% 39.3% 28.6%
response to the COVID-19 outbreak in New Zealand. This Positive
measure has been used extensively in general patient and affect
I was happy 9.0% 28.1% 44.5% 18.4%
older adult populations. All questions include four response
categories (0–3). There are eight items that measure
symptoms of depression frequency and two that measure I felt lonely 34.8% 29.4% 24.3% 11.5% #1
positive affect, and that are reverse coded to fit the
measurement scale model. The CES-D10 scale produces a I felt that everything I did was an effort 20.9% 36.5% 31.5% 11.0% #2
continuous score that dichotomizes at eight points
(equivalent to the full CES-D of 16 points) for classifying My sleep was restless 29.8% 34.2% 27.2% 8.8% #3
subjects with clinically relevant symptoms of depression.
I was bothered by things that usually don’t bother me 25.7% 37.9% 27.7% 8.7%
The main purpose of this research is to categorise the Asian Symptoms of
population based on depressive symptoms, therefore depression
detailed statistical procedures are not included in this report. I felt depressed 35.8% 33.1% 22.4% 8.7%
Please be aware that the CES-D10 scale is better suited as a
screening tool rather than a diagnostic instrument. I had trouble keeping my mind on what I was doing 32.9% 37.3% 21.8% 7.9%
Interpretation of cutoff score I felt fearful 30.6% 40.2% 23.1% 6.1%
0-9: no significant depressive symptoms
I could not “get going” 30.5% 36.3% 27.8% 5.3%
10-15: at risk of depression
16 and over: at high risk of depression
Rarely or none of the time 0 1 2 All of the time 3
22In total, 44.4% of Asians are at risk of depression. Koreans are the most likely group to be at risk of depression, followed
by Indians and Filipinos. In contrast, Chinese are the least likely group to be at risk of depression.
Risk of depression due to COVID-19 amongst Asians in New Zealand1
Total Risk of
36.4% #2 51.1% #3 47.4% #1 64.1% 44.4%
Depression
100%
8.5% 11.1%
17.6% 14.8%
90% 22.0%
80%
27.9%
70% 29.6%
29.8%
29.1% 53.0%
60%
50%
40%
30% 63.6%
52.7% 55.7%
48.9%
20%
35.9%
10%
0%
Chinese Indian Filipino Korean Total
No significant depressive symptom At risk of depression At high risk of depression
Note 1: Q8. Below is a list of the ways you might have felt or behaved during the pandemic. Please tell us how often you have felt this way since the outbreak of COVID-19
in New Zealand. Please rate from 0 to 3, where 0 = “rarely or none of the time”, and 3 = “all of the time.”
Base: Total sample *ethnic groups with sample sizeFemales are only slightly more at risk of depression compared to Males. Across age, those who are younger (under 30
years) have the highest risk of depression (61.3%), whilst those who are older (65+ years) have the lowest risk of
depression (23.4%).
Risk of depression due to COVID-19 amongst Asians in New Zealand1 by Gender | Age
Total Risk of
43.6% 45.0% 61.3% 44.7% 26.8% 23.4%
Depression
100%
4.4%
13.9% 15.6% 14.4% 13.1%
90% 18.8%
19.0%
80% 13.7%
70% 29.7% 29.4% 30.3%
60% 42.5%
50%
40% 76.6%
73.2%
30%
56.4% 55.0% 55.3%
20% 38.7%
10%
0%
Male Female 18-29 years 30-49 years 50-64 years 65 years +
No significant depressive symptom At risk of depression At high risk of depression
Note 1: Q8. Below is a list of the ways you might have felt or behaved during the pandemic. Please tell us how often you have felt this way since the outbreak of COVID-19
in New Zealand. Please rate from 0 to 3, where 0 = “rarely or none of the time”, and 3 = “all of the time.”
Base: Total sample 24Across regions, those living in Christchurch have the highest risk of depression (59.0%), followed by those living in
Hamilton (57.0%) and the Rest of the North Island (50.7%). Those living in Wellington have the lowest level of risk
(35.3%).
Risk of depression due to COVID-19 amongst Asians in New Zealand1 by Region
Total Risk of
41.8% 35.3% #2 57.0% #3 50.7% #1 59.0% 35.9%
Depression
100%
6.9% 7.1%
16.2% 13.4% 13.6%
90% 22.1%
80% 28.4% 28.8%
70% 25.6%
37.3%
45.4%
60% 34.9%
50%
40%
30% 64.6% 64.1%
58.2%
49.2%
20% 43.0% 41.0%
10%
0%
Auckland Wellington Hamilton Rest of the North Island Christchurch Rest of the South Island
No significant depressive symptom At risk of depression At high risk of depression
Note 1: Q8. Below is a list of the ways you might have felt or behaved during the pandemic. Please tell us how often you have felt this way since the outbreak of COVID-19
in New Zealand. Please rate from 0 to 3, where 0 = “rarely or none of the time”, and 3 = “all of the time.”
Base: Total sample 25Section 3.2
Asian Mental Health
Impact of COVID-19
26On average, Asians tend to worry about 4-5 issues as a result of Covid-19. The top 5 worries are (1) not being able to
return to their home country for a reunion, (2) a recession, (3) racial discrimination, (4) the health system being
overloaded, and (5) increased mental stress.
Ranking of concerns due to the impact of COVID-191
#1 Cannot return to home country for reunion 50.2%
#2 Recession 43.6%
#3 Racial discrimination 40.3%
#4 Health system being overloaded 38.9%
#5 Increased mental stress 38.8%
Losing someone I love 38.1%
Becoming unemployed 38.1%
Getting seriously ill and/or being in hospitals 35.3%
Small companies running out of business 31.9%
Feeling isolated 26.8%
Society getting more egoistic (i.e., selfishness) 24.9%
Restricted access to food supplies 22.1%
Schools closing 18.5%
Blackouts (no electricity) 8.7%
Nothing to worry about 1.6%
Note 1: Q9. What do you worry about due to the impact of COVID-19?
Base: Total sample
27On average, Chinese worry the most as a result of Covid-19. In particular, Chinese are more likely to worry about a
recession, racial discrimination, and society getting more egoistic. Indians are more likely to worry about small
companies running out of business. Filipinos are more likely to worry about losing someone they love and getting
seriously ill. Koreans are more likely to worry about racial discrimination, feeling isolated, and schools closing.
Concerns due to the impact of COVID-191 by Major Asian Ethnic Groups
60% 59.8%
57.7% Legend ranked by total concerns
56.0% 54.9%
50.8% 55.0%
Cannot return to home country for reunion
50% Recession
Racial discrimination
42.2% 42.4% 42.4% 43.3% Health system being overloaded
42.1%
40% Increased mental stress
37.1% 36.9%
34.3% Losing someone I love
34.6% Becoming unemployed
Getting seriously ill and/or being in hospitals
30%
28.1% 27.2% Small companies running out of business
27.0%
Feeling isolated
24.0% 23.5%
Society getting more egoistic (i.e., selfishness)
20%
Restricted access to food supplies
Schools closing
Blackouts (no electricity)
10% Nothing to worry about
0%
Chinese Indian Filipino Korean
Average number of
4.9 4.3 4.1 4.3
issues worried about
Note 1: Q9. What do you worry about due to the impact of COVID-19?
Base: Total sample *ethnic groups with sample sizeOn average, Females worry more than Males as a result of Covid-19. In particular, Females are more likely to worry about
not being able to return to their home country for a reunion, the health system is overloaded, and losing someone they
love.
Concerns due to the impact of COVID-191 by Gender
60%
Legend ranked by total concerns
56.7%
Cannot return to home country for reunion
50% Recession
46.1%
Racial discrimination
43.7% 43.0%
Health system being overloaded
41.1% 42.0%
40% Increased mental stress
38.6% 41.1%
Losing someone I love
36.3% 34.7%
Becoming unemployed
Getting seriously ill and/or being in hospitals
30%
Small companies running out of business
Feeling isolated
Society getting more egoistic (i.e., selfishness)
20%
Restricted access to food supplies
Schools closing
Blackouts (no electricity)
10% Nothing to worry about
0%
Male Female
Average number of 4.2 4.9
issues worried about
Note 1: Q9. What do you worry about due to the impact of COVID-19?
Base: Total sample
29On average, those aged 65+ worry the most as a result of Covid-19. In particular, they are more likely to worry about a recession,
getting seriously ill, society getting more egoistic, and restricted access to supplies. Those 18-29 years are more likely to worry
about increased mental stress, feeling isolated, and being unemployed. Those 30-49 years are more likely to be worried about
being unemployed. Those 50-64 years are more likely to worry about the health system being overloaded.
Concerns due to the impact of COVID-191 by Age
70%
Legend ranked by total concerns
Cannot return to home country for reunion
60% 56.3% 59.4%
54.3% 53.3% Recession
Racial discrimination
50.6% 52.2%
50% 49.9% Health system being overloaded
46.8% Increased mental stress
41.0% 43.3% 44.8% Losing someone I love
41.0% 41.6% 44.6%
40% Becoming unemployed
36.2% Getting seriously ill and/or being in hospitals
33.6% 33.9%
Small companies running out of business
30.9%
30% Feeling isolated
27.9%
24.8% Society getting more egoistic (i.e., selfishness)
Restricted access to food supplies
20%
Schools closing
Blackouts (no electricity)
Nothing to worry about
10%
0%
18-29 years 30-49 years 50-64 years 65 years +
Average number of
issues worried about 4.3 4.7 4.6 5.2
Note 1: Q9. What do you worry about due to the impact of COVID-19?
Base: Total sample
30On average, those living in Hamilton worry the most due to Covid-19, in particular, they are more likely to worry about a
recession, racial discrimination, increased mental stress, feeling isolated, and restricted access to food supplies. Those living in
Auckland are more likely to worry about racial discrimination. Wellington is more likely to worry about the health system being
overloaded and small companies running out of business. The rest of the South Island are more likely to worry about losing
someone they love and feeling isolated.
Concerns due to the impact of COVID-191 by Region
60% 57.9%
Legend ranked by total concerns
55.0%
52.7%
51.7% 52.3% 49.2% Cannot return to home country for reunion
50% 50.9%
Recession
47.0% 48.1%
Racial discrimination
44.9% 45.1%
43.5% Health system being overloaded
41.8% 38.3%
40% 40.2% 39.1%
Increased mental stress
38.3%
36.8% Losing someone I love
32.9% 34.2% Becoming unemployed
32.7% 32.7% 33.2%
31.8% Getting seriously ill and/or being in hospitals
30% 29.7% 32.7% 29.3%
Small companies running out of business
25.8% Feeling isolated
24.8%
Society getting more egoistic (i.e., selfishness)
20%
Restricted access to food supplies
15.3% Schools closing
Blackouts (no electricity)
10% Nothing to worry about
0%
Auckland Wellington Hamilton Rest of the North Island Christchurch Rest of the South Island
Average number of
issues worried about 4.7 4.6 5.5 3.8 4.0 3.8
Note 1: Q9. What do you worry about due to the impact of COVID-19?
Base: Total sample
31Section 4
Mental Health Stigma
Stigmatisation
3298.7% of Asians believe the public hold negative stereotypes against people with mental illnesses. On average, there are
4-5 expressions of public stigma surrounding mental illnesses. The top 5 are (1) being withdrawn, isolated, lonely, (2)
high risk of suicide and self-harm tendencies, (3) being insecure/lacking confidence, (4) being not normal/unusual, and
(5) being vulnerable/weak.
Ranking of Expressions of Public Stigma Surrounding Mental Illnesses1
#1 Being withdrawn, isolated, lonely 43.6%
#2 High risk of suicide and self-harm tendencies 40.7%
#3 Being insecure/ lacking confidence 40.6%
#4 Being not normal/unusual 37.8%
#5 Being vulnerable/weak 36.8%
Having low self-esteem 35.8%
Being hopeless/useless 29.8%
Being a burden/risk to society 28.4%
Being abusive and violent 27.7%
Being less worth than normal people 27.4%
Often engaging in negative self-dialogue 24.6%
From a dysfunctional family 23.6%
Having genetic problems 21.1%
Being untreatable/ not recoverable 18.5%
Having cult beliefs 9.5%
Don't know 1.3%
Note 1: Q10. What type of labelling do you think most people/public attach to people with mental illness/es in New Zealand? Note that this question refers to your
perception of other people’s views, not your own views. Please select all that apply
Base: Total sample 33On average, Indians have the highest expressions of public stigma surrounding mental illness, in particular, they are more likely to
report expressions of public stigma around being insecure/lacking confidence, being not normal/unusual, and being
hopeless/useless. Chinese are more likely to report expressions of public stigma around being a burden/risk to society and being
abusive and violent. Filipinos are more likely to report expressions of public stigma around being less worthy than normal people.
Koreans are more likely to report expressions of public stigma around the high risk of suicide, being vulnerable/weak, and having
low self-esteem.
Expressions of Public Stigma Surrounding Mental Illnesses1 by Major Asian Ethnic Groups
70%
Legend ranked by total stigma
65.6%
Being withdrawn, isolated, lonely
60%
High risk of suicide and self-harm tendencies
Being insecure/ lacking confidence
52.8%
50% 46.7% Being not normal/unusual
47.5% Being vulnerable/weak
45.3% 46.1%
44.3% 41.5%43.1%
40.5% 41.4%
Having low self-esteem
40% 38.9% Being hopeless/useless
38.5% 37.6%
Being a burden/risk to society
34.4% 34.1%
32.6% 33.0% Being abusive and violent
32.4%
30% 29.0% Being less worth than normal people
Often engaging in negative self-dialogue
From a dysfunctional family
20%
Having genetic problems
Being untreatable/ not recoverable
Having cult beliefs
10%
Don't know
0%
Chinese Indian Filipino Korean
Average number
of expressions 4.1 4.8 4.6 4.3
Note 1: Q10. What type of labelling do you think most people/public attach to people with mental illness/es in New Zealand? Note that this question refers to your
perception of other people’s views, not your own views. Please select all that apply
Base: Total sample *ethnic groups with sample sizeOn average Females have slightly more expressions of public stigma surrounding mental illnesses compared to Males. In
particular, Females are more likely to report expressions of public stigma around the high risk of suicide and self-harm
tendencies, being hopeless/useless, being less worthy than normal people, and from a dysfunctional family.
Expressions of Public Stigma Surrounding Mental Illnesses1 by Gender
60%
Legend ranked by total stigma
Being withdrawn, isolated, lonely
50% High risk of suicide and self-harm tendencies
45.0% Being insecure/ lacking confidence
44.8%
Being not normal/unusual
42.4%
39.3% 41.8%
40% 38.0% 37.6% Being vulnerable/weak
37.5% Having low self-esteem
36.1%
36.0% Being hopeless/useless
Being a burden/risk to society
30%
Being abusive and violent
Being less worth than normal people
Often engaging in negative self-dialogue
20%
From a dysfunctional family
Having genetic problems
Being untreatable/ not recoverable
10% Having cult beliefs
Don't know
0%
Male Female
Average number
4.2 4.7
of expressions
Note 1: Q10. What type of labelling do you think most people/public attach to people with mental illness/es in New Zealand? Note that this question refers to your
perception of other people’s views, not your own views. Please select all that apply
Base: Total sample 35On average, those aged 65+ express the most public stigma surrounding mental illnesses. Specifically, those 65+ are more
likely to report all the different expressions of public stigma compared to other age groups. With the exception of those
65+, those 18-29 years are more likely to report expressions of public stigma around having low self-esteem.
Expressions of Public Stigma Surrounding Mental Illnesses1 by Age
70%
Legend ranked by total stigma
60% 58.7% Being withdrawn, isolated, lonely
58.0% High risk of suicide and self-harm tendencies
53.3% Being insecure/ lacking confidence
51.4%
50% 49.0% Being not normal/unusual
44.5%
45.5% 44.2% Being vulnerable/weak
44.4% 40.6%
42.8% 41.6% Having low self-esteem
40% 40.6% 40.4% Being hopeless/useless
35.6% Being a burden/risk to society
32.2%
32.2% 33.2% 32.6% 33.2% Being abusive and violent
30% Being less worth than normal people
Often engaging in negative self-dialogue
From a dysfunctional family
20%
Having genetic problems
Being untreatable/ not recoverable
Having cult beliefs
10%
Don't know
0%
18-29 years 30-49 years 50-64 years 65 years +
Average number 4.6 3.9 4.3 6.7
of expressions
Note 1: Q10. What type of labelling do you think most people/public attach to people with mental illness/es in New Zealand? Note that this question refers to your
perception of other people’s views, not your own views. Please select all that apply
Base: Total sample 36On average, those living in Wellington and the Rest of the South Island express the most public stigma surrounding mental
illnesses. Asians from Wellington are more likely to report expressions of public stigma around being withdrawn/isolated/lonely,
being a burden/risk to society, and being abusive and violent. The Rest of the South Island are more likely to report expressions of
public stigma around being insecure/lacking confidence and having genetic problems. Hamilton are more likely to report
expressions of public stigma around being insecure/lacking confidence, being less worthy than normal people, and having cult
beliefs.
Expressions of Public Stigma Surrounding Mental Illnesses1 by Region
59.4%
60%
55.4% 57.8% Legend ranked by total stigma
53.6%
Being withdrawn, isolated, lonely
48.9% 48.9% 49.8%
50% High risk of suicide and self-harm tendencies
51.2%
44.1% Being insecure/ lacking confidence
41.2% 43.9% Being not normal/unusual
40% 39.7% 41.1% Being vulnerable/weak
39.0% 39.7% 40.6%
38.9% 37.2% 37.3% 36.8% 37.6% Having low self-esteem
38.8% 38.9%
Being hopeless/useless
32.3%
Being a burden/risk to society
30% 29.0% 29.0% Being abusive and violent
26.8%
24.0% 26.3% Being less worth than normal people
23.2%
Often engaging in negative self-dialogue
20%
From a dysfunctional family
Having genetic problems
Being untreatable/ not recoverable
10% Having cult beliefs
Don't know
0%
Auckland Wellington Hamilton Rest of the North Island Christchurch Rest of the South Island
Average number
of expressions 4.4 5.2 4.5 4.3 4.1 5.0
Note 1: Q10. What type of labelling do you think most people/public attach to people with mental illness/es in New Zealand? Note that this question refers to your
perception of other people’s views, not your own views. Please select all that apply
Base: Total sample 37Section 5
Asian Mental Health Support
38Section 5.1
Asian Mental Health Support
Perceived Barriers for Seeking Mental Health Support
39On average, Asians perceive 4-5 barriers to seeking mental health support in the Asian community. The top 5 are (1) lack
of awareness of mental disorders, (2) limited knowledge of available services, (3) lack of language support or cultural
support when accessing mental health services, (4) privacy, and (5) limited knowledge about mental health services and
its effectiveness.
Ranking of Perceived Barriers for Seeking Mental Health Support in the Asian Community1
#1 Lack of awareness of mental disorders 49.0%
#2 Limited knowledge of available services 48.3%
#3 Lack of language support or cultural support when accessing mental health resources 48.3%
#4 Privacy 43.5%
#5 Limited knowledge about mental health services and its effectiveness 42.5%
The stigma associated with mental disorders 42.2%
Insufficient financial resources to access mental health services 34.3%
Prefer self-help strategies or alternative interventions 33.8%
Low confidence in mainstream mental health & addiction services 28.9%
I thought the problem has not triggered serious family issues 22.6%
I thought the problem has not triggered serious workplace issues 15.4%
Note: 1. Q11. According to AFS’ 2020 research, just over 50% of Asians were reluctant to seek help from professional counsellor services to solve their mental health-
related problems. Which of the following do you believe to be key barriers of seeking professional help for mental health problems? Please select all that apply.
Base: Total sample
40On average, Chinese perceive the most barriers for seeking mental health support in the Asian community. In particular, Chinese
are more likely to report barriers around limited knowledge of available services, lack of language or cultural support, privacy, and
thought the problem had not triggered serious family issues or workplace issues. In contrast, Filipinos are more likely to report
barriers around the stigma associated with mental disorders and low confidence in mainstream mental health & addiction
services.
Perceived Barriers for Seeking Mental Health Support in the Asian Community1 by Major Asian Ethnic Groups
70% Legend ranked by total perceived barriers
65.0%
Lack of awareness of mental disorders
60%
55.2%
55.8% Limited knowledge of available services
52.4% 49.9%
48.2% 51.7%
50% 51.2% 48.3% Lack of language support or cultural support when
accessing mental health resources
47.0%
43.6% Privacy
40% 39.7% 40.9%
39.6% 39.1% Limited knowledge about mental health services and its
36.2% effectiveness
The stigma associated with mental disorders
30% 29.6%
26.9% Insufficient financial resources to access mental health
services
21.6% Prefer self-help strategies or alternative interventions
20%
Low confidence in mainstream mental health &
14.5% addiction services
10% I thought the problem has not triggered serious family
issues
I thought the problem has not triggered serious
workplace issues
0%
Chinese Indian Filipino Korean
Average number of
4.6 3.8 4.1 2.5
perceived barriers
Note: 1. Q11. According to AFS’ 2020 research, just over 50% of Asians were reluctant to seek help from professional counsellor services to solve their mental health-
related problems. Which of the following do you believe to be key barriers of seeking professional help for mental health problems? Please select all that apply.
Base: Total sample *ethnic groups with sample sizeOn average, Females have more perceived barriers for seeking mental health support in the Asian community compared
to Males. While all barriers are rated higher by Females than Males, the greatest difference in perceived barriers lies with
the lack of awareness of mental disorders, limited knowledge of available services, and the stigma associated with
mental disorders.
Perceived Barriers for Seeking Mental Health Support in the Asian Community1 by Gender
70%
Legend ranked by total perceived barriers
Lack of awareness of mental disorders
60%
54.9%
Limited knowledge of available services
53.5%
50% 49.4% Lack of language support or cultural support when
47.2% accessing mental health resources
42.9% 45.8%
45.4%
42.9% Privacy
40% 41.1%
39.5% Limited knowledge about mental health services and its
effectiveness
The stigma associated with mental disorders
30%
Insufficient financial resources to access mental health
services
Prefer self-help strategies or alternative interventions
20%
Low confidence in mainstream mental health &
addiction services
10% I thought the problem has not triggered serious family
issues
I thought the problem has not triggered serious
workplace issues
0%
Male Female
Average number of
perceived barriers 3.7 4.5
Note: 1. Q11. According to AFS’ 2020 research, just over 50% of Asians were reluctant to seek help from professional counsellor services to solve their mental health-
related problems. Which of the following do you believe to be key barriers of seeking professional help for mental health problems? Please select all that apply.
Base: Total sample 42On average, those aged 65+ perceive the most barriers for seeking mental health support in the Asian community. In
particular, they are more likely to perceive barriers around limited knowledge of available services, privacy, prefer self-
help strategies or alternative interventions, low confidence in mainstream mental health and addiction services, and
thought that the problem had not triggered serious family issues.
Perceived Barriers for Seeking Mental Health Support in the Asian Community1 by Age
80%
Legend ranked by total perceived barriers
70% 70.9% Lack of awareness of mental disorders
Limited knowledge of available services
60%
58.5% Lack of language support or cultural support when
51.7% 53.7% 55.2% accessing mental health resources
54.3%
46.2% 53.3% Privacy
50%
47.1% 47.3% 48.4%
46.7% 47.1%
44.3% 46.9% Limited knowledge about mental health services and its
40.6% effectiveness
42.6% 40.6%
40% 40.2% The stigma associated with mental disorders
37.9%
Insufficient financial resources to access mental health
services
30%
Prefer self-help strategies or alternative interventions
Low confidence in mainstream mental health &
20% addiction services
I thought the problem has not triggered serious family
issues
10% I thought the problem has not triggered serious
workplace issues
0%
18-29 years 30-49 years 50-64 years 65 years +
Average number of 3.9 3.9 4.3 5.1
perceived barriers
Note: 1. Q11. According to AFS’ 2020 research, just over 50% of Asians were reluctant to seek help from professional counsellor services to solve their mental health-
related problems. Which of the following do you believe to be key barriers of seeking professional help for mental health problems? Please select all that apply.
Base: Total sample 43On average, those living in Hamilton perceive the highest number of barriers for seeking mental health support in the Asian community. In particular,
they are more likely to perceive barriers around the lack of language or cultural support, limited knowledge about mental health services and their
effectiveness, and low confidence in mainstream mental health & addiction services. In contrast, Asians from Wellington are more likely to perceive
barriers around the lack of awareness of mental disorders; the Rest of the North Island are more likely to perceive barriers around insufficient
financial resources and thought the problem had not triggered serious workplace issues; and the Rest of the South Island are more likely to perceive
barriers around preferring self-help strategies or alternative interventions and thought the problem had not triggered serious family issues.
Perceived Barriers for Seeking Mental Health Support in the Asian Community1 by Region
70% 68.2%
Legend ranked by total perceived barriers
63.8%
Lack of awareness of mental disorders
60%
56.3%
Limited knowledge of available services
50.3% 54.5%
49.3% 52.8%
50% 51.0% 50.2%
49.4% Lack of language support or cultural support when
47.1% accessing mental health resources
47.2% 46.7%
45.3%
44.8% 43.1%
Privacy
42.1% 42.3%
40% 39.4% 39.4%
38.4% 38.2% 38.7% Limited knowledge about mental health services and its
effectiveness
35.0% 34.3%
32.9% 33.4% The stigma associated with mental disorders
29.9% 31.4%
30%
Insufficient financial resources to access mental health
services
24.3%
Prefer self-help strategies or alternative interventions
20%
Low confidence in mainstream mental health &
addiction services
10% I thought the problem has not triggered serious family
issues
I thought the problem has not triggered serious
workplace issues
0%
Auckland Wellington Hamilton Rest of the North Island Christchurch Rest of the South Island
Average number of
perceived barriers 4.2 4.1 4.4 3.6 3.6 3.8
Note: 1. Q11. According to AFS’ 2020 research, just over 50% of Asians were reluctant to seek help from professional counsellor services to solve their mental health-
related problems. Which of the following do you believe to be key barriers of seeking professional help for mental health problems? Please select all that apply.
Base: Total sample *ethnic groups with sample sizeSection 5.2
Asian Mental Health Support
Language & Cultural Support
45Overall, 47.9% of Asians have difficulty accessing language and/or cultural support regularly when using health services
in New Zealand (i.e., ability to access support is sometimes - never). Filipinos have the most difficulty, followed by
Chinese, then Korean.
Access language and/or cultural support in New Zealand1
Ability to access
sometimes - never 50.7% #2 43.7% 52.6% #1 46.3% #3 47.9%
100%
10.0% 9.5% 8.6% 11.8% 9.2%
90%
12.9% 18.2% 15.6%
80% 16.8%
18.9%
70%
21.3%
23.9% 15.6% 23.1%
60% 25.8%
50%
40% 29.2%
31.6%
31.3%
30% 35.8%
53.7%
20%
27.2%
10% 18.1% 20.4%
11.6%
0%
Chinese Indian Filipino Korean Total
Almost always Most of the time Sometimes Rarely Never
Note 1: Q12. Are you able to access language and/or cultural support when you use health services in New Zealand?
Base: Total sample *ethnic groups with sample sizeFemales experience more difficulty accessing language and/or cultural support regularly than Males (i.e., ability to access
support is sometimes - never). Across age, those who are younger (under 50 years of age) experience more difficulty
accessing language and/or cultural support than those who are older (aged 50+).
Access language and/or cultural support in New Zealand1 by Gender | Age
Ability to access
sometimes - never 40.2% 56.6% 48.9% 57.4% 34.8% 35.7%
100%
10.0% 8.4% 8.1% 9.1% 7.3%
12.0%
90%
10.8% 14.3% 16.8%
80% 21.0% 19.1% 10.8%
70% 19.4% 12.0% 11.6%
26.5%
60%
27.2% 29.2%
19.9%
50% 31.7%
34.2%
40%
36.3%
30% 28.7% 30.4%
20% 44.5%
33.4%
25.7%
10%
14.6% 14.9% 12.2%
0%
Male Female 18-29 years 30-49 years 50-64 years 65 years +
Almost always Most of the time Sometimes Rarely Never
Note 1: Q12. Are you able to access language and/or cultural support when you use health services in New Zealand?
Base: Total sample
47Across region, those living in the Rest of the South Island experience the most difficulty accessing language and/or
cultural support regularly when using health services in New Zealand (i.e., ability to access support is sometimes - never).
Next are those living in Christchurch and those living in Wellington.
Access language and/or cultural support in New Zealand1 by Region
Ability to access
sometimes - never 45.6% 53.2% #3 34.6% 49.0% 54.9% #2 71.0% #1
100%
6.6% 8.5% 10.6% 9.0%
90% 20.3% 21.0%
14.1%
80% 23.3%
8.2% 23.5%
11.1% 33.9%
70%
24.9% 2.8%
60% 24.7% 16.9%
20.8%
50%
37.1%
28.1%
40% 32.3% 27.6%
30% 26.4%
37.2%
20%
28.3% 29.0%
10% 22.1% 23.5%
18.6%
9.6%
0%
Auckland Wellington Hamilton Rest of the North Island Christchurch Rest of the South Island
Almost always Most of the time Sometimes Rarely Never
Note 1: Q12. Are you able to access language and/or cultural support when you use health services in New Zealand?
Base: Total sample
48On average, 2-3 language and/or cultural support areas are needed to encourage Asians to access New Zealand health
services. The top 3 areas are (1) cultural and social support, (2) free interpreting services, and (3) culturally appropriate
clinical services.
Ranking of Areas of Language/Cultural Support Needed for Accessing Health Services in the Asian Community1
#1 Cultural and social support 49.2%
#2 Free interpreting services 39.7%
#3 Culturally appropriate clinical services 39.5%
Culturally appropriate psychological intervention services 35.7%
Translated health resources 32.5%
Ongoing updates on health-related articles via ethnic social media (e.g., WeChat) 24.7%
None 8.7%
Note: 1. Q13 Which area of language and/or cultural support might be needed for you to access New Zealand health services? Please select all that apply.
Base: Total sample
49On average, Chinese report the highest number of language/cultural support areas needed to access New Zealand’s
health services. In particular, Chinese are more likely to say they need language/cultural support around free interpreting
services, culturally appropriate clinical services, culturally appropriate psychological intervention services, translated
health resources, and ongoing updates on health-related articles via ethnic social media.
Areas of Language/Cultural Support Needed for Accessing Health Services1 by Major Asian Ethnic Groups
70%
Legend ranked by total needs
58.9% Cultural and social support
60%
57.4%
55.5% 53.3% Free interpreting services
52.5% 48.7%
50% Culturally appropriate clinical services
49.7%
45.2% Culturally appropriate psychological intervention
41.5% services
40% 41.1%
Translated health resources
34.6%
32.1% 30.9% 32.5% Ongoing updates on health-related articles via ethnic
social media (e.g., WeChat)
30% 30.6%
28.1% None
20.6% 21.4%
20% 19.0%
16.3% 16.1%
14.5%
11.4% 9.3%
10%
11.2%
6.7%
4.5%
0% 0.0%
Chinese Indian Filipino Korean
Average number
of areas needed 3.2 1.7 1.7 1.6
Note: 1. Q13 Which area of language and/or cultural support might be needed for you to access New Zealand health services? Please select all that apply.
Base: Total sample *ethnic groups with sample sizeMales are more likely to say they need two areas of language/cultural support to access New Zealand health services,
these are (1) cultural and social support and (2) translated health resources. In contrast, Females are more likely to say
they need ongoing updates on health-related articles via ethnic social media.
Areas of Language/Cultural Support Needed for Accessing Health Services1 by Gender
70%
Legend ranked by total needs
Cultural and social support
60%
Free interpreting services
51.2% 47.2%
50% Culturally appropriate clinical services
Culturally appropriate psychological intervention
39.6% 39.8% services
40% 39.6%
39.5% Translated health resources
34.5% 36.6%
34.7% Ongoing updates on health-related articles via ethnic
30% 30.6% social media (e.g., WeChat)
29.0%
None
20% 20.4%
10%
8.1%
9.3%
0%
Male Female
Average number
2.2 2.2
of areas needed
Note: 1. Q13 Which area of language and/or cultural support might be needed for you to access New Zealand health services? Please select all that apply.
Base: Total sample
51On average, those 65+ report the highest number of language/cultural support areas needed to access New Zealand’s health
services, closely followed by those aged 30-49 years. Those 65+ are more likely to need free interpreting services and culturally
appropriate clinical services. In contrast, those 30-49 years are more likely to need culturally appropriate psychological
intervention services and translated health resources, whilst those 18-29 years are more likely to need cultural and social support.
Areas of Language/Cultural Support Needed for Accessing Health Services1 by Age
70%
Legend ranked by total needs
Cultural and social support
60%
56.3% 56.9%
51.4% Free interpreting services
50% 48.4% Culturally appropriate clinical services
47.3%
Culturally appropriate psychological intervention
42.9% 40.9%
42.6% services
40% 37.1%
38.6%36.5% 37.7% Translated health resources
36.6% 37.2%
33.0% 32.6% 32.3% Ongoing updates on health-related articles via ethnic
30.5% social media (e.g., WeChat)
30%
28.2% 28.3% 26.3% None
26.1% 24.7% 22.2%
20%
21.1%
12.6%
10%
4.1%
3.8%
0%
18-29 years 30-49 years 50-64 years 65 years +
Average number
of areas needed 2.2 2.4 1.9 2.5
Note: 1. Q13 Which area of language and/or cultural support might be needed for you to access New Zealand health services? Please select all that apply.
Base: Total sample
52On average, those living in Hamilton report the highest number of language/cultural support areas needed to access New
Zealand’s health services, closely followed by those living in Auckland. Those living in Auckland are more likely to need culturally
appropriate clinical services whilst those living in Hamilton are more likely to need cultural and social support, culturally
appropriate psychological intervention services, and translated health resources. Those living in Christchurch are more likely to
need cultural and social support.
Areas of Language/Cultural Support Needed for Accessing Health Services1 by Region
70% 67.4%
Legend ranked by total needs
66.4%
Cultural and social support
60%
57.0%
Free interpreting services
50% 48.9% 49.9% Culturally appropriate clinical services
45.3%
43.6% 41.0% 44.9% Culturally appropriate psychological intervention
42.8% services
40% 40.3%
38.8% 35.6% 36.4% 37.9% Translated health resources
35.6%
35.7% 35.2%
33.2% 34.2% Ongoing updates on health-related articles via ethnic
social media (e.g., WeChat)
30% 30.0% 28.5% 29.1%
28.1% 28.5% 28.4% 27.1% 28.0% 28.5% None
23.8% 22.7%
20%
18.5%
16.6%
15.7%
15.0%
13.2% 12.1%
14.2%
10% 9.0% 10.6%
7.0%
2.2%
0%
Auckland Wellington Hamilton Rest of the North Island Christchurch Rest of the South Island
Average number
2.3 1.8 2.4 1.8 2.0 2.1
of areas needed
Note: 1. Q13 Which area of language and/or cultural support might be needed for you to access New Zealand health services? Please select all that apply.
Base: Total sample
53You can also read