E R CORELOGIC NEW ZEALAND MONTHLY PROPERTY MARKET & ECONOMIC UPDATE - JANUARY - FEBRUARY 2017
←
→
Page content transcription
If your browser does not render page correctly, please read the page content below

RT
                P           O
            R E
       L E
   M P
SACORELOGIC NEW ZEALAND
  MONTHLY PROPERTY MARKET
  & ECONOMIC UPDATE
  JANUARY – FEBRUARY 2017
RT
              PO
           RE
       L E
   M P
SA
About CoreLogic                               4
             CoreLogic Data and Analytics             6
             Legal Disclaimer                         7
        Macro Economic and Demographic Indicators     8
             New Zealand Asset Classes                9
             New Zealand Population                   10
             Migration                                11
             Regional Building Consents               12
             Population Growth Compared to Building   13
             Consents

                                             T
             Buyer Confidence                         14

                                            R
             Employment                               15

                                          O
             Interest Rates and Mortgage Debt         16
        Housing Overview                              18

              P
             Values                                   19

            E
             Sales Volumes                            20

           R
             Rent                                     21

         E
             Market Activity                          22

       L
             Valuations Completed                     23

     P
             Listings                                 24
             Buyer Classification                     26

   M
             House Price Index                        27

SA
        Main Cities Housing Market Indicators         30
             Auckland Values                          32
             Current Auckland Suburb Values           33
             Auckland Suburb Value Change             34
             Buyer Classification - Auckland          36
             Hamilton Values                          38
             Buyer Classification - Hamilton          39
             Tauranga Values                          40
             Buyer Classification - Tauranga          41
             Wellington Values                        42
             Buyer Classification - Wellington        43
             Christchurch Values                      44
             Buyer Classification - Christchurch      45
             Dunedin Values                           46
             Buyer Classification - Dunedin           47
About
  CoreLogic
  CoreLogic is a leading property
  information, analytics and services

                                                  T
  provider in the United States, Australia

                                                 R
  and New Zealand. CoreLogic helps clients
  identify and manage growth opportunities,

                                               O
  improve performance and mitigate risk,

              P
  by providing clients with innovative,

            E
  technology-based services and access
  to rich data and analytics.

           R
  Whilst all reasonable effort is made to

         E
  ensure the information in this publication

       L
  is current, CoreLogic does not warrant

     P
  the accuracy, currency or completeness
  of the data – and commentary contained

   M
  in this publication and to the full extent

SA
  not prohibited by law excludes all loss or
  damage arising in connection with the
  data and commentary contained in this
  publication.

  4
RT
              PO
           RE
       L E
   M P
SA

                  5
CoreLogic Data
  and Analytics
  CoreLogic Buyer Classification               The Quarterly CoreLogic House Price Index
                                               has been specifically designed to track

                                                                T
  A unique and flagship product to
  CoreLogic, Buyer Classification determines   the value of a portfolio of properties over

                                                               R
  the type of buyer for every purchase         time and is relied upon by New Zealand
                                               regulators and industry as the most

                                                             O
  of property based on their current and
  previous ownership of NZ property.           accurate measurement of housing market

              P
  Created at a record level, this can be       performance. These value measures are

            E
  matched to other datasets or summarised      available for long time series and for either
                                               standard or custom geographic areas and

           R
  at any geographic area.
                                               property types.
  Our buyer classification is used by

         E
  financial institutions and Government
                                               Suburb scorecard

       L
  agencies at both record and summary
                                               Detailed housing market indicators at

     P
  level and overlaid with their own data to
  assist strategic, policy, compliance, risk   suburb level, with data either in time series

   M
  management and marketing decisions.          or current snapshot, and segmented
                                               across houses, flats and apartments.

SA
                                               The Suburb Scorecard data includes key
  CoreLogic value measures                     housing market metrics such as median
  CoreLogic has a suite of products to         prices, median values, transaction volumes,
  measure property prices. This ranges from    rental statistics and market metrics such as
  simple market measurements such as           median selling time.
  median or average sales prices through
  to stratified medians, various house price
  indices, and valuing groups of properties
  using Automated Valuation Models such
  as E-valuer. The house price indices are
  available both quarterly for completeness
  and monthly for reactivity.

  If you would like to know more or obtain tailored data, analytics and insights for
  your business, please email us at reports@corelogic.co.nz.

  6
Legal
  Disclaimer
  Copyright                                       Data & Research publications

                                                                   T
  © Copyright 2016. CoreLogic NZ Limited          Whilst all reasonable effort is made to
  (CoreLogic) and its licensors are the sole      ensure the information in this publication

                                                                  R
  and exclusive owners of all rights, title and   is current, CoreLogic does not warrant

                                                                O
  interest (including intellectual property       the accuracy, currency or completeness
  rights) subsisting in this publication,         of the Data and commentary contained

              P
  including any data, analytics, statistics       in this publication and to the full extent

            E
  and other information contained in this         not prohibited by law excludes all loss or

           R
  publication (Data). All rights reserved.        damage arising in connection with the
                                                  Data and commentary contained in this

         E
                                                  publication.

       L
                                                  You acknowledge and agree that

     P
                                                  CoreLogic does not provide any
                                                  investment, legal, financial or taxation

   M
                                                  advice as to the suitability of any property
                                                  and this publication should not be relied

SA
                                                  upon in lieu of appropriate professional
                                                  advice.
                                                  Published date: 30 January 2017

  Contact
  Call us 0800 355 355                            Email reports@corelogic.co.nz

  Wellington office                               Auckland office
  Level 2                                         Level 21
  275 Cuba Street                                 151 Queen Street
  PO Box 4072                                     Auckland 1010
  Wellington 6140

  www.corelogic.co.nz

                                                                                     7
Macro Economic and
  Demographic Indicators

                    RT
              P   O
           RE
       L E
   M P
SA

                           8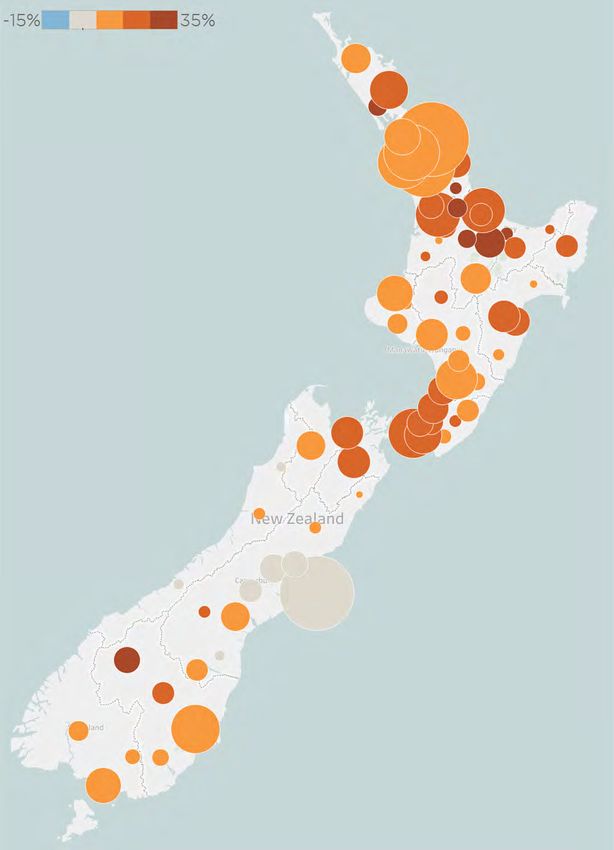
New Zealand
                         Asset Classes

                                                                                            T
The value of                                   Residential Real Estate

                                                                                           R
Residential property
                                               $1.01        trillion

                                                                                         O
continues to grow
beyond one trillion                            ($229 billion in home loans)

                                               P
dollars, dwarfing

                                $161 billion E
the value of other
asset classes.

                                         R
                                               Commercial/Industrial Real Estate
Listed stocks peaked

                                   E
last September,

                                 L
dropped through

                               P
until the US
presidential election

                              M $117 billion
in November, then

                SA
rebounded, but have                            NZ Listed Stocks
been flat for the past
few weeks.

                                               NZ Super and KiwiSaver

                                               $65.7 billion

                         Source: CoreLogic NZ, Reserve Bank of NZ, NZX, NZ Superfund, Financial Markets Authority

                                                                                                               9
New Zealand Population
                                       Quarterly Change in National Population

New Zealand’s
population continues
to grow strongly,
fuelled by continuing
strong net migration.

Auckland’s

                                                                          T
population accounted

                                                                         R
for nearly half of the
national growth over

                                                                       O
the past year, but

                             P
all the other main
centres also saw

                           E
population increases,

                          R
putting pressure on
housing supply.

                      L E
                    P
             Population Change Composition                  Annual Change in Population

                  M
               SA

                                                                         Source: Statistics New Zealand

                         10
Migration
Long Term Migration
Net migration has
continued to surge
away at record
high levels. The
projected slowdown
in mid-2016 failed
to materialise and
T
we are once again
R
seeing record
arrivals combined
O
with comparatively
P
low numbers of
E
departures.
R
Likewise we are
continuing to see
E
a net gain in people
Monthly Net Migration Between New Zealand and Australia
L
from Australia as
P
Kiwis either return
home or are not
M
heading over the
ditch for jobs and
SA
lifestyle in the
numbers they
used to.
While Auckland is
the main beneficiary
of this strong net
migration, there were
also significant gains
in Wellington and
Christchurch over the
past year. Net Gain Last Year % Change
TOTAL ALL AREAS 69,954 14.2%
Auckland Region 32,768 15.4%
Hamilton City 1,581 12.8%
Tauranga City 1,188 33.0%
Wellington 3,114 69.3%
Christchurch City 5,674 -1.0%
Dunedin City 720 21.6%
Main Urban Area (Other) 5,607 144.4%
Rural Centres 4,293 114.6%
Not applicable/Not stated 15,009 101.7%
Source: Statistics New Zealand
11Regional
Building Consents
New Dwelling Consents Trend
The trend for new
building consents in
Auckland continues
to be strongly
positive. It is likely
that once the
December stats come
T
through that they
R
will show building
consents in Auckland
O
to be the strongest
P
since 2004.
E
However bear in
R
mind that it takes
some time for these
E
consents to translate
L
into new dwellings
built.
P
Consent activity
M
is also up across Source: Statistics New Zealand
SA
most of the rest of
the country, with
the exception of
Canterbury.
In order to build enough houses in Auckland to meet current and future demand, the
high level of current activity needs to increase further, then hold for several years. A
shortage of skilled workers, increasing costs, time delays, and quality issues are however
already starting to emerge in the Auckland market, so there are clearly challenges to be
overcome in order to step up the rate of building.
12Population Growth
Compared to Building
Consents
Quarterly Population Change and Building Consents Nationwide
The increase in
building consents
for new dwellings has
meant that the gap
between population
growth and housing
supply may begin to
T
close.
R
The time lag
O
between a consent
P
being issued and
the dwelling being
E
finished means that
R
it still may be many
months or even years
E
before this translates
L
into a physical
closing of the gap.
M P
SA
Source: Statistics New Zealand, MBIE
The above calculation assumes 80% of dwellings consented are completed and will house
the current average number of people (2.7 people per house).
For example, over the year to July 2016 there were 31,185 dwellings consented (able to
house 67,360 people), and an increase in population of 97,300, leaving a difference of
around 30,000 too many people for dwellings.
13Buyer Confidence
ANZ — Roy Morgan Consumer Confidence
Consumer confidence
is still strongly
optimistic. This
positivity not only
reflects views of
the current state,
but also of future
T
expectations.
R
Confidence has risen
O
outside of Auckland
P
on the back of much
stronger dairy prices
E
and strong regional
R
economies. People’s
expectations of
E
house price increases
L
have eased a little.
P
The gap between
New Zealand and
M
Source: ANZ NZ, Roy Morgan
Australian consumer
SA
confidence continues
to widen. This
could be part of the Trans-Tasman Consumer Confidence Index
explanation for the
continued positive
net migration
between Australia
and New Zealand as
people see better
prospects here than
across the Tasman for
the time being.
New Zealand
Australia Source: Westpac NZ, McDermott Miller
14Employment
Annual Change in Employment, Full-time and Part-time
Full and part-time
employment both
remain up on last
year. This along with
an increased labour
force participation
rate and dropping
T
unemployment
R
indicate a healthy
employment
O
landscape.
P
While employment
E
remains strong
R
people can continue
to get and pay
E
home loans and so
L
contribute to a strong
housing market.
P
A significant Labour Force Participation Rate Unemployment Rate
M
weakening of the
SA
labour market would
flow through to
housing, but there is
no sign of that yet.
Source: Statistics New Zealand
15Interest Rates
and Mortgage Debt
Mortgage Interest Rates
Retail mortgage
interest rates are now
past their historic
lows and beginning
to creep upwards as
the cost of offshore
funding increases.
RT
The Official Cash
Rate (OCR) set by
O
the Reserve Bank is
P
unlikely to change in
the medium term, so
E
it will be this offshore
R
funding alone
pushing up rates. As
E
a result mortgage
L
interest rates look
set to remain low for
P
some time yet.
Projected Official Cash Rate Debt Level and Serviceability
M
These low interest
SA
rates continue to
make the record high
level total household
debt manageable, a
situation only likely
to change when
interest rates rise
significantly. That
would appear to
be some years off
yet under current
expected global
financial conditions. Source: Reserve Bank of New Zealand
16RT
PO
RE
L E
M P
SA
17Housing Overview
RT
P O
RE
L E
M P
SA
18Values
Average Value of Housing Stock - New Zealand
Nationwide values
are still increasing
according to the
latest monthly QV
house price index.
The rate of quarterly
growth has slowed
T
to only 1.3% but
R
the annual rate of
increase holds
O
steady at 12%.
P
The previous round
E
of LVR restrictions in
R
October 2015 saw a
similar slowdown in
E
value increases,
but they were
L
very short-lived.
P
That remains our
expectation with the
M
latest restrictions
SA
that came into force
late last year, and Annual and Quarterly Change in Value
while values may
drop a little further
in coming months
they will likely begin
to increase again by
mid-year.
19Sales Volumes
Nationwide Sales Volumes
Sales volumes
dropped throughout
most of 2016, and
by mid-year had
begun to drop below
the same month a
year earlier. This
downward trend in
T
sales volumes was
R
already well in play
by the time the latest
O
restrictions kicked in.
P
The previously hot
E
markets of Hamilton
R
and Tauranga saw
the biggest annual
E
drop in sales activity,
L
while Auckland and
Wellington had a
P
more modest drop.
M
Christchurch and
SA
Dunedin were more
or less steady year
on year.
Nationwide Annual Change Regional Sales Volumes
in Sales Volumes Year-on-Year
20Rent
National Annual Change in Value and Rent
While the pace of
value increase has
slowed, the rate
of rent increases
has gradually been
picking up. This
could be landlords
seeking to offset
T
the increased cost
R
of lending from
the latest round of
O
restrictions imposed
P
by the Reserve Bank.
E
As a result of the
R
increasing rents,
nationwide gross
E
yield has been flat for
L
the past few months,
a change from the
P
decline in yields
M
which began in 2011.
SA
All the main centres
have lower yields
than this time
last year as value Gross Rental Yield - National Gross Rental Yield - Main Centres
increases have still
outstripped rent
increases.
Source: MBIE, CoreLogic NZ
21Market Activity
Market Activity Relative to pre-Christmas 2015
There has been a
significant decline
in market activity
in Auckland since
November. The first
few weeks of the New
Year have been well
T
below the same time
R
last year.
O
This suggests that
P
the latest round of
lending restrictions
E
are particularly
R
impacting Auckland
buyers. The rest
E
of the country has
L
rebounded to
pre-Christmas levels,
P
but this does vary
M
in places.
SA Latest 3 Weeks Year-on-Year
Auckland 82%
Hamilton City 88%
Tauranga City 88%
Wellington Region 106%
Christchurch City 88%
Dunedin City 124%
This market activity is based on the number of automated valuations run by bank staff
using our systems each week. This number of valuations correlates very closely to the
number of sales that will subsequently occur so this is an extremely timely measure
of buyer demand, more than any measure of sales. We can also track across any
geographic area.
22Valuations Completed
Market Activity
This map shows
activity in the
latest three weeks
compared to the
same three weeks
last year.
T
Compared to a year
ago activity is down
R
in Auckland, steady
O
in the middle of the
North Island, and up
P
year on year in the
E
lower part.
R
In the South Island
activity is steady in
E
many areas, but up in
L
Marlborough, Nelson,
P
and much of Otago
and Southland.
M
SA
* Size of bubble represents the level of activity
23
for the period 2 January 2017 - 22 January 2017Listings
New Listings
New listings have
begun to pick up
again after the
Christmas break.
It is still too early to
get a decent read
T
on how the year has
R
started, but in both
Auckland and the
O
rest of the country
P
the number of new
listings appears to be
E
at expected levels.
E R
P L
M
SA New Listings Average last 3 weeks 1 month change 1 year change
New Zealand 1,370 -18% -5%
Auckland 400 -16% -4%
Waikato 147 -14% 12%
Bay of Plenty 108 -29% -8%
Wellington 144 25% -6%
Canterbury 202 -22% -12%
Otago 50 -35% -23%
24Total Listings
The total number
of listings typically
drops away at this
time of year as the
sales activity that
carries on over
December and
T
January outstrips
R
the number of new
listings coming to
O
market.
P
From about late
E
January onwards
R
the total number of
listings begins to pick
E
up again with the
L
seasonal surge in new
listings.
The total number of
listings in Auckland
M P
SA
is similar to last year.
But that is no good
thing as total listings
have been low for
several years in
Auckland, making it
tough for buyers.
Total Listings Latest week 1 month change 1 year change
Across the rest of the
New Zealand 25,848 -9% -16%
country total listings
continue to drop Auckland 6,680 -15% 11%
because there have Waikato 2,614 -6% -20%
been more sales than
Bay of Plenty 1,835 -5% -3%
new listings.
Wellington 1,476 -12% -31%
Canterbury 4,297 -7% -11%
Otago 1,025 -8% -41%
25Buyer Classification
Buyer Classification - New Zealand
The data for Q4 is
now complete and
we are beginning to
see the first signs of a
weakening in investor
activity in response
to the latest lending
T
restrictions.
R
Mover activity
O
continues to be under
P
par, while first home
buyers are now back
E
at the same level
R
they were before the
first round of LVR
E
restrictions came in
L
to force in late 2013.
M P
SA
26House Price Index
Average Dwelling Value
Values in Auckland
dropped in
December, as
they did briefly in
response to previous
lending restrictions.
T
Hamilton has also
R
levelled off, and
the latest data we
O
have suggests that
P
Tauranga is doing
likewise.
RE
That is a big change
from the rapid
E
growth both of those
L
cities experienced
last year. The rate
P
of growth has also
slowed in Wellington,
M
but in Dunedin the
SA
steady increases in
value seem to be
continuing.
December 2016
Current Value 3 months 12 months Since Peak
New Zealand $627,905 1.3% 12% 52%
Auckland $1,047,179 1.5% 12% 92%
Hamilton $534,860 1.1% 20% 48%
Tauranga $672,197 4.3% 24% 40%
Wellington $574,410 3.9% 21% 26%
Christchurch $494,247 -0.3% 3% 30%
Dunedin $354,133 4.4% 15% 24%
Source: CoreLogic NZ QV Monthly House price index
27House Price Index
Annual Value Change
Over the past year
values have been
increasing in almost
every town and city,
the notable exception
being Canterbury.
There was
T
particularly strong
R
growth in the
areas surrounding
O
Auckland, the lower
P
North Island, and in
E
Queenstown Lakes
District.
E R
P L
M
SA
*Size of bubble represents the number of properties in the Territorial Authority
28Three Month Value Change
The three month
change in values
begins to show a
patchier picture.
Parts of Auckland are
no longer increasing,
along with Hamilton
and parts of the
T
central North Island.
R
For the time being
O
there is continuing
P
strength in most
E
other areas but
we expect that
R
to moderate over
the next couple of
E
months.
P L
M
SA
*Size of bubble represents the number of properties in the Territorial Authority
29Main Cities Housing
Market Indicators
RT
P O
RE
L E
M P
SA
30RT
PO
RE
L E
M P
SA
31Auckland Values
Average Value of Housing Stock - Auckland
The house price
index for December
dropped from
November, and as a
result the change in
values over the past
three and twelve
months has slowed
considerably across
T
Auckland.
R
The previous round
of LVR restrictions
O
in October 2015
P
targeted at Auckland
E
caused a short term
drop in values and
R
we expect that over
the coming months
E
Annual and Quarterly Value Change - Auckland
values will continue
L
to drop.
P
Beyond that the
M
upward forces of
low interest rates,
SA
high migration and
a housing shortage
are likely to once
again see values in
Auckland begin to
rise from mid-year,
although at a more
modest pace than
we have seen in
recent years.
December 2016
Current Value 3 months 12 months Since Peak
Rodney $929,162 3.8% 14% 58%
North Shore $1,218,254 0.9% 12% 89%
Waitakere $840,639 2.0% 12% 98%
Auckland City $1,218,979 2.0% 11% 96%
Manukau $904,516 1.0% 14% 98%
Papakura $681,953 2.1% 13% 90%
Franklin $659,906 4.9% 14% 67%
32Current Auckland
Suburb Values
Median Value of Housing Stock
As a result of
increasing values
there are now no
suburbs in Auckland
where the average
value is less than
$500k.
20 km
These may briefly
T
return if values
continue to drop 10 km
R
in Auckland. 104
O
Auckland suburbs
have an average
P
value of over $1m.
RE
L E
M P
SA
*Based on CoreLogic Median E-valuer
33Auckland Suburb
Value Change
Three Month Value Change
While all Auckland
suburbs are showing
an increase in
value over the past
year, the fastest
percentage growth
has been across
Manukau and in
the CBD apartment
T
market.
O R
E P
E R
P L
M
SA
*Size of bubble represents the number of properties in the suburb. Based on CoreLogic Median E-valuer
34RT
PO
RE
L E
M P
SA
35Buyer Classification - Auckland
Auckland investor
activity has begun to
tail off in response
to the latest lending
restrictions.
First home buyers
picked up in Q4 after
gradually sliding
during 2016 and are
T
now nearly back at
R
the same level they
were before the
O
first round of LVR
P
restrictions were
E
imposed in 2013.
E R
P L
M
SA
36RT
PO
RE
L E
M P
SA
37Hamilton Values
Average Value of Housing Stock - Hamilton
There has been
a significant
turnaround in value
increases in Hamilton.
From increasing at
30% year on year
during 2016, the
house price index
for December shows
T
values dropping
slightly.
R
The slowdown is
O
particularly evident in
P
the Central and North
E
West of Hamilton
where quarterly
R
growth has now
dropped to under 1%.
E
Annual and Quarterly Change in Value - Hamilton
P L
M
SA
December 2016
Current Value 3 months 12 months Since Peak
Hamilton Central
$499,701 0.9% 20% 40%
& North West
Hamilton North East $681,272 0.6% 21% 52%
Hamilton South East $484,566 1.4% 19% 39%
Hamilton South West $467,435 1.2% 19% 37%
38Buyer Classification - Hamilton
There has been a
change in mix of the
type of investors
active in the Hamilton
market.
The latest quarter
has seen a significant
drop in activity from
T
Auckland based
investors. That slack
R
has been picked up
O
by local investors
P
who were missing
out during the time
E
the Aucklanders were
R
most active.
E
First home buyers
and movers don’t
L
appear to have
P
been impacted by
the latest lending
M
restrictions.
SA
39Tauranga Values
Average Value of Housing Stock - Tauranga
The latest house
price index appears
to show values in
Tauranga continuing
to rise at the same
pace. However other
measures of value
we have suggest
that values have
T
begun to flatten so
R
we would expect the
house price index to
O
reflect that in coming
P
months.
RE
L E
Annual and Quarterly Change in Value - Tauranga
M P
SA
40Buyer Classification - Tauranga
The most significant
change in the mix of
buyers in Tauranga
has been the
continued increase of
activity by Auckland
investors. They now
make up 10% of the
activity there.
RT
P O
RE
L E
M P
SA
41Wellington Values
Average Value of Housing Stock - Wellington
The rapid increase
in Wellington values
during 2016 has
eased off in recent
months, with the
quarterly increase
slowing to less
than 4%.
T
Porirua and Upper
Hutt both increased
R
by more than 5% over
O
the three months,
P
while Lower Hutt was
just under 4%.
RE
L E Annual and Quarterly Change in Value - Wellington
M P
SA
December 2016
Current Value 3 months 12 months Since Peak
Porirua $477,692 5.4% 20% 25%
Upper Hutt $422,596 5.2% 22% 20%
Lower Hutt $470,907 3.9% 21% 20%
Wellington City $693,842 4.8% 22% 30%
42Buyer Classification - Wellington
There was a distinct
drop in investor
activity in Q4 after
a flurry of activity
in Q3, potentially
in advance of new
lending restrictions
on investors.
T
Meanwhile first home
R
buyer activity has
O
surged to record high
levels at 30% of all
P
sales. Movers are still
E
less active than usual,
with those lending
R
restrictions making
E
it harder for people
to upgrade.
P L
M
SA
43Christchurch Values
Average Value of Housing Stock - Christchurch
Values have been
increasing at only 2%
to 3% per year during
much of 2015 and
2016, but sped up
to nearer 5% in late
2016. In December
the house price index
dropped slightly
T
in what may be a
response to the latest
R
lending restrictions.
O
The Christchurch
P
Hills area dropped
E
significantly in
R
the previous three
months, while the
E
southwest area
picked up a little. Annual and Quarterly Change in Value - Christchurch
P L
M
SA
December 2016
Current Value 3 months 12 months Since Peak
Banks Peninsula $513,275 -0.1% 5% 7%
Christchurch Hills $656,669 -3.5% 0% 19%
Christchurch Central &
$585,705 0.2% 3% 32%
North
Christchurch East $368,548 -1.6% 1% 19%
Christchurch Southwest $474,260 1.3% 4% 40%
44Buyer Classification - Christchurch
There was some
volatility in the share
of buyers throughout
2016 but the year
ended with investors
bouncing up to
39%, mostly at the
expense of movers.
T
First home buyers did
dip slightly at the end
R
of the year but their
O
share of sales is still
back at 2013 levels
P
having recovered
E
from the drop caused
R
by the introduction of
the first round
E
of LVR restrictions.
P L
M
SA
45Dunedin Values
Average Value of Housing Stock - Dunedin
Unlike the other main
centres there is no
sign of a slowdown
in value increases in
Dunedin. In contrast
the latest house price
index has ticked
upwards. As a result
the quarterly and
T
annual increase in
R
values has also risen.
O
Taieri and Dunedin
P
South appear to be
leading the charge.
RE
L E Annual and Quarterly Change in Value - Dunedin
M P
SA
December 2016
Current Value 3 months 12 months Since Peak
Dunedin Central & North $368,259 3.4% 13% 22%
Dunedin South $338,291 4.4% 16% 18%
Peninsula & Coastal $308,938 1.4% 11% 14%
Taieri $371,192 6.6% 16% 26%
46Buyer Classification - Dunedin
While investor
activity bounced
back up at the end
of the year, there
was a much more
significant increase in
the share of sales to
first home buyers.
T
First home buyers
are now the most
R
active they have
O
been since at least
P
2005, apparently
not put off through
E
lack of confidence or
R
lending restrictions
that might be hurting
E
other buyer groups.
P L
M
SA
First home buyers have maintained their share, while movers have dropped dramatically.
Auckland multiple property owners remain an increased, but relatively small presence in
the market.
47RT
P O
RE
L E
M P
SA
© CoreLogic, 2016. Except as provided by the Copyright Act 1994, no part of this publication may be reproduced or stored in
a retrieval system in any form or by any means without the prior written permission of the copyright owner. CoreLogic and the
CoreLogic logo are trade marks of CoreLogic Solutions LLC and are registered trade marks in various countries including New
Zealand and Australia. All solution names in this publication are trade marks or registered trade marks of CoreLogic Solutions
LLC or are used with the permission of their respective owners.You can also read