Appraisal Valuation Report
←
→
Page content transcription
If your browser does not render page correctly, please read the page content below
Appraisal Valuation Report

                                                                                 2020
                                                                          Kathy K. Briney, RMA – County Appraiser
                                                                                   (Information as of February 21, 2020)

NOTE: This report does not contain value specific figures, as the Wyandotte County values and classifications are not final until they are certified on June 1, 2020, after informal processes are complete.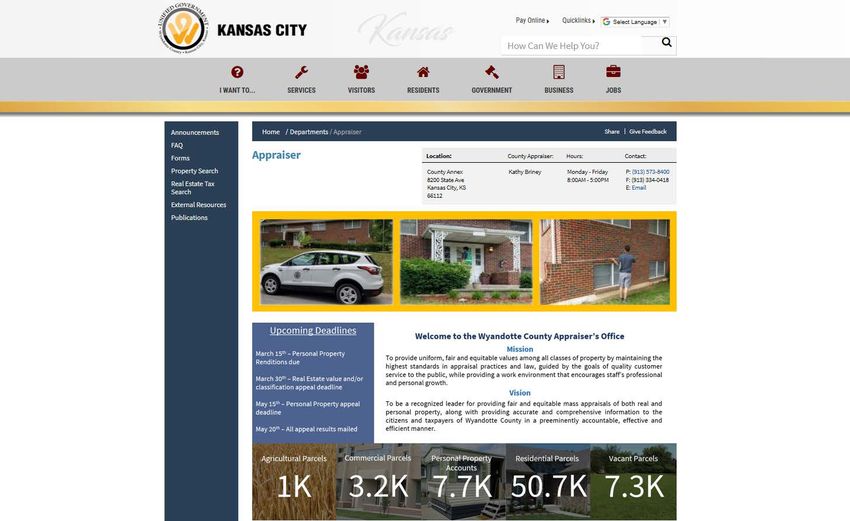
2

     General Facts…

01
        Appraiser’s Office Duties
        Discover, list & value both real & personal property for ad valorem tax purposes

02
        Annual Processes & Phases of Valuation
        Property must be reviewed & valued annually, with an appraisal effective date of January 1

03
        Oversight Agency - Procedural & Statistical Compliance
        Kansas Department of Revenue, Property Valuation Division (PVD)

04
        Orion – CAMA (Computer Assisted Mass Appraisal System)
        State mandated real estate mass appraisal system is utilized by all 105 Kansas Counties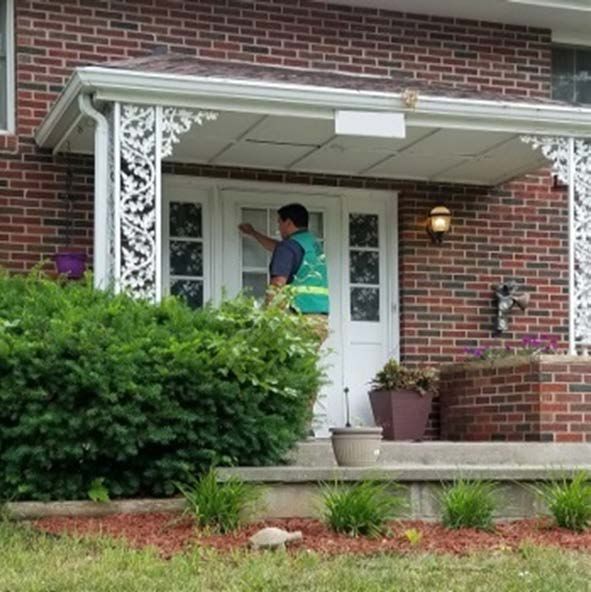
3

              Note of Value

    An important thing to remember…

       Appraisers do not create value.

       People actually determine value by their
       transactions in the market place.

       The Appraiser simply has the legal responsibility to
       analyze those transactions and appraise properties
       based upon what is happening in the market place.

3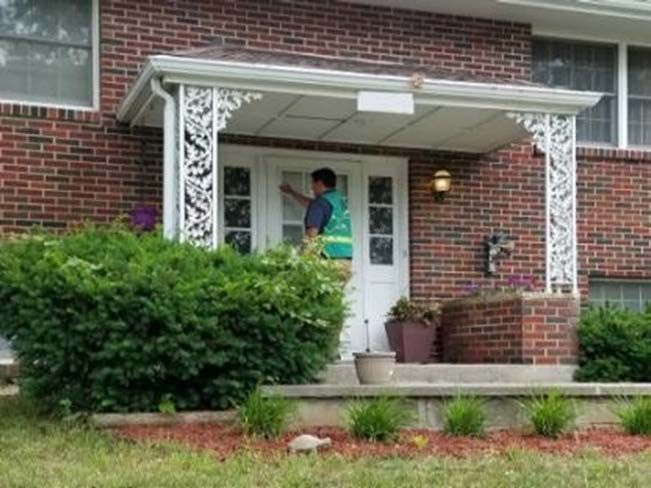
Appraisal Milestones                                                                                                                                                              4

 Accomplishments / Projects in preparation for 2020 values

                                  01           Parcel Re-inspections* reported to PVD
                                               In 2019, 16,246 re-inspections were conducted

                                  02
                                               Agricultural Land Use Classification Project
                                               Ag land was reviewed & changed (if deemed necessary)

                                  03
                                               Commercial Capitalization Rate Study
                                               Apartments, Office, Retail, Industrial & Hotel/Motel

                                  04           Enhanced Customer Service**
                                               2020 will be first year for ‘On-line Appeal Filing’

                                  05
                                               Appraisal Designations & Skilled Based Valuer***
                                               Numerous Appraisal staff received recognition

*The Appraiser’s Office is required to re-inspect 100% of the parcels in the county once every six years, which is approximately 17% or at least 11,700 annually.
**This on-line appeal option will be available on the County Appraiser’s web-site for the 2020 Informal hearings. See slide 8 for current online submission options.
***Six (6) Appraisers moved through Skilled Based Valuer, 1 & 2 year plans; three (3) staff have received the RES (Residential Evaluation Specialist) designation through IAAO.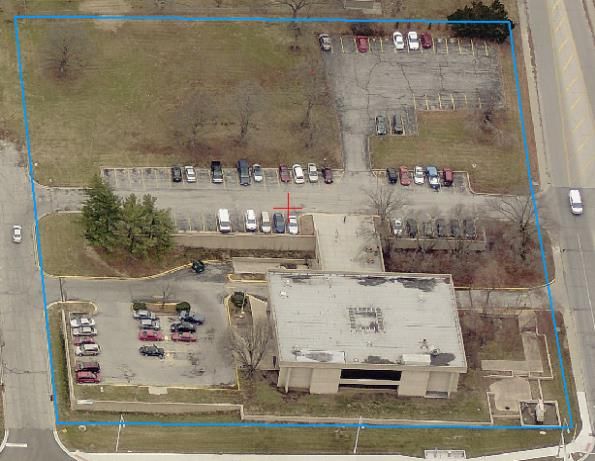
Real Estate Appraisal Notice                                                                                                      5

   Timeline
                               Annual Appraisal
                                Notice mailed

                                                                                                  Real Estate values are certified
                                                                                                        to the County Clerk

January 1
                                February 28
Effective date of
    appraisal
                                                                      March 30
                                                               Deadline to file an informal
All property must
                                                               appeal from the appraisal
be reviewed and
                                                                         notice
 valued annually

                        May 15*                                                                           June 1
                        Last day to hold informal appeal
                        hearings

     * The Appraiser’s Office then has until May 20 to mail all Informal appeal result letters.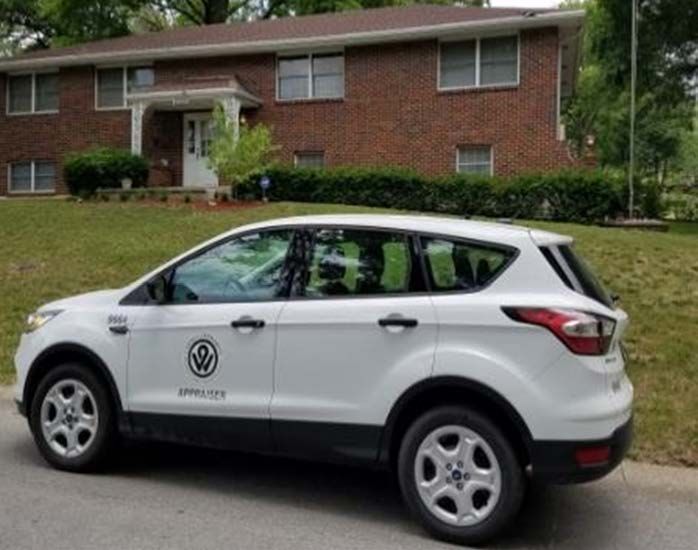
Real Estate Informal Appeal Options                                                                                                 6

Only one Informal appeal per taxpayer per tax year

                                 Annual Valuation Notice
                                      Filing deadline is 30-days
                                           from the notice date

                                                                   A

       Payment Under Protest         1st Half
              Once the tax bill has been sent,
                                                    B                  C   Payment Under Protest 2nd Half
                                                                           2nd half tax bills are due May 10th. Although there is
         the appeal deadline is December 20                                no appeal deadline, taxes must be due to file and all
    (January 31 if paid by mortgage company)                               payments MUST accompany the PUP application
                                                                           regardless of who is actually paying the tax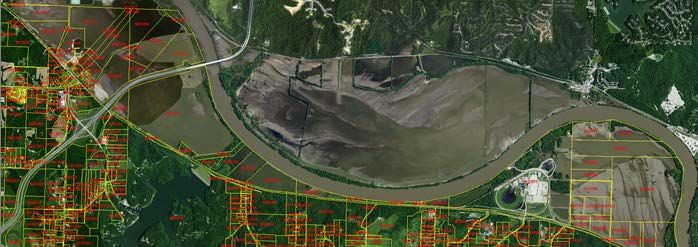
Digital Services                                                                                                                  7

                New online submission forms

                       Property Change Form            Agricultural Use Form           Online Appeal Form              Evidentiary Appeal

                                                           Annual Ag Use
                              Residential                                               3 Ways to file online             New for 2020
                                                            Verification
                                                         Property owners may                                          An Evidentiary appeal is
                          Property owners may           request or confirm the                                      based upon evidence only,
                          update their property        Agricultural Use on their        Informal appeals form         such as Fee Appraisals,
                       information and/or submit       property. They may also        may be submitted online       repair estimates, photos of
                       documentation and photos       submit documentation and        by appeal type to request:        damages, income &
                       without needing to come in     photos without needing to               In Person                expense information.
                          or contact our office.        come in or contact our
                                                                                               Phone                    This appeal can be
                                                                office.
                        All forms are reviewed by                                                                    submitted online or a hard
                                                                                         Evidentiary Appeal            copy delivered to our
                              appraisal staff.         All forms are reviewed by
                                                             appraisal staff.                                                 office.

                                     Note: These digital services allow property owners to fill out and submit on their own time.
Data Source: CIC-TAS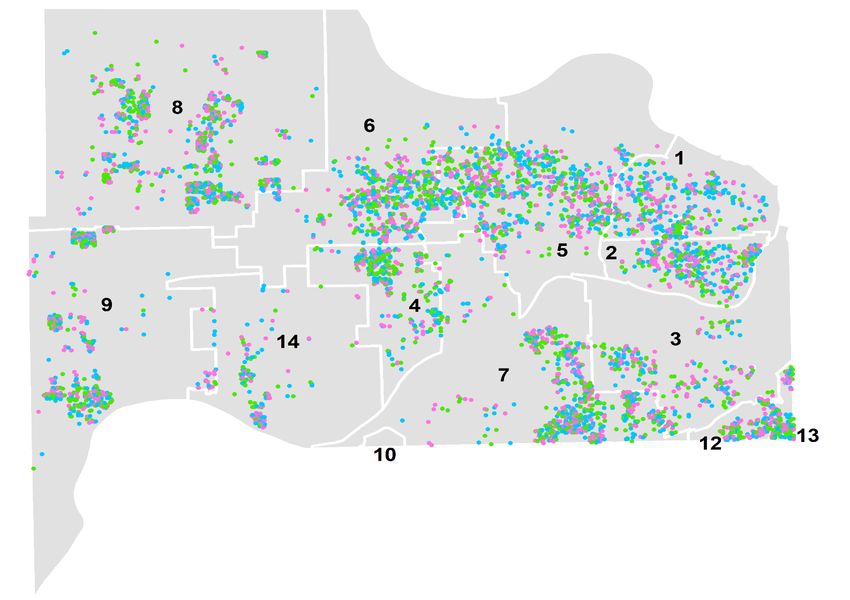
Parcel Totals by Classification                                                        8

                 Parcel Counts
                                       O   Other
                                           Assessed at 25%

                                       N   Not For Profit
                                           Assessed at 12%

                                   F/A     Farmstead/Agricultural
                                           Farmstead Assessed at 11.5%, Agricultural Assessed at 30%

                                       C   Commercial
                                           Assessed at 25%

                                       E   Exempt (Exempt, IRB, EDX, Land Bank*)
                                           Assessed at 0%

                                       V   Vacant Land
                                           Assessed at 12%

                                       R   Residential
                                           Assessed at 11.5%

                                                             Total Parcel Count: 67,855
*Exempt Land Bank Parcel Count 3,830
Data Source: Orion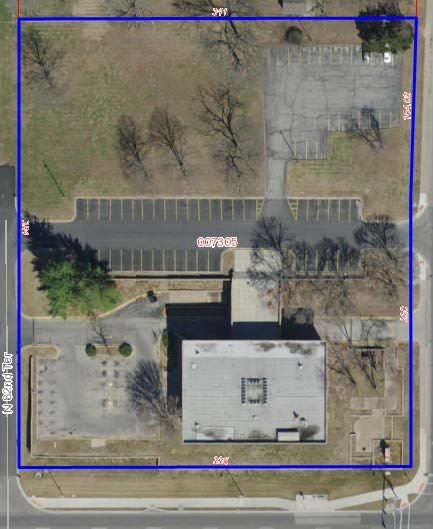
Why would a Value change from last year?                                                                                                                     9

 Several things to keep in mind…

                             Re-inspections                                    ‘Index’ Indications                                   Sale of Subject
                             Many changes have                                   Prior year values are                              Recent sale or recent
                           occurred to parcel data                             compared to sales prices                            physical changes after
                            due to re-inspections                                 in neighborhoods.                                 last sale of property.

Real Estate Market                                      Data Changes                                            Permits
    The market has                                   Information from other                                 New construction,
continued to be positive                               sources, MLS or field                              remodeling, additions,
  in many areas and                                         inspection                                      decks, demos, etc.
    neighborhoods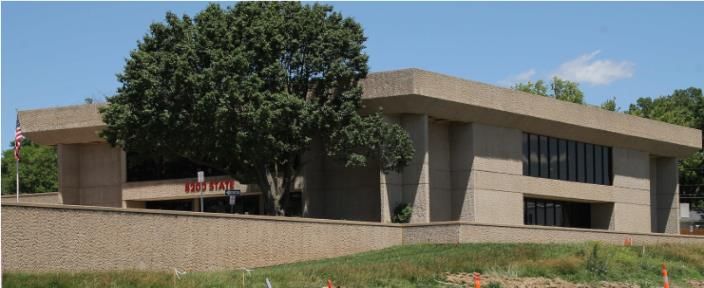
MLS - Home Sales Market Comparison                                                                                                                10

                Heartland MLS Stats - Comparing December 2018 to December 2019
                                                                                    December                                     Year to Date
                    Key Metrics                                    2018                 2019    % Change         Thru 12-2018    Thru 12-2019        % Change
                    Closed Sales                                    116                 129      +11.2%                1,786        1,876              +5.0%
                    Average Sales Price*                          $161,218           $168,673    + 4.6%               $147,888     $154,699            + 4.6%
                    Median Sales Price*                           $142,000           $154,500    + 8.8%               $133,000     $140,000            + 5.3%
                    Days on Market Until Sale                       49                   37      -24.5%                 45           38                - 15.6%
                    Percentage of Original List Price
                                                                   96.4%               96.3%     - 0.1%                96.7%        96.8%              + 0.1%
                    Received*
                    Pending Sales                                   107                 100      -6.5%                 1,786        1,903              +6.6%
                    Inventory                                       346                 283      -18.2%                  --           --                 --
                    Supply                                          2.3                  1.8     -21.7%                  --           --                 --
                    December
                                                            129      $161,218 $166,673                                                2.3
                                                116                                                  346
                                                                                                                 283                             1.8

                       2018
                       2019
                       %

                                                  Closed Sales            Avg. Sales Price                Inventory                         Supply
                                                     +11.2%                     +4.6%                      -18.2%                          -21.70%

Data Source: Kansas City Regional Association of REALTORS
ZILLOW Home Sales Market Comparison 11
Zillow & Realtor.com stats as of December 2019
realtor.com
The median list price of homes in
Wyandotte County, KS was $142,250
in December 2019, trending up 4.2%
year-over-year.
5.5% 4.0%
Wyandotte 3.7%
County Kansas United
States
Wyandotte County Kansas United States
ZILLOW ZILLOW ZILLOW
Median Home Value: $118,324 Median Home Value: $151,212 Median Home Value: $225,300
Zillow predicts 4.8% rise within the next year Zillow predicts 2.8% rise within the next year Zillow predicts 2.8% rise within the next year
Median Price per Square Foot: $112 Median Price per Square Foot: $121 Median Price per Square Foot: $153
Median Current List Price: $131,000 Median Current List Price: $184,900 Median Current List Price: $282,000
Data Source: www.zillow.com/home-values/ & realtor.com/researchHousing Market - Center for Real Estate 12
2019 & 2020 - Kansas Housing Markets Forecast Info
Home Prices Rise in Response to Limited Inventory
As inventories continue to decline, the competition is intense for the few homes that are on the
market. Bidding wars are common. As a result, home prices across the state continue to rise at
a healthy clip.
Many buyers are showing a willingness to look at “fixer-upper” homes that they might have
passed over if other options had been available. As a result, home price appreciation continues
to accelerate in Kansas City area.
New home construction in Kansas (overall) has dropped further this year as rising construction
costs make it difficult to build the entry-level new homes that are most in demand.
While it may be a sellers’ market for modestly priced homes, it’s a different story for homes in
the upper end of the market… not unusual for these homes to take longer to sell.
Data Source: Kansas Housing Markets Forecast / Center for Real Estate, Wichita State UniversitySingle Family Home Price Comparison 13
Valid Single Family Home Sale Price Ranges Between 2017 and 2019
The median list price of homes in
500 476 2017 2018 2019
Wyandotte County, KS was $142,250
445 446 in December 2019, trending up 4.2%
450
year-over-year.
400
366
339
350 321
295 295
300 273 277 275
Number of Sales
247
250
200 177 183 170
150
109
100 84 93
50 23 22
11
0
$0-$50k $50k-$100k $100k-$150k $150k-$200k $200k-$300k $300k-$400k $400k+
Sale Price Ranges
Data Source: OrionValid Residential Improved Sales Map by Model 14
Sale Years 2017 - 2019
Residential Model Areas
Model 1 (Northeast)
Model 2 (Downtown Central)
Model 3 (Argentine Armourdale)
Model 4 (Stony Point)
Model 5 (Bethel Welborn)
Model 6 (Victory Nearman)
Model 7 (Turner)
Model 8 (Piper)
Model 9 (Bonner Springs)
Model 10 (Lake Quivira)
Model 11 (Multifamily Countywide)*
Model 12 (KU Med)
Model 13 (Condo)
Model 14 (Edwardsville)
*Not Depicted on Map
Data Source: OrionValid Single Family Sales 15
Average & Median
180,000 140
160,000
120
140,000
100
120,000
2.1% 100,000 80
Average
80,000 60
60,000
40
40,000
20
20,000
2.9% 0 0
Median 2013 2014 2015 2016 2017 2018 2019
Avg. SP Median SP Median Spsf
2013 2014 2015 2016 2017 2018 2019
Sale Count 765 941 1,062 1,383 1603 1638 1684
Average Sale Price $128,743 $127,620 $130,581 $145,138 $144,280 $152,021 $155,210
Median Sale Price $110,000 $115,000 $115,000 $130,000 $127,500 $136,000 $140,000
Data Source: Orion data is for ‘stand-alone’ single family dwellings & includes new home sales16
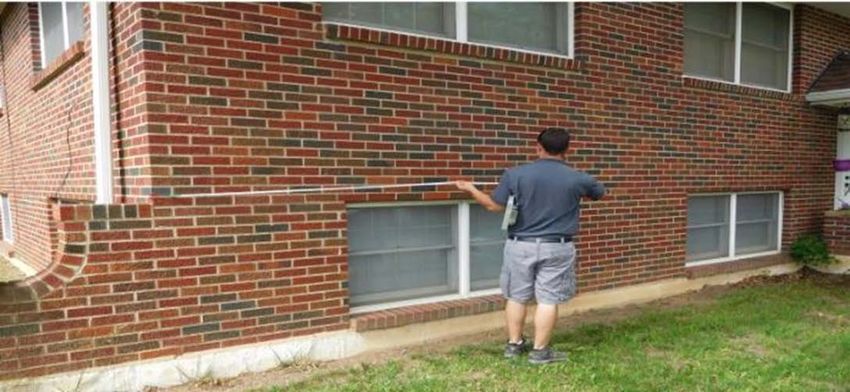
Parcel Maintenance Inspections
Parcel Maintenance Inspections:
The Appraiser’s Office is required by Kansas Department of Revenue’s, Property Valuation Division (PVD) to annually
re-inspect approximately 17% of the County’s parcels, which equates to approximately 11,7000 parcels to be
inspected per year. Procedural Compliance, which is under Maintenance Specifications 12.1, requires that 100% of
the parcels are to be viewed & inspected every six (6) years.
On-site Visits:
Appraisal personnel will be driving vehicles identified with the Wyandotte County Appraiser’s Office logo and may
be working in teams. The employees will have a personal UG identification badge. They will check the listings,
measurements and characteristics of all buildings on each property. Listings of vacant land are also reviewed. They
will interview the property owner or resident, if available. If no one is home, a yellow questionnaire card will be left
pertaining to information about the house. If you find one of these cards left on your door, please answer the
questions and return it to the County Appraiser’s Office.
Other Inspections:
In addition to parcel maintenance inspections, other routine work is performed, such as the review of recent sale
properties, parcels having new construction, torn down or destroyed buildings, as well as neighborhood reviews
throughout the entire county.
16Imagery/Photography Assists Staff
17
Ortho Photography
Images are aerial photographs taken straight down. The imagery is used as a base map for many applications in the
county, including the Agricultural use layer maintained in the Appraiser’s Office and GSS Mapping.
Oblique Photography (Pictometry)
Aerial photographs that are taken at 45 degree angles from four
different directions. This enables an appraiser to “walk around”
and measure features without leaving the office. These images
increase the productivity of the County Appraiser’s Office by
expanding the volume of parcels reviewed, which allows for
meeting of the State of Kansas requirements for annual field
Property Images of: inspections.
UG/WyCo Annex
8200 State Avenue
Kansas City, KS
Front Elevation Photography
Is high-resolution street level photos of the exterior of every property in the county. The
images are utilized to create land record information which assists County staff throughout
the appraisal process. Most importantly, these images are used in the State mandated Final
Review process. These images should be updated every six years.
Increases Productivity: Together, these three image formats increase the productivity of the County Appraiser’s Office by expanding the
volume of parcels that can be reviewed by each appraiser on a daily basis.New Construction Issued R C
18
Includes all jurisdictions 350
44
300 31
Residential
Includes new construction
permits of structures located
250
within a Residential
neighborhood
34 28
200 43
Commercial 30 23
Includes new construction
permits of structures located 150 301
within a Commercial 276
neighborhood, including
Apartments 100 189 192
162 172 176
NOTE: In 2017, the permit fees were waived for
new construction, which may have caused spike 50
in overall 2017 permit counts.
From 2018 to 2019, the new construction building 0
permits have remained steady overall.
2013 2014 2015 2016 2017 2018 2019
Data Source: OrionBuilding Permits R C
19
Includes all jurisdictions 2,500
2.8%
552
347
2,000 353 435
Residential 393
Includes all permit types on
file with Appraiser’s Office 303 297
1,500
8.3% increase from 2018
Commercial 1,000 1,948 1,931
Includes all permit types on 1,616 1,807 1,782
file with Appraiser’s Office
1,380 1,343
20% decline from 2018
500
0
Overall 2.8% increase in permits from 2018 to 2019
2013 2014 2015 2016 2017 2018 2019
Data Source: OrionResidential Model Areas 20
Breakdown of a Model
Models
Models are geographic areas of the
Model County that have similar property
and economic characteristics
There are 14 Model areas throughout
Neighborhood the County
Group
Only Valid Sales are utilized in
Neighborhood Sales Comparison Approach
• Sales must be arms-length sales
that occur between a willing buyer
Subdivision and willing seller
• ‘Bank’ sales, foreclosures & ‘short’
sales are analyzed but not used in
the valuation process
Subject
Note: Only sales within Wyandotte County are utilized in the County’s Sales Comparison Approach. with exception to Lake Quivira.Residential Median Value % Change Map for 2020 21
Median Value Change % by Model Area
10%+ Median Value Change
Model 13 (Condo) 16.0%
Model 2 (Downtown Central) 13.4%
Model 1 (Northeast) 11.8%
Model 5 (Bethel Welborn) 11.0%
Model 12 (KU Med) 10.6%
5-10% Median Value Change
Model 4 (Stony Point) 9.0%
Model 6 (Victory Nearman) 8.0%
Model 7 (Turner) 8.0%
Model 3 (Argentine Armourdale) 7.0%
Model 9 (Bonner Springs) 5.0%
Model 14 (Edwardsville) 5.0%
1-4% Median Value Change
Model 8 (Piper) 2.0%
10 Model 11 (Multifamily Countywide) 2.0%
Not Mapped Model 10 (Lake Quivira) 1.7%
Model 11 – Multifamily
Model 13 - Condo
Residential Division
Median Overall Value Change: 7% (includes all Classifications)
Improved Residential Classification Median Overall Value Change: 8%
Data Source: OrionCommercial Median Value % Change 22
Major Commercial Sub Types (Does not include new construction)
Apartment
Up 4.9%
Retail
Up 4.3%
Commercial Division
Median Overall
Value Change 4.6%
(includes all Classifications
Downtown Row Office less new construction)
Up 2.5% Up 2.8%
Industrial/Warehouse
Manufactured Home Park Up 5.7%
Up 5.4%
Data Source: OrionReal Estate Parcel Values 23
Going Up, Down, or No Change
No Change:
9%
Commercial
Going Down: Going Up: 78%
11%
Going Up:
80%
Residential
No Change: 6%
Going Down: 16%
Data Source: OrionAgricultural Land 24
“Use Value” is utilized when valuing agricultural land in Kansas – not Market Value
2020 Adjustment to Ag Land due to 2019 Missouri River Flooding
Ag Land Facts:
• Use values are based on productivity, not
market value from sales prices
Property Valuation Division made downward adjustments to agricultural
• The Kansas Department of Revenue, Property use properties in the counties of Atchison, Leavenworth, Doniphan and
Valuation Division provides Kansas counties Wyandotte for the 2020 valuation year on agricultural land affected by the
with the $ per acre, which is based on soil 2019 Missouri River flooding.
type
As a result, the total reduction in appraised value is nearly $700K (or $210K in
• The County is responsible for type of assessed valuation) on the affected parcels in Wyandotte County.
agricultural land listed on each parcel
Ag land use values declined overall in Wyandotte County.
Data Source: Orion2020 Real Estate ‘Taxable’ Assessed Valuation 25
Tax Burden Breakdown
Other, 0.0% Vacant, 1.0%
Farmstead, 0.9%
Agricultural,
0.2%
Residential, Commercial,
51.7% 46.0%
Not For Profit
Farmstead
Commercial
Residential
Agricultural
2020 Overall Assessed Valuation Up 8% Other
Vacant
Data Source: OrionConstitutional Assessment Rates 26 Classification (Assessment Level) For Property In Kansas Since 1989 [1] REAL PROPERTY % OF MARKET VALUE • RESIDENTIAL (including multi-family) 11.5% • VACANT LOTS 12% • COMMERCIAL / INDUSTRIAL / AG BLDGS 25% • NOT-FOR-PROFIT 12% • PUBLIC UTILITY 33% • AGRICULTURAL LAND 30% (of Ag value) • ALL OTHER PROPERTY NOT CLASSIFIED ABOVE 30% PERSONAL PROPERTY • MOBILE HOMES 11.5% • PUBLIC UTILITY 33% • MOTOR VEHICLES (non Tax-n-Tags) 30% • COMMERCIAL / INDUSTRIAL M&E (CIME) 25% (of ‘calculated’ value) • ALL OTHER PROPERTY NOT CLASSIFIED ABOVE 30% • WATERCRAFT 5% [1] Residential initially at 12%, commercial initially at 30%, not-for-profit changed from 30% beginning with 1993 tax year; 2012 election authorized change to assessment % on watercraft.
A ‘Taxing Process’                                                                                                                                                                 27

How a Tax Bill Is Calculated

                                            Appraised Value x Assessment Rate = Assessed Value

                                                    Assessed Value x Mill Levy ÷ 1,000 = Tax Bill

  EXAMPLE:
                                                                                          COMMERCIAL                                   RESIDENTIAL [1]
                Appraised Value:                                                              $100,000                                        $100,000
                Assessment Rate:                                                                  25%                                           11.5%
                Assessed Value:                                                                $25,000                                         $11,500
                Mill Levy:                                                                  176.600000                                      176.600000
                Estimated Tax Bill:                                                             $4,415                                          $2,031

                ETR (tax / value):                                          4,415/100,000                                               2,031/100,000
                Effective Tax Rate =                       4.415% (also equal to .1766*.25)                                       2.031% (.1766*.115)
   [1] This example is for illustration purposes only and does not take into account the exemption on school taxes for the first $20,000 of value on Residential class property.

What is the Mill Levy?
• The mill levy is the tax rate that is applied to the assessed value of your property. A mill is one dollar per $1,000 dollars of assessed value. The mill levy consists
  of a local portion which is used to fund local services and a statewide portion which is used to fund public schools. The statewide school mill levy is currently 20
  mills. The first $20,000 of appraised value for residential properties is exempt from the statewide school mill levy.

• The UG Clerk’s Office computes the mill levies for each local taxing authority by dividing the portion of the taxing authority's budget that is property tax funded
  by the assessed value in the taxing authority's service area.
Personal Property (PP) 28
Appraisal Phase Timeline
$ Appeal Deadline for PP
Valuation Notices is May 15th
PP Valuation Notices are
mailed on May 1st
Renditions due March 15th
50% Penalty for Failure to File
PP Renditions mailed to
current personal property
accounts January 1Personal Property (PP) 29
Account Totals
Personal Property Valuation Notices for 2020 will be mailed May 1, 2020
Deadline to appeal Personal Property Valuation Notice is May 15, 2020
Commercial PP Individual PP Manufactured Homes Renditions
1,679 4,198 1,629 7,705
-3.7% from 2019 +4.8% from 2019 -1.4% from 2019 +1.5% from 2019
Tiny homes, trailers, Increase in accounts Personal Property
Business Owned
mopeds, trucks over due to several worksheets/renditions
Machinery &
12M, non-highway Manufactured Home are mailed the first
Equipment
vehicles Parks have sold and week of January
the new owners are
Exempt after 6/30/06 Watercraft valued at
bringing in new Late filing penalties; 5%
market value but
manufactured homes increments up to 25%
assessed at 5% &
minimum tax bill of 50% Penalty for
614 on-site re-inspections
$12.00 were conducted in 2018 Failure to File
Note: “Other” personal property costing less than $750 is exempt (Examples include trailers, golf-carts, mopeds, off-road vehicles)
Data Source: CIC-TASWhat Questions Can The Appraiser’s Office Answer? 30
When to contact the Appraiser’s Office
How do I
appeal my
Why did my What is
appraised Why was an
appraised considered
What is value value? Personal appraiser at
Agricultural my property?
change? What is a
What is
Property?
Use? Rendition?
Classification
?Appraisal Information on the Web 31
Visit: www.wycokck.org/appraiser
Announcements Parcel Search
Special-purpose Current year individual parcel
announcements for property data and value
various appraisal phases information, comparable
sales report and property
record card, etc
FAQ Real Estate Tax Search
Centralized location that Current and prior year
answers FAQs concerning individual real estate value
valuation & appeals process and tax bill information
Forms Publications
All types of forms related to
appeals, personal property, Educational Videos on Appraisal Processes Various appraisal related
publications to assist and
tax exemptions, mailing inform the public
address changes, etc32
Questions?
• Mission Statement
To provide uniform, fair and equitable values among all classes of property by
maintaining the highest standards in appraisal practices and law, guided by the goals of
quality customer service to the public, while providing a work environment that
encourages staff’s professional and personal growth.
• Vision Statement
To be a recognized leader for providing fair and equitable mass appraisals of both real
and personal property, along with providing accurate and comprehensive information
to the citizens and taxpayers of Wyandotte County in a preeminently accountable,
effective and efficient manner.
• Management Team
Kathy Briney - County Appraiser
Matt Willard - Deputy Appraiser
Kevin Bradshaw - Commercial Supervisor
Janae Robbins - Residential Supervisor
Christine Wheeler – Personal Property/Admin Support Supervisor
32You can also read


