INDIRECT ESTIMATION OF SOIL WATER CONTENT IN PLOUGH LAYER BASED ON TOPSOIL SPECTRUM
←
→
Page content transcription
If your browser does not render page correctly, please read the page content below
The International Archives of the Photogrammetry, Remote Sensing and Spatial Information Sciences, Volume XLII-3/W10, 2020
         International Conference on Geomatics in the Big Data Era (ICGBD), 15–17 November 2019, Guilin, Guangxi, China

         INDIRECT ESTIMATION OF SOIL WATER CONTENT IN PLOUGH LAYER
                         BASED ON TOPSOIL SPECTRUM

                                              Zhai Haoran1, Li Xican2,*, Zhong Hao3
         1 College of Information Science and Engineering, Shandong Agricultural University, Tai'an – 894562458@qq.com
             2 College of Information Science and Engineering, Shandong Agricultural University, Tai'an – lxc@sdau.edu.cn
         3   College of Information Science and Engineering, Shandong Agricultural University, Tai'an –260919837@qq.com

KEY WORDS: Soil Water content; Hyperspectral Remote Sensing; Indirect Estimation; Estimation Model

ABSTRACT:

In order to estimate the soil water content of the plough layer using the surface soil spectrum, based on the water content data and
hyperspectral data of 85 surface layers and ploughed soil samples in Jiyang County, Shandong Province, 10 transformation methods
such as square root are used. The spectral reflectance of the topsoil is transformed, and the estimation factor is selected according to
the principle of maximal correlation. Then, according to the correlation between the water content of the surface layer and the plough
layer, two indirect estimation models are constructed.Six kinds of modeling methods such as multiple linear regression, partial least
squares regression and support vector machine were used to estimate the soil water content of the cultivated layer, and the
effectiveness of the two indirect estimation models was compared and analyzed. The results show that the decision coefficient R2 of
the first mode is 0.8138, the average relative error is 9.6061% and the decision coefficient R2 of the second mode is 0.8115, the
average relative error is 12.1403%. The researches show that it is feasible and effective to estimate the soil water content of the
plough layer by using the surface soil spectrum. It provides a new idea for the rapid diagnosis of soil moisture and nutrients by using
optical satellite remote sensing technology.

                    1.   INTRODUCTION                                    samples and spectral data collected in Hengshan County,
                                                                         Shaanxi Province, that the soil water content spectral
Soil water content is an important part of soil and an                   characteristics were sensitive at 1350~1400 nm and
important indicator for land resource evaluation and crop                1880~1920 nm when the soil water content was 10%(Wang
growth monitoring. It has an irreplaceable effect on crop                Xiao,2012). He Ting extracted the spectral characteristics of
growth and development (He Haibing,2016). In particular,                 the two absorption valleys of 1450 nm and 1925 nm of loess,
surface soil water content is sensitive to micro-                        sand and wind sand, and established a prediction model of
meteorological responses, which can be used to effectively               soil water content (He Ting, 2006). It has been found that
monitor soil and crop drought conditions (Zhao                           spectral data transformation is beneficial to the mining and
Wenzhi,2006). However, traditional soil water content                    extraction of spectral information, and thus improves the
determination methods are difficult to meet the needs of rapid           accuracy and stability of the prediction model. Kemper
detection of soil moisture. Remote sensing technology is                 performed a first-order differential treatment on the original
widely used in the estimation of soil moisture by its                    spectral reflectance of the soil, which improved the
advantages of large area, non-contact and timeliness (Ma                 monitoring accuracy of soil heavy metals and clay content
Chunya,2018).                                                            (Kemper T, 2002). Jia Xueqin and others have significantly
                                                                         improved the accuracy of the model by first-order differential
At present, domestic and foreign scholars have conducted a               transformation of the logarithm of the original spectrum (Jia
lot of research on the spectral estimation of soil water content.        Xueqin,2018). Yin Yebiao and others through the soil
Studies have shown that soil reflectivity decreases with                 spectrum to the envelope and then first-order differential, the
increasing water content within a certain range, which                   predicted water content R2 reached 0.855(Yin Yebiao,2011).
provides a basis for soil water inversion(Etienne Muller,2001;           With the deepening of research, the method of estimating soil
LOBELL D B,2002; Kaleita A L,2005; Pate M,2015). The                     water content by using soil spectral characteristics is
soil moisture has obvious absorption peaks near the 1400nm,              gradually enriched, and statistical models such as multiple
1900nm and 2200nm bands. The quantitative estimation of                  linear regression (Yan Changrong,2008;Jia Jitang,2013;Yu
soil water content can be achieved by extracting spectral                H,2017) and partial least squares regression (Peng Sengmin,
absorption parameters at these wavelengths (Lu Yanli,2018;               2010; Raj A, 2018) gradually move to support vector
Lesaignoux A,2009/2010; Huijun L,2018). SANTRA and                       machines (Bordoni M, 2018; Wang Haijiang,2018; Li Binnan,
HUMMEL studied the variation of soil reflectance spectra                 2019), BP neural network (Guo Qingchun,2012; Hassan-
under different water content conditions in the laboratory,              Esfahani L, 2015) and other mechanism models developed.
and carried out soil moisture prediction (SANTRA P, 2009;                Jin Huing established a linear regression model by analyzing
HUMMEL J W, 2001). Wang Xiao found through the soil                      the spectral absorption characteristics of black soil, and the

* Corresponding author

                                                 This contribution has been peer-reviewed.
                    https://doi.org/10.5194/isprs-archives-XLII-3-W10-931-2020 | © Authors 2020. CC BY 4.0 License.                 931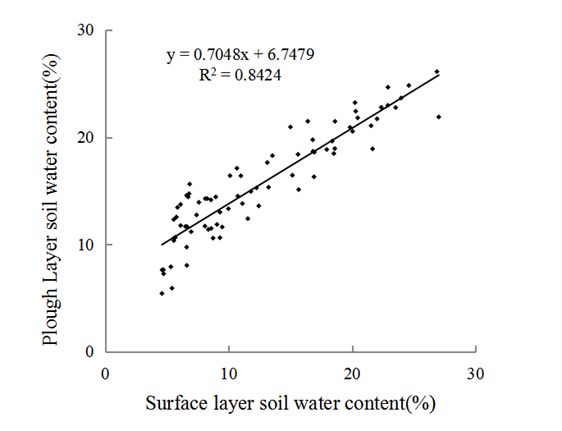
The International Archives of the Photogrammetry, Remote Sensing and Spatial Information Sciences, Volume XLII-3/W10, 2020
            International Conference on Geomatics in the Big Data Era (ICGBD), 15–17 November 2019, Guilin, Guangxi, China

prediction accuracy is high(Jin Huining, 2016). Chen                    positioned using a handheld GPS instrument.
Wenqian used the support vector machine regression model
in the spectral study of the oasis vegetation in the arid area,         The spectral measurement of the soil samples was performed
and compared it with the multiple regression and partial least          using the American ASD Fieldspec-4 spectrometer. The
squares regression model(Chen Wenqian,2017). Wang                       instrument has a spectral range of 350 nm to 2500 nm, a
Tongtong studied the soil moisture after applying biochar by            spectral sampling interval of 1.4 nm at 350-1000 nm, 2 nm at
comparing the accuracy of the SVM model with the BP                     1000-2500 nm, and an output band number of 2151. When
neural network model(Wang Tongtong,2017). The research                  collecting the spectrum, the probe is kept at a distance of 30
results have enriched the estimation method of soil water               cm from the soil sample, and is irradiated vertically with a 3°
content and provided technical support for soil water content           field of view, and the spectral resampling interval is set to 1
spectrum estimation research. However, most of the current              nm. Select weather-clear and cloud-free weather for outdoor
research is based on the analysis of soil water content by              spectral measurements from 10:00 to 14:00, and repeat 10
stratified soil spectral analysis, while optical satellite remote       times measurements of each soil samples.
sensing can only obtain the spectral information of 0-5cm
surface soil, it is difficult to obtain the spectral information of     2.3     Sample Water Content Determination
the ploughed soil, which is not conducive to a large number
of the combination of the study of the soil spectrum of the             The water content (unit: %) of the soil samples was
plough layer and the optical satellite remote sensing also              determined by a drying method in the laboratory, and the
affects the application of optical satellite remote sensing in          statistical characteristics thereof are shown in Table 1.
precision agriculture. Therefore, it is of great practical
significance to make full use of surface spectral information                Table 1 .Statistical Characteristics of Soil Water Content
to achieve indirect estimation of soil moisture in cultivated
soil.                                                                           Water Content              Surface         Plough
                                                                                Characteristics             Layer           Layer
Based on the data of 85 soil samples from Jiyang County,                       Maximum value /%               27             26.1
Shandong Province, this paper constructs two estimation                        Minimum value/%               4.58            5.43
models of soil moisture content based on surface soil                          Average value /%             12.51           15.65
spectrum, and realizes indirect estimation of soil moisture                    Standard value/%              6.31            4.89
content in cultivated soil, aiming to utilize optical satellites.
The remote sensing technology provides a technical reference            3.     DATA PROCESSING AND MODELING METHOD
for quickly estimating soil moisture content such as soil
moisture in the plough layer.                                           3.1     Data Preprocessing

        2.   EXPERIMENTAL DATA ACQUISITION                              Using the ViewSpecPro spectral data processing software,
                                                                        the spectral curve of each soil sample was corrected for
2.1    Experimental Area Overview                                       breakpoints, and then the average of 10 spectral curves was
                                                                        calculated and used as the spectral reflectance of the
Jiyang County is located in the lower reaches of the Yellow             corresponding sample. Because of the various factors, the
River, the southern part of the Lubei Plain (latitude 36°41′—           spectral curve has a lot of small noise. In order to reduce the
37°15′north, east longitude 116°52′-117°27′). Jiyang County             influence of glitch noise and make the spectral curve more
is developed on the alluvial mother material of the Yellow              stable, the spectral curve is smoothed by a 9-point weighted
River, and the soil layer is deep; the land use types include           moving average method.
cultivated land, garden land, forest land, unused land and
                                                                        In order to prevent the abnormal samples from greatly
some tidal flats. Jiyang County has 3 soil types, 5 sub-
                                                                        affecting the experimental results, the spectral reflectance
categories, 9 soil genus, and 84 soil types. The main soil type
                                                                        data of the soil samples are sorted according to the order of
is fluvo-aquic soil. The tidal soil accounts for 99.41% of the
                                                                        water content from small to large, and the scatter plots are
soil area, the saline soil accounts for 0.30%, and the aeolian
                                                                        drawn to observe the trend of the spectral reflectance curves
sandy soil accounts for 0.29%. The soil distribution types are
                                                                        and eliminate the abnormal samples. A total of 4 abnormal
sandy soil, loamy soil, clay soil, loamy soil and sandy soil
                                                                        samples numbered 7, 45, 46, and 62 are excluded from the
from southwest to northeast. It belongs to the north warm
                                                                        study. Then the remaining 81 samples are used for modeling
temperate monsoon climate. The annual average temperature
                                                                        analysis.
is 12.8 °C, and the average annual precipitation is 586.9 mm.
                                                                        3.2     Spectral Transformation
2.2    Sample Collection and Spectrometry
                                                                        Studies have shown that spectral data transformation has
Before sampling, according to the collected terrain, landform,
                                                                        good effects in eliminating background and noise
land use status and other information related to the test area,
                                                                        interference, reducing internal factors and amplifying spectral
the distribution of sampling points is reasonably determined.
                                                                        absorption characteristics, which is beneficial to the mining
Samples were randomly placed in each sampling area
                                                                        and extraction of spectral information, and thus improves the
according to the predetermined route. At each sample point,
                                                                        accuracy and stability of the prediction model. The original
about 0-5 cm of topsoil and 0-20 cm of ploughed soil were
                                                                        spectra were processed by 10 transformation methods such as
collected, respectively, 85, and the soil samples were sealed,
                                                                        square, logarithm, reciprocal, square root, first-order
numbered sequentially. During the sampling process, the soil
                                                                        differential and their combination to improve the correlation
type of each soil sample was recorded and simultaneously
                                                                        between spectral data and water content. The comparative

                                                 This contribution has been peer-reviewed.
                    https://doi.org/10.5194/isprs-archives-XLII-3-W10-931-2020 | © Authors 2020. CC BY 4.0 License.                  932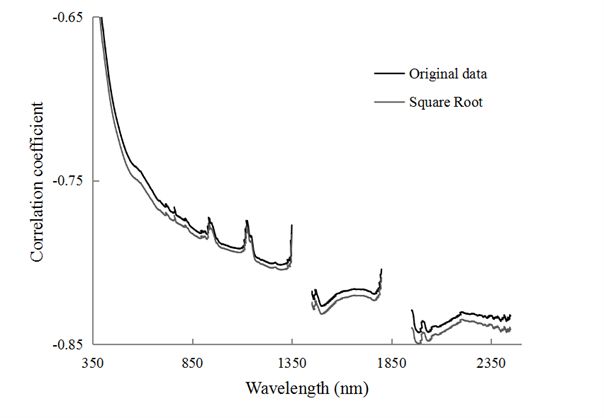
The International Archives of the Photogrammetry, Remote Sensing and Spatial Information Sciences, Volume XLII-3/W10, 2020
International Conference on Geomatics in the Big Data Era (ICGBD), 15–17 November 2019, Guilin, Guangxi, China
analysis shows that the spectral reflectance of the topsoil is soil moisture content of the plough layer based on the
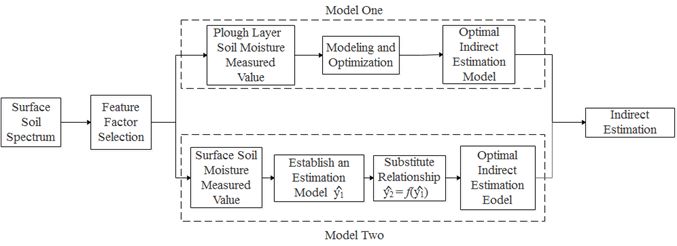
better after square root transformation, as shown in Figure 1. relationship between the plough layer and the surface soil
water content. Firstly, the surface soil water content
estimation model is established based on the surface soil
spectrum, and the estimated value of the surface soil water
content is calculated. Then according to the measured data of
soil surface layer and plough layer water content, the
relationship between soil surface layer and plough layer
water content is established, and then the estimated value of
surface soil water content is substituted into the relationship,
and the estimated value of water content of soil plough layer
is calculated. The implementation process of two indirect
estimation methods is shown in Figure 2.
Figure 1.Correlation Coefficient between Water Content and
Square Root Transformation of Reflectivity
It can be seen from Figure 1 that after the spectral reflectance
of the soil is transformed by the square root, the correlation
with the soil water content is significantly improved at Figure 2. Two models of indirect estimation
different bands. There is a significant improvement at
500nm~700nm, 1450nm~1800nm and 1950nm~2450nm, and For comparative analysis, this paper adopts linear modeling
the correlation coefficient in the range of 1950nm~2450nm is methods such as multiple linear regression(SLR), principal
up to 0.84. component regression(PCR) and partial least squares
regression (PLSR), as well as support vector machine (SVM)
and BP neural network (BP-NN). Nonlinear modeling
3.3 Selection of Characteristic Factor methods such as RBF neural network (RBF-NN) are used to
model and compare accuracy. The accuracy of the model is
From the correlation coefficient curve shown in Figure 1,
measured by the decision coefficient R2 and the average
according to the principle of maximal correlation and the
relative error.
principle of dispersion as much as possible between the
bands, the soil water content spectral feature inversion factor
4. RESULTS AND ANALYSIS
is selected, as shown in Table 2.
4.1 Correlation between Surface Soil and Cultivated
Table 2 .Characteristic Factor Soil Water Content
Wavelength/nm Correlation Coefficient Because the surface soil and the ploughed soil have great
1349 -0.82 differences in temperature, humidity, light, ventilation,
1801 -0.83 microbes and other conditions, and the soil moisture has
1985 -0.84 infiltration phenomenon, the soil water content is not the
1986 -0.84 same in the surface layer and the plough layer soil. Under
2100 -0.84 normal circumstances, the surface soil is susceptible to
external conditions such as sunlight and wind, and the water
It can be seen from Table 2 that the correlation coefficients at is easy to evaporate, so the water content of the ploughed soil
the bands 1349nm, 1801nm, 1985nm, 1986nm and 2100mn is generally higher than that of the surface soil. A scatter plot
are relatively high, and the correlation coefficient is about is drawn using measured values of surface soil and tillage soil
0.83, which has significant correlation and can be selected as water content, as shown in Figure 3.
the inversion factor.
3.4 Modeling Method
This paper constructs two indirect estimation models for the
soil moisture content of plough layers.
The first model is an indirect estimation of the soil moisture
content of the plough layer based on the spectral
characteristics of the surface soil, that is, the inversion factor
extracted from the surface spectral information and the soil
moisture content of the plough layer are modeled to obtain
the estimated soil water content of the plough layer.
Figure 3. Relationship between surface soil and cultivated
The second model is based on the indirect estimation of the soil water content
This contribution has been peer-reviewed.
https://doi.org/10.5194/isprs-archives-XLII-3-W10-931-2020 | © Authors 2020. CC BY 4.0 License. 933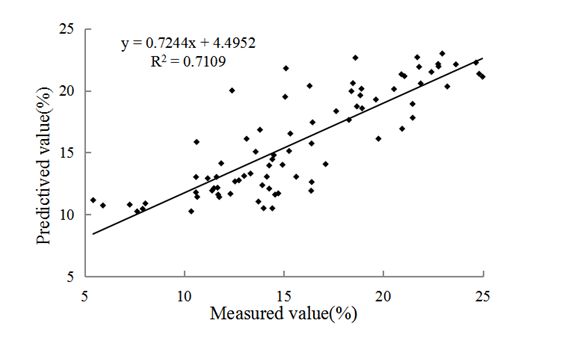
The International Archives of the Photogrammetry, Remote Sensing and Spatial Information Sciences, Volume XLII-3/W10, 2020
International Conference on Geomatics in the Big Data Era (ICGBD), 15–17 November 2019, Guilin, Guangxi, China
It can be seen from Figure 3 that there is a significant
correlation between the surface soil water content and the soil
moisture content of the plough layer, and the determination
coefficient R2 is 0.8424. It provides an important basis for the
indirect estimation of soil moisture content in the stratified
soil using surface soil spectroscopy.
4.2 Indirect Estimation Model of Tillage Soil Water
Content Based on Surface Soil Spectrum
According to the estimation factors based on surface soil
spectrum and the measured values of soil water content, six
methods including multiple linear regression, principal Figure 7. Estimated result of BP-NN
component regression, partial least squares regression,
support vector machine, BP neural network and RBF neural
network were used. The multivariate linear regression
experiment was carried out by using the statistical analysis
software IBM SPSS Statistics 23; the Principal Component
Regression and Least Squares Regression experiments were
carried out by using the data processing software DPS7.05;
the BP neural network and RBF neural network experiments
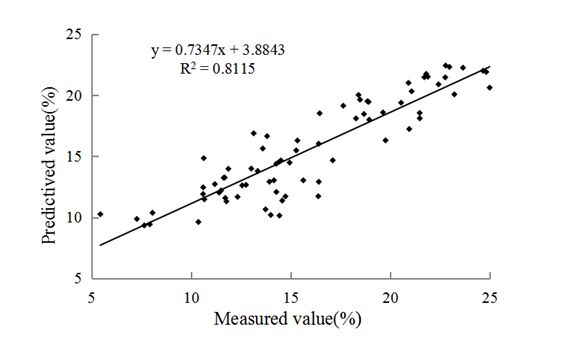
were performed by using MATLAB2017b. A scatter plot is
drawn from the estimated results of the six models and the
measured values of the soil moisture content of the plough
layer, as shown in Figures 4-9. The estimation accuracy of
the six models is shown in Table 3.
Figure 8. Estimated result of SVM
Figure 4. Estimated result of MLR Figure 9. Estimated result of RBF-NN
Table 3. Estimation accuracy comparison table of estimation
mode one
Average Relative
Modeling Method Decisive Factor
Error/%
MLR 0.8115 12.1403
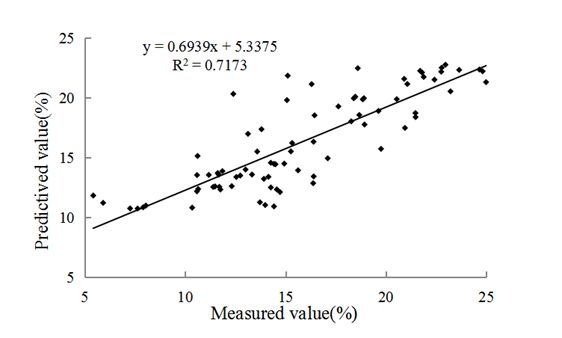
PCR 0.7164 16.4720
PLSR 0.6680 14.6546
BP—NN 0.7173 15.7129
SVM 0.7109 14.8668
RBF—NN 0.5506 17.5370
Figure 5. Estimated result of PCR
It can be seen from Figures 4-9 and Table 3 that the
estimation results of the six models are quite different, and
the estimation accuracy is not the same. Except for the RBF
neural network model, the determination coefficient R2 of
other models is about 0.7~0.8, among which the multivariate
linear regression model has the highest estimation accuracy,
the determination coefficient R2 is 0.8115, and the average
relative error is 12.1403%.
4.3 Indirect Estimation Results of The Second Model
Figure 6. Estimated result of PLSR According to the surface spectral characteristic factors of the
This contribution has been peer-reviewed.
https://doi.org/10.5194/isprs-archives-XLII-3-W10-931-2020 | © Authors 2020. CC BY 4.0 License. 934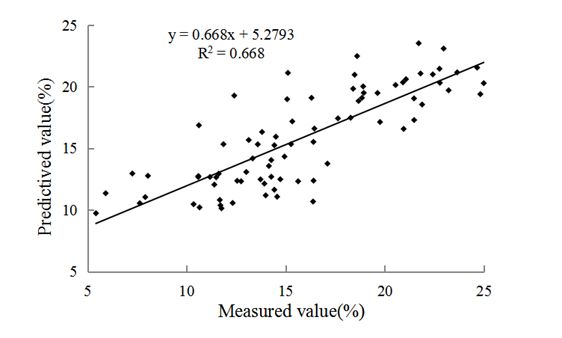
The International Archives of the Photogrammetry, Remote Sensing and Spatial Information Sciences, Volume XLII-3/W10, 2020
            International Conference on Geomatics in the Big Data Era (ICGBD), 15–17 November 2019, Guilin, Guangxi, China

selected 81 samples, the second model was used to calculate             optical remote sensing technology and the ground
the estimation results, and the results were analyzed with the          hyperspectral research results is found, which can promotes
measured values to obtain the following Table 4.                        the monitoring capacity of soil water content by using optical
                                                                        remote sensing technology.
Table 4. Estimation accuracy comparison table of estimation
                         mode two                                                            5.    CONCLUSION

                            Decisive       Average Relative             Based on the water content data and hyperspectral data of 85
  Modeling Method
                             Factor            Error/%                  surface soils and ploughed soil samples in the tidal soil of
           MLR               0.8138              9.6601                 Jiyang County, Shandong Province, two different patterns
                                                                        were implemented by data processing, spectral
           PCR               0.6685             16.3818                 transformation, feature inversion factor selection and other
                                                                        steps, which are used to Indirect estimation of soil moisture
          PLSR               0.6690             16.3696
                                                                        in the plough layer. The experimental results show that the
         BP—NN               0.6781             14.1557                 estimating accuracy of the soil water content of the six type
                                                                        models are different, and the multiple linear regression
           SVM               0.7949             12.7838                 accuracy is better, while the optimal estimation results of the
        RBF—NN               0.6102             16.7429                 two indirect estimation patterns are similar, and the
                                                                        determination coefficient R2 is 0.8115 and 0.8138, the
                                                                        average relative error was 12.1403% and 9.6601%,
                                                                        respectively. This indicates that it is feasible and effective to
It can be seen from Table 4 that the results of multiple linear
                                                                        estimate the soil moisture content of the plough layer by
regression and support vector machine models in the six
                                                                        using the surface soil spectrum. It provides a new idea for the
models are better, and the other models are less accurate.
                                                                        rapid diagnosis of soil moisture and nutrients by using optical
                                                                        satellite remote sensing technology.
4.4    Comparative Analysis of Results
                                                                                                  REFERENCES
It can be seen from the comparison between Table 3 and
Table 4:
                                                                        Bordoni. M., Bittelli. M., Valentino. R., 2018: Soil Water
                                                                        Content Estimated by Support Vector Machine for the
(1)The estimation accuracy of different models in the two               Assessment of Shallow Landslides Triggering: the Role of
patterns is different. The results of the multiple linear               Antecedent      Meteorological     Conditions.Environmental
regression model in Pattern 1 are better, the decision                  Modeling & Assessment 23(4):333-352.
coefficient R2 reaches 0.8, and the estimation accuracy of the          Chen Wenqian.,Ding Jianli.,Tan Jiao.,Li Xiang.,2017:
other models is slightly worse. The decision coefficient R2 is          Analysis Vegetation of Hyperspectral Reflectance and
about 0.55~0.71, and the multivariate linear regression                 Shallow Soil Water Content in Arid Area. Transactions of
model is the best. The results of multiple linear regression            the Chinese Society for Agricultural Machinery
model and support vector machine model in Pattern 2 are                 2017(09):1-16.
better. The coefficient of determination R2 is about 0.8. The           Etienne Muller,Henri Décamps,2001: Modeling Soil
estimation accuracy of other models is slightly worse. The              Moisture–reflectance. Remote Sensing of Environment
coefficient of determination R2 is about 0.6, and the results of        76(2):173-180.
multiple linear regression models are optimal.                          Guo Qingchun,Wang Sujuan,He Zhenfang,2012: Study on
                                                                        Forecasting Model of Soil Water Content based on BP
(2)The optimal result of Pattern 1 and Pattern 2 is not much            Artificial Neural Network. Shandong Agricultural Sciences
different. Relatively speaking, the average relative error of           44(12):11-15.
the estimated result of Pattern 2 is small, 9.6601%. The                Hassan-Esfahani.     L.,Torres-Rua.    A.,Jensen   A.,2015:
reason is that the field environment is complex and diverse,            Assessment of Surface Soil Moisture Using High-Resolution
and the water content changes with time, temperature,                   Multi-Spectral Imagery and Artificial Neural Networks.
                                                                        Remote Sensing 7(3):2627-2646.
humidity and other conditions, resulting in soil water content.
                                                                        He Haibing,Wu Liquan,Yang Ru,Ma Fuyu,Huang Yide,2016:
There is an error in the estimation. Although the average
                                                                        Photosynthesis Characteristics and Transpiration Efficiency
relative error of the Pattern 1 results is slightly lower than
                                                                        of Rice Plants under Controlled Irrigation Technology in
that of the Pattern 2, the estimation accuracy is still high, so        Arid Region. Transactions of the Chinese Society for
both patterns can be used to estimate the water content of the          Agricultural Machinery 47(9):186-193.
plough layer. Among the two indirect estimation methods,                He Ting,Wang Jing,Chen Ye,Lin Zongjian.,2006:Spectral
the multivariate linear regression model has the highest                features of soil moisture. Acta Pedologica Sinica
precision, indicating that there is a clear linear relationship         (06):1027-1032
between the soil water content and the spectral data, which is          Huijun. L.,Hongjun. S.,Bo. Z.,2018: Hyper-spectral Multiple
consistent with the existing research results.                          Features Optimization Using Improved Firefly Algorithm.
                                                                        Remote Sensing Technology and Application.
(3)Traditional optical remote sensing satellites cannot detect          HUMMEL. J W.,SUDDUTH. K A.,HOLLINGER. S E.,2001:
the spectrum of cultivated soil, and it is impossible to                Soil moisture and organic matter prediction of surface and
promote and use ground remote sensing inversion results. By             subsurface soils using an NIR soil sensor. Computers and
using the surface soil spectral information to indirectly               Electronics in Agriculture 32:149-165.
estimate the soil moisture content of the plough layer, a joint         Jia Jitang, Cheng Linlin, Yu Yang,Wang Pengfei, Ren Juntao,
point between the research results of aerospace and aerospace           Meng Haocan.,2013: A Hyper-spectral remote sensing model

                                                 This contribution has been peer-reviewed.
                    https://doi.org/10.5194/isprs-archives-XLII-3-W10-931-2020 | © Authors 2020. CC BY 4.0 License.                  935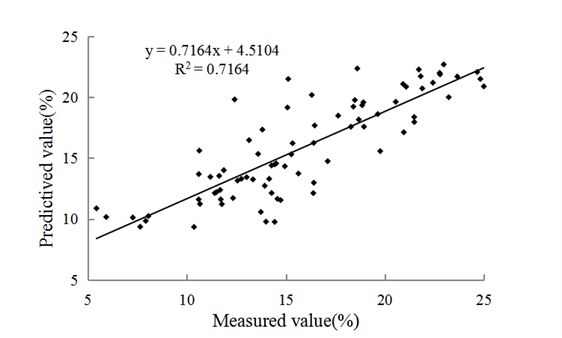
The International Archives of the Photogrammetry, Remote Sensing and Spatial Information Sciences, Volume XLII-3/W10, 2020
         International Conference on Geomatics in the Big Data Era (ICGBD), 15–17 November 2019, Guilin, Guangxi, China

of soil moisture content based on multivariate statistical             Yan Changrong,Shen Huijuan,He Wenqing,Liu Suang,Liu
analysis. Journal of Geomatics Science and Technology                  Qin.,2008: Study on the Simulation Model of Soil Moisture
30(06):614-618.                                                        with Multiple Regression Method. Journal of Hubei Minzu
Jia Xueqin,Feng Meichen,Yang Wude,Wang Chao,Sun                        University(Natural Science Edition) 2008(03):241-245.
Hui,Wu Gaihong,Zhang Song.,2018: Study on the spectral                 Yin Yebiao,Li Xia,Zhao Zhao,Dong Daorui.,2011: Predict
prediction model of soil moisture content based on SPA-                Model and Analysis of the Sandy Soil Moisture with
MLR method. Agricultural Research in the Arid Areas                    Hyperspectral. Remote Sensing Technology and Application
36(03):266-269+291.                                                    26(03):355-359
Jin Huining,Zhang Xinle,Liu Huanjun,Kang Ran,Fu                        Yu H , Kong B , Wang G , et al.,2017: Prediction of Soil
Qiang,Ning Donghao.,2016: Soil Moisture Predicting Model               Properties Using a Hyperspectral Remote Sensing Method.
Based on Spectral Absorption Characteristics of the Soil.              Archives of Agronomy and Soil Science 2017.
Acta Pedologica Sinica 53(03):627-635.                                 Zhao Wenzhi,Liu Hao.,2006: Recent Advances in Desert
Kaleita. A L.,Tian. L F.,Hirschi M C.,2005: Relationship               Vegetation Response to Groundwater Table Changes. Acta
between Soil Moisture Content and Soil Surface Reflectance.            Ecologica Sinica 2006(08):2702-2708.
Transactions of the Asae 48(48): 1979-1986.
Kemper. T.,Sommer. S.,2002: Estimate of heavy metal
contamination in soils after a mining accident using
reflectance spectroscopy. Environmental Science &
Technology 36(12): 2742-2747.
Lesaignoux. A .,Fabre. S.,Briottet. X.,et al.,2010:
Estimation of Soil Moisture Content of bare soils from their
spectral optical properties in the 0.4 – 12 µm spectral domain.
Geoscience & Remote Sensing Symposium. IEEE, 2010.
Lesaignoux. A.,Fabre. S.,Briottet X.,et al.,2009: Influence of
Surface Soil Moisture on Spectral Reflectance of Bare soil in
the 0.4 – 15 μm Domain. 2009.
Li Binnan,Fan Guisheng.,2019: Prediction Model of Soil
Moisture Characteristic Curve Based on Support Vector
Machine. Water Saving Irrigation 2019(01):108-111+117.
LOBELL. D B.,ASNER. G P.,2002: Moisture Effects on Soil
Reflectance. Soil Science Society of America Journal 66 (3)
:722-727.
Lu Yanli,Bai Youlu,Wang Lei,Yang Liping.,2018: Spectral
Characteristics and Quantitative Prediction of Soil Water
Content under Different Soil Part. Scientia Agricultura Sinica
51(09):1717-1724.
Ma Chunya,Wang Jinglei,Huang Xiuqiao.,2018: Progress of
Retrieving Soil Moisture by Remote Sensing. Water Saving
Irrigation 2018(08):70-74+78.
Pate. M.,2015: A Spectral Reflectance Analysis of Soil
Moisture Content. Dissertations & Theses- Gradworks
2015.
Peng Sengmin,Lin Cunbin,Huang Jiaxin,Wang Fulin.,2010:
The prediction of soil moisture model based on partial least-
squares regression. Journal of Agricultural Mechanization
Research 32(09):45-49.
Raj. A .,Chakraborty. S., Duda. B M .,et al.,2018: Soil
mapping via diffuse reflectance spectroscopy based on
variable indicators: An ordered predictor selection approach.
Geoderma 314:146-159.
SANTRA. P.,SAHOO. R N.,DAS. B S.,SAMAL. R N.,
PATTANAIK. A K.,GUPTA V K.,2009: Estimation of Soil
Hydraulic Properties using Proximal Spectral Reflectance in
Visible, Near-infrared, and Shortwave-infrared (vis-nir-swir)
Rgion. Geoderma 152(3/4): 338-349.
Wang Haijiang,Jiang Tianchi, YUNGER John A,et al.,2018:
Hyperspectral Inverse Model for Soil Salt Ions Based on
Support Vector Machine. Transactions of the Chinese Society
for Agricultural Machinery 49(05):263-270.
Wang Tongtong,Zhai Junhai,He Huan,Zheng Jiyong,Tu
Chuan.,2017: Applicability of BP Neural Network Model and
SVM model to Predicting Soil Moisture Under incorporation
of Biochar into Soils. Research of Soil and Water
Conservation 24(03):86-91.
Wang Xiao.,2012: Staudies on soil moisture Hyper-spectrum
characteristics and estimating model. Shandong Agricultural
University, 2012.

                                                This contribution has been peer-reviewed.
                   https://doi.org/10.5194/isprs-archives-XLII-3-W10-931-2020 | © Authors 2020. CC BY 4.0 License.          936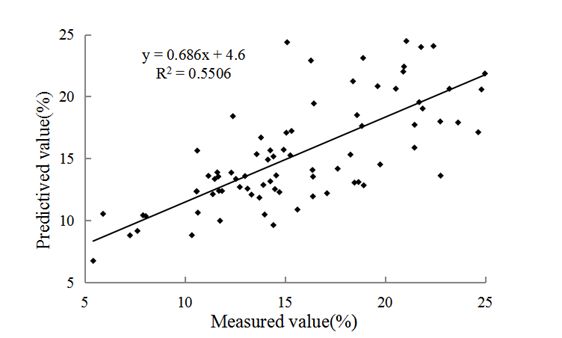
You can also read