Simple Logistic and Bi-Logistic Growth used as forecasting models of greenhouse areas in Albanian agriculture
←
→
Page content transcription
If your browser does not render page correctly, please read the page content below
Journal of Multidisciplinary Engineering Science and Technology (JMEST)
                                                                                                                     ISSN: 3159-0040
                                                                                                    Vol. 2 Issue 9, September - 2015

   Simple Logistic and Bi-Logistic Growth used
  as forecasting models of greenhouse areas in
               Albanian agriculture
                                               Dr. Valentina Shehu
                                            Department of Mathematics
                                 Faculty of Natural Sciences, University of Tirana
                                                  Tirana, Albania
                                             valentina.shehu@fshn.edu.al

    Abstract— The principal purpose of this paper             change. The logistic indicate effectively universal
is to analyze and present a prediction of the                 application for modeling technology diffusion, likewise
greenhouse diffusion in Albanian agriculture                  for modeling a lot of other individual and social
using a trend analysis based on the widely known              behaviors. S-shaped logistic curves have been
logistic curves. Technology forecasting in                    effectively applied in different area as demographics,
general, is useful for all intentional and systematic         biology, economics, ecology, psychology, engineering
efforts to precede and understand the possible                and many others. The application of the logistic
orientation, rate, features and impact of new                 model, e.g. to describe the population change (in
technology. Even though imperfect, technology                 biology, demographics) or the diffusion of the
forecast facilitates better choices and decisions.            innovations and new products, likewise above all
An accurate forecast enables maximize profit and              economic development, is very illustrative and
minimize loss from future situation. Any person,              attractive (mostly thanks to nice curve image. The
company, or country that can be affected by                   popularity of the logistic map in the modeling of the
innovations so necessarily engages in forecasting             variety of real phenomena happens in the middle of
technology.                                                       h
                                                                    century, and the corresponding publications are
                                                              enormous. It is honorable to mention two great
   Keywords— Logistic growth model, dynamics                  researchers Cesare Marchetti and Theodore Modis
of   socio-technical  systems,   forecasting,                 who have build the bases for the continuous
greenhouse technology                                         increasing popularity of logistic model.
  I. INTRODUCTION                                                For many years, Technological Forecasting &
   A lot of processes in biology, ecology, sociology,         Social Change has been a favorable and helpful
technology and other different areas follow S-shaped          support to present recent advances in studies on
logistic growth. Scientists all around the world apply        logistic equation.
logistic growth model (LGM) for describe the diffusion           The S-shaped logistic curve is frequently applied to
of technologies, to foresee population variations, for        describe and to forecast the evolution of social and
micro and macro-economic studies and for many                 economic processes. This is a appropriate model to
other objectives. This mathematical model is proved           explain the development of the presumed ―Limited
useful in describing a wide range of natural                  world‖.
phenomena: in tumor growth [1], forecasting model in
business and economic [ 2], estimation of livestock              II. MATERIALS AND METHODS
population [4], traffic models [6] etc.
                                                                 Loglet Lab [10] is a software package for analyzing
   Forecasters made the first notable prediction in           logistic behavior in time-series data.
technology when they applied exponential models to
                                                                 Processes of growth and diffusion often follow a
describe new technological and social evolution (e.g.
                                                              logistic course. In some cases they behave as a
Malthus, 1798). It was supposed logically that a new
                                                              series of logistic wavelets, or "loglets." In the easiest
technology firstly would be chosen by one or by two
                                                              cases to recognize, a loglet appears as an S-shaped
others each, and so on in a model of exponential
                                                              curve or a succession of many S-shaped curves.
growth. In the end however, as in any real system, a
                                                              When loglets overlap in time, the overall logistic
bound on thorough selections would be achieved,
                                                              behavior of a system can be hard to discern and
convincing the researchers to the logistic growth
                                                              analyze. In niches or markets in which several
model (LGM) to forecast technological and social
                             h                                populations or technologies compete, the growth and
change. At the end of          Centuary, researchers
                                                              decline of each entry also often exhibit logistic
such as Lenz(1985), Martino (1972), and very
                                                              behavior. This behavior depends on interactions
productive Marchetti (1977, 1994, 1996) improve
                                                              among the competitors. Namely, if a technology's
forecasting models and proved that the logistic growth
                                                              market share grows, it comes at the cost of shares of
was a excellent concept for forecasting technological
                                                              others. This process is well-described by the so-called

                                                  www.jmest.org
JMESTN42351100                                                                                                                2648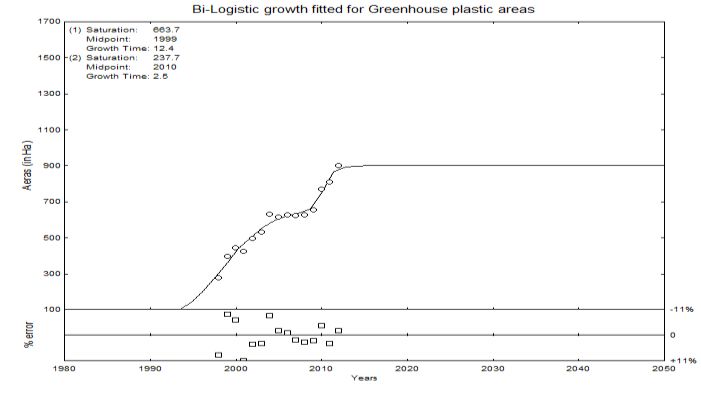
Journal of Multidisciplinary Engineering Science and Technology (JMEST)
                                                                                                                          ISSN: 3159-0040
                                                                                                         Vol. 2 Issue 9, September - 2015

"logistic substitution model." Again, discerning and
quantifying the pattern can be hard. To advance and                                             ⏟             ⏟
ease analyses of logistic behavior in time-series data,                                                       h
we use the "Loglet Lab" software package. Loglet Lab
users can fit logistic curves to a single time-series and             Notice that the inhibitor factor             is near to 1
apply the logistic substitution model to multiple time-            if P(t)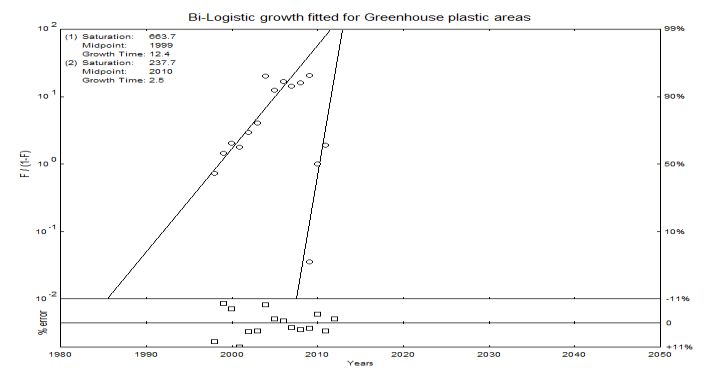
Journal of Multidisciplinary Engineering Science and Technology (JMEST)
                                                                                                                       ISSN: 3159-0040
                                                                                                      Vol. 2 Issue 9, September - 2015

                                                                   The technology in decline falls away firmly at
                                                                logistic rule untouched by competition by new
                                                                technologies.
                                                                   The first rule suggests that the increase can be
                                                                modeled with a logistic growth. As well the fourth
                                                                suggests that the decline stage can be modeled with a
                                                                logistic with a negative   . The second and the third
                                                                imply us define saturation trajectory by competition
                                                                from new technologies.
   Fig.1. Characteristics of logistic growth                        We see that for logistic substitution model, we use
   II.2. Bi-logistical model of growth                          a logisic with just only two parametres              the
                                                                carachteristic growth time and        the midpoint. The
    A lot of processes in nature and other areas follow         third parameter, carrying capacity k, is normalised at
logistic model of growth. Sometimes the simple S-               1, or 100%. Without the emergence of a new
shaped logistic curve gives a model correct of a                technology, the old in growth stage would increase to
system. Though the logistic growth model often is               a 100% of market share. In case of a new technology
applied to processes non adequate. Practically all              enter, its growth determines the old technology,
successful applications of the single growth model are          inducing it to saturate and fall.
in occurrences running in isolation. The saturation
level (the capacity of environment) of a social process             For each technology, it is obligatory to define the
is limited by the present level of technology, which is         time interval that specify its logistic rate of growth(or
always in progress. Generally, species can by chance            decline). Between this interval of time            is the
adapt and spread their location. If the saturation level        information that will be used to calculate the logistic
of a process varies during a period of logistic growth,         parameters that we will use to analyze the evolution of
another cycle of logistic growth with a different               technologies.
saturation level can superimpose on the first growth               II.4. Fisher-Pry transformation and visualization of
impulse. For instance mobile cellular telephone first           the logistic growth
replace fixed telephone and after it have another
logistic growth process by itself. This system with two            Generally, we represent logistic curve by just
logistic growth pulses, existing simultaneously or in           plotting on a positive coordinate system. We can
succession, it’s named ―Bi-logistical‖ by Meyer P. in           change the variables to transform the logistic curve in
[10]. The ―Bi-logistical‖ is helpful in modeling many           a straight line. This view is called the Fisher-Pry
systems that include complicated growth processes               Transform:
not correctly modeled by the original logistic.
                                                                If we denote by F(t) =              and FP(t) =              so we
   II.3. The logistic substitution growth
                                                                have:
    One of our interest of the paper is the analyse the
rise, stability and decline of competitors replacing by         Ln (FP(t)) =                   therefore P(t) =
one another. The technologies and products compete
                                                                    Thus, if we graph FP(t) on a semi-log scale, the S-
in the market, our study will focus on competition
                                                                shaped logistic curve is transformed into linear. We
between different kind of greenhouse in Albanian
                                                                notice that the interval of time in which the Fisher-Pry
agriculture. For this purpose we use the logistic
                                                                value is among          and     is equal , and the time
substitution model that describes the market share of
                                                                of     is the inflection point .The right axis indicates
competitors. The period of life of one competitor can
                                                                the respective percent of saturation value 100%.
be divided into three specific stages: growth,
                                                                Since the Fisher-Pry transform standardize every
saturation, and fall. We distinguish the particular
                                                                chart to the saturation point K, many logistic curves
moment of growth (development) depended on the
                                                                may be plotted on the chart to compare. Later, we will
emergence of new technologies. The growth and the
                                                                find out it helpful in case of analyzing more complex
fall follow logistic growth model that as we will note,
                                                                growth situations.
impacts on the saturation stage.
                                                                    II.5. The data
   The rules in base of the logistic substitution mode,
as established by Marcheti [17], are :                          The data about the greenhouses area of vegetables in
                                                                Albania, for the period 1998-2012, are taken from the
- New technologies come into the business and
                                                                database of Albanian Institute of Statistics. The area
increase following S-shaped logistic curve.
                                                                of vegetables in two type of greenhouses: heating
- Just one technology saturates the market at any               greenhouses (with glasses and with plastic) and solar
given period of time.                                           greenhouses (with glasses and with plastic) are
                                                                shown in table 1. Loglet Lab software is used to obtain
- A technology during saturation doesn’t follow a
                                                                the parameters of the model and the predicted values
logistic path that is between the growth stage and the
                                                                from logistic function.
decline.

                                                    www.jmest.org
JMESTN42351100                                                                                                                  2650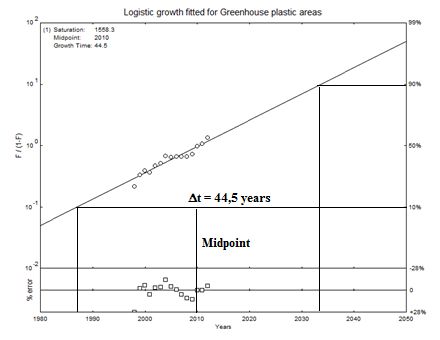
Journal of Multidisciplinary Engineering Science and Technology (JMEST)
                                                                                                                         ISSN: 3159-0040
                                                                                                        Vol. 2 Issue 9, September - 2015

  III. RESULTS AND DISCUSSION
     The greenhouse technology is one of great                    than the solar greenhouse area with glasses; and even
innovation in agriculture. The data of table 1 indicate           higher than the heating greenhouse area. The total
that the solar greenhouse area of vegetables and more             greenhouse area of vegetables is continuously
specifically solar greenhouse with plastic are higher             increasing.

   Table 1. Greenhouse area of Vegetables by type of Greenhouse

                         Heating greenhouses                          Solar greenhouses                     Total
        Year    With glasses     With plastic      Total   With glasses      With plastic        Total      Greenhouses
        1998          30               0            30           98               181             279             309
        1999          17               4            21          112               283             395             416
        2000          15               2            17          114               331             445             462
        2001          13               0            13           85               339             424             437
        2002          12               1            13           70               426             496             509
        2003          14               5            19           88               445             533             552
        2004          18               10           28           79               553             632             660
        2005          11               24           35           81               534             615             650
        2006          19               29           48           65               562             627             675
        2007          15               47           62           75               546             621             683
        2008          18               57           75           65               564             629             704
        2009          14               40           54           61               595             656             710
        2010          16               41           57           80               691             771             828
        2011          14               54           68           78               734             812             880
        2012          14               26           40           69               831             900             940

                                                                     Solar Greenhouses area of vegetables continue to
    Figure 2 indicates a decline of heating with glasses
                                                                  increase and indicates a S-shaped curve, whereas
greenhouse area of vegetables from 1998 to 2002,
                                                                  heating greenhouses area of vegetables is at low
followed by small fluctuations. Heating with plastic
                                                                  levels as indicated in figure 4.
greenhouse area of vegetables has increased slowly
from 1998 to 2004, and increased more from 2004 to
2008, then has happened big fluctuations of area and
a decline.

                                                                      Fig. 4. Total greenhouse area of vegetables
                                                                     It is clear that accurate forecasts are necessary for
                                                                  planning, making right decisions and implementing
   Fig. 2. Heating greenhouse area of vegetables                  marketing strategies. Applying logistic model for
   Figure 3 indicates a small decline of the solar with           forcasting needs the exact quantification of the growth
glasses greenhouse area of vegetables. Solar with                 process that is to find the value of the ceiling and the
plastic greenhouse area of vegetables shows a                     rate of the growth (control parameter). To obtain the
continuous increase during the study period.                      values of r and K we use the Loglet Lab software.
                                                                     Using Loglet Lab software and data base logistic
                                                                  curve is created for plastic greenhouse area. Figure 5
                                                                  presents simple logistic fitted with data observed for
                                                                  the period of time 1998 – 2012 for area of plastic
                                                                  greenhouse total.

   Fig. 3. Solar greenhouse area of vegetables

                                                       www.jmest.org
JMESTN42351100                                                                                                                    2651
Journal of Multidisciplinary Engineering Science and Technology (JMEST)
ISSN: 3159-0040
Vol. 2 Issue 9, September - 2015
Immediately, we note that the bi-logistical curve fits
better the growth process of greenhouse plastic areas.
The percentage error is about 11% , so we can confirm
that the growth process is compound with two growth
pulses.
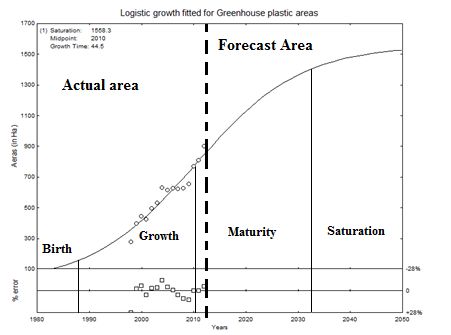
Fig.5. Single logistic curve fitted the plastic greenhouse area
The figure gives us the information about the fitted
logistic growth of plastic greenhouse areas: the
midpoint is 2010, the duration of growth time is 44.5,
the decrease in the rate of change was at the year
2012 that indicate the growth curve passes an Fig. 8. Two components growth pulses of plastic greenhouse
inflection point. Two periods 1988 – 2010 and 2010 - area logistic
2032 divide the logistic into growth and mature phases
The figure 8 gives the informations of two growth
and the saturation value is 1558.3. We see also how
pulses that compound bi-logistical process: the first
well this single logistic curve fits the data observed,
has the midpoint at the year 1999, the saturation level
Loglet lab diplays the differences between actual data
is 663.7 and growth time 12.4 years, the second
and those forecasted by fitted logistic curve. We see
smaller logistic pulse starts in 2009 has the inflection
the graph of percentage errors and the maximum error
point at 2010, the saturation level 237.7 and growth
is between 28% of the observed values.
time 2.5 years.
Fig.6. Fisher-Pry transformation of logistic fitted plastic Fig.9. Fisher-Pry transormation of bi-logistical growth
greenhouse area of plastic greenhouse areas
In order to improve the quality of forecast we will A converging Bi-logistical is shown where the first
use Bi-logistical growth fitting curve for plastic pulse of logistic growth is joint by a second faster
greenhouse areas. Analyzing the results we can say if pulse, dubbed the logistic model, and the two pulses
the sistem follows better a single logistical growth or saturate about the same time. Improving the quality of
bi-logistical growth. plastic used in construction of greenhouses will bring
both the carrying capacity and the growth rate of the
process to increase, causing the second pulse to rise
from the first with both a faster characteristic and a
higher carrying capacity.
IV. CONCLUSIONS
The logistic function can be used as a good
forecasting model. It can significantly determine at
certain degree of accuracy how effective are the
measures implemented to a certain concern such as
greenhouses for vegetable production. Based on the
findings, the logistic functions give close
approximations of the actual values. But, the
Fig. 7. Fitted bi-logistical growth curve of plastic greenhouse appropriate choice of time interval should be
area
www.jmest.org
JMESTN42351100 2652Journal of Multidisciplinary Engineering Science and Technology (JMEST)
ISSN: 3159-0040
Vol. 2 Issue 9, September - 2015
considered as it affects greatly the predicted values [3] Weisstein, E.W.Logistic Equation.(MathWorld A Wolfram
from the logistic equation. Web Resource, 2003).
Greenhouses for vegetable production is destined to http://mathworld.wolfram.com/LogisticEquation.html
play more and more a principal part in the Albanian [4] Applications of the Logistic Equation Growth Model :
climate environment as a way for sustainable Estimation of Livestock Population n Mongolia. Ch.
production of vegetables besides the best regulation of Battuvshin, N. Tugalag, N. Sonintamir & R. Enkhbat.
product quality and reliability, compatible with the Modern Management Science & Engineering Vo. 3, No.
market request, standards and regulations. In addition 1,2015
to supply the local market, the production of [5] Analysis of Logistic Growth Models. A.Tsoularis,
greenhouse vegetables is significant for its export Res.Lett.Inf.Math. Sci. (2001) 2, 23-46
potential and represents an important part in the
[6] Logistic map : from order to chaos. Mariarosaria
balance of foreign trade. Glass and plastic Tricarico, Francesca Visentin. Applied mathematical
greenhouses are a new ability of growing vegetables, Sciences, Vol. 8, 2014, no. 136, 6819-6826
but the statistics show that poly greenhouses give a
better investment profits than the glass ones. [7] T.Modis , Conquering Uncertainty, McGraw-Hill New
The object of the paper was to improve the results York 1998.
of forecasting for innovations used in Agriculture [8] T.Modis, Strength and weaknesses of S-
applying logistic S-shaped curve. It is concluded that curves,Technological Forecasting & Social Change 74
application of the rule of natural growth with a logistic (2007) 866-872
S-curve, can improve fundamentally the precision of [9] Logistic growth of the global economy and competitivity
long-term forecasting. of nations.Witold Kwasnicki,Institute of Economic Sciences,
In this paper we analyzed wide variety of time-series University of Wroclaw,Poland.Technological Forecasting &
data sets about greenhouse area: heating with glass or Social Change 80(2013) 50-76,( working version of the
plastic, solar with glass or plastic, total heating or solar paper here)
during the period of time 1998-2012. Firstly, it was [10] ―Bi-logistic Growth‖, Meyer P., Technological
observed that the diffusion of greenhouse with glass Forecasting & Social Change, 47: 89-102 (1994).
heating or solar is in it’s saturation stage so doesn’t
[11] Montroll E.W. Social dynamics and the quantifying of
follow the growth process. It seems that the diffusion of
social forces. Proceedings of the National Akademy of
plastic greenhouse heating or solar tracked S- shaped Sciences (USA), 75(10), 4633-4637(1978)
logistic growth. We focused the study and made
forecasting about the total plastic greenhouse areas. [12] Loglet Lab for Windows Tutorial. Meyer P., Young J.,
The data set were fitted with a simple logistic growth Program for the Human Environment, Rockefeller
and to check improvement in fit by bi-logistic. So the University.
fitting simple logistic growth gave us the information: [13] A Primer on Logistic growth and Substitution: The
the saturation value is 1558 ha which can be achieved Mathematics of the Loglet Lab Software . Meyer P., Young
after 2032, the midpoint is at 2010 and the growth time J. & Ausubel J. Technological Forecasting & Social Change.
is about 44.5 years. Moreover the residuals in percent Vol. 61(3), pp. 247-271 (1999)
deviation of data observed from the fitted curve are [14] Improving Technological Literacy Criteria Development
28. Fitting the growth process by a bi-logistic curve through Quantitative Technology forecasting. Steven R.
we take some other value: the saturation level is about Walk (2011) ASEE Annual Conference and Exposition,
910 ha, which can be achieved after 2015. Visual Vancouver Canada
observation of the fitted curves as well as analysis of [15] Fisher J.C. & Pry R. A simple substitution model for
the residuals show that the bi-logistic model fits better Technological Change. Technological Forecasting & Social
that a simple logistical curve so this indicates the Change Vol. 3, pp. 75-78.
superiority of the bi-logistic. The logistic growth has
[16] Technological Forecasting. Ayse Kay Firat, Wei Lee
proven useful in forecasting a wide variety of Woon, Stuart Madnick. Working paper, September 2008.
processes in the growth of systems. However,
complex systems rarely follow a single S-shaped [17] Cesare Marchetti. Human Population Dynamics
curve. The Bi-logistic function is more effective in Revisted with the logistic Model : How much can be
modeling systems that contain two logistic growth modeled and predicted? Technological Forecasting&Social
Change. Vol.52, 1-30(1996)
pulses. The Bi-logistic is attractive because it is a
prudent model to which we can still make clear [18] Cesare Marchetti Time patterns of Technological choice
physical interpretations. options. The formulation of time: Preferences in a
Multidisciplinary Perspective. Gower Publishing Co.,
REFERENCES Aldershotpp. 66-77 (1990)
[1] Logistic Equations in tumour growth modeling. Urszula
Fory’s, Anna Marciniak-Czochra. Int. J. Appl. Math. Comput.
Sci. 2003, Vol. 13, 317-325
[2] Logistic Function as a forecasting model : It’s application
to business and economics. Romell Ambal Ramos.
International Journal of Engineering and Applied Sciences,
march 2013.Vol. 2, No.3
www.jmest.org
JMESTN42351100 2653You can also read