The AIR Typhoon Model for Japan - AIR Worldwide
←
→
Page content transcription
If your browser does not render page correctly, please read the page content below
The AIR Typhoon   In 2018 and 2019, four powerful

Model for Japan
                  typhoons struck Japan, incurring
                  total insured losses of more
                  than USD 30 billion from wind,
                  precipitation-induced flooding, and
                  storm surge damage. As the number
                  and value of properties in Japan’s
                  risk-prone areas continues to grow, it
                  is essential for companies operating
                  in this market to have the tools that
                  will help effectively manage and
                  mitigate the financial risks from
                  future devastating typhoons.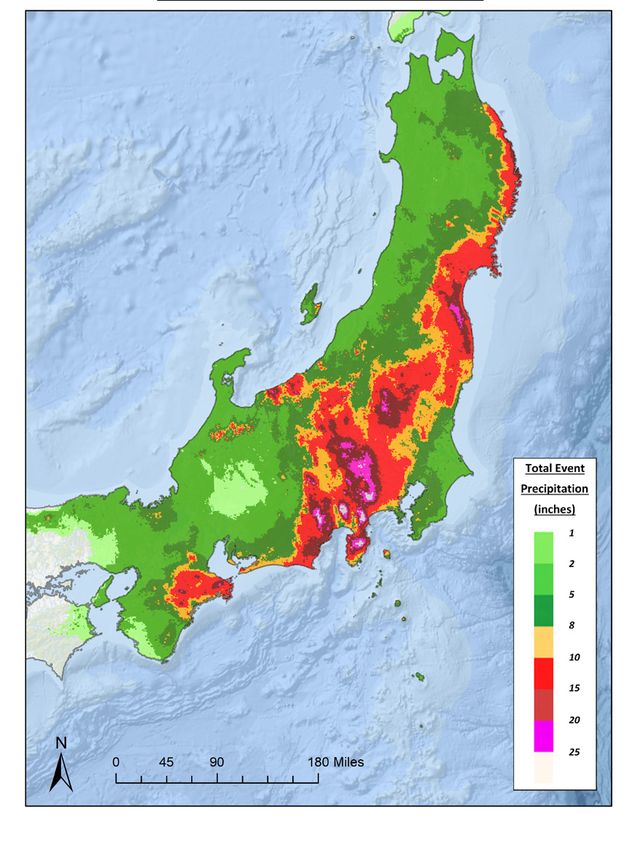
THE AIR TYPHOON MODEL FOR JAPAN

    While in the context of Japan’s recent      The AIR Typhoon Model for Japan—part of AIR’s Northwest
                                                Pacific Basinwide Typhoon Model—provides a realistic view
    typhoon history, the losses for the         of potential losses from tropical cyclones with a catalog

    back-to-back seasons of 2018 and            incorporating cutting-edge science that best reflects the
                                                current understanding of the spatial-temporal characteristics
    2019 seem high, we know that if             of tropical cyclones in this basin. To facilitate risk assessment

    Typhoon Ida (1958) and Typhoon              and risk differentiation at a highly granular level, the model
                                                incorporates the latest engineering research in the resilience of
    Vera (1959) were to recur today,            local construction to the perils of typhoon winds, precipitation-
                                                induced flooding, and storm surge.
    the losses would be even higher.
    In the stochastic catalog of the AIR        Robust Catalog Leverages Data from Leading
                                                Regional Organizations
    Typhoon Model for Japan, there are          The model features a large catalog of simulated events that

    698 instances of aggregated insured         appropriately characterizes the frequency, track, and other
                                                meteorological aspects of potential future storms. To create
    losses from two consecutive years of        this catalog, AIR scientists utilized historical data provided

    storm activity totaling more than USD       by leading regional organizations, including the Japan
                                                Meteorological Agency (JMA) and the Shanghai Typhoon
    30 billion, 251 of which total more         Institute (STI). Based on these comprehensive data sets, the
                                                AIR model features a 10,000-year catalog containing 193,000
    than USD 50 billion. All four significant   simulated loss-causing events ranging from tropical storm to
    2018/2019 typhoons—Jebi, Trami,             super typhoon.

    Faxai, and Hagibis—are included as          Wind Hazard Modeling Reflects Latest Research
    historical events in the AIR model,         on Regional Typhoon Behavior
                                                Observation data indicate that the central pressure–wind speed
    while extensive loss data from these        relationship is different in different ocean basins. For example,

    and other recent storms affecting the       for the same central pressure, typhoons in the Northwest Pacific
                                                tend to have lower wind speeds than hurricanes in the North
    Japanese insurance market have been         Atlantic. In the AIR model, the generation of a typhoon’s local

    used to validate model results.             wind field involves computing winds aloft at each point in the
                                                model domain using a central pressure–wind speed relationship
                                                that incorporates region-specific data to best reflect the
                                                current understanding of winds generated by Northwest Pacific
                                                typhoons.

                                                The model’s wind field formulation is further supported by
                                                the latest available data and scientific literature on the rate of
                                                decrease in wind speeds after landfall. Overestimating this rate
                                                can significantly underestimate inland losses.

2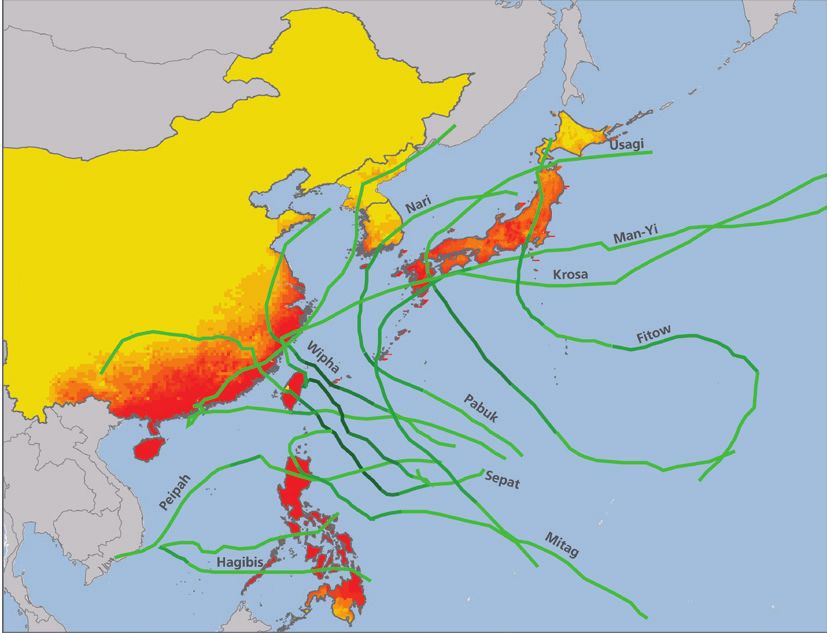
THE AIR TYPHOON MODEL FOR JAPAN
A Comprehensive Approach to Assessing Regional Risk
Today, insurers and reinsurers operating globally
need the ability to quantify the risk to policies and
portfolios that span multiple countries—particularly
in the Northwest Pacific Basin, where, given the
configuration of landmasses, more than half of all
landfalling typhoons affect more than one country.
To provide a consistent and comprehensive view of
risk to companies with regional portfolios, AIR has
developed a unified basinwide catalog shared by all
modeled countries in the Northwest Pacific basin.
The catalog enables seamless risk assessment for
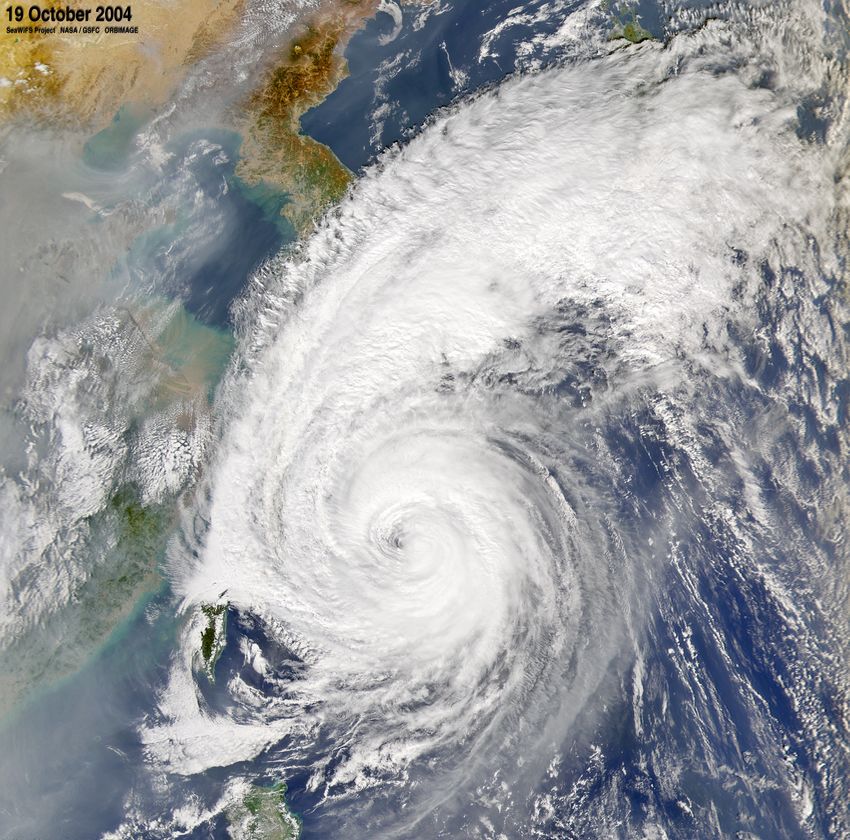
multi-country policies and portfolios, an approach of The majority of storms during the 2007 Northwest Pacific
typhoon season impacted more than one country.
critical importance to global companies.
Climate Change And Japan Typhoon Risk
ALERT - AIR LOSS ESTIMATES IN AIR incorporates the current and near-current climate in
REAL TIME our catastrophe models to account for climate change
AIR’s ALERT™ (AIR Loss Estimates in Real Time™) impacts. For the AIR Typhoon Model for Japan, AIR
has provided estimates of insured losses from Japan extensively researched the latest scientific literature on
typhoons in real time since 2000. AIR uses the storm how tropical cyclone wind, storm surge, and precipitation-
parameters reported by the Japan Meteorological induced flood events have changed and will change to
Agency, including forecast track, landfall location, ensure these trends are appropriately captured.
wind speeds, and precipitation, to produce a realistic
distribution of potential industry losses, as well as
tools for insurers to assess the impact of each storm
on their own portfolios. ALERT keeps companies
well-informed at critical times, allowing them to
communicate effectively within their organizations
and set expectations for the insured and other
stakeholders. AIR’s real-time loss estimates can
help insurers manage reserves and determine if
reinsurance is adequate; ALERT can also help
insurers decide how and where to effectively deploy
claims resources, and even to understand where
to suspend or continue writing business. Timely
information is also extremely valuable in light of
increasingly common financial instruments for
hedging against catastrophe losses. Comparison of observed (1979-2018) and AIR-modeled (1951-
2006) annual landfall frequency distributions by relative storm
intensity for selected regions (a weak-landfalling storm is defined
as a storm with a central pressure no less than 965 mb when
making landfall, while strong storms are those having landfall
central pressure less than 965 mb).
3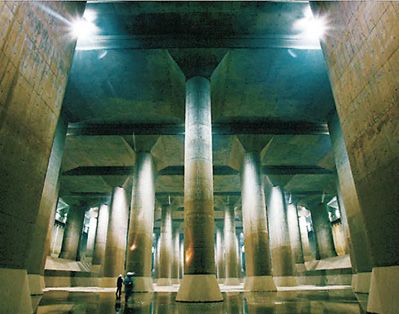
THE AIR TYPHOON MODEL FOR JAPAN

    Precipitation-Induced Flood Module                                  types of flooding—riverine floods and flash floods—is explicitly
    Incorporates Detailed Information on Soil                           quantified for a comprehensive flood risk assessment in the
    Characteristics, Land Use/Land Cover, and                           country. To ensure the most accurate view of flood risk, AIR’s
    Topography                                                          model also accounts for extratropical transitioning, which can
    Precipitation-induced flooding can be a major driver                lead to an increase in the size of a storm’s precipitation field.
    of insured loss from typhoons impacting Japan. Unlike
    typhoon winds, which generally decrease as storms
    move inland, the intensity of tropical storm–induced
    precipitation can actually increase in inland regions.
                                                                             COMPREHENSIVE VIEW OF
    Furthermore, the precipitation footprints of typhoons
                                                                             WATER-RELATED PERILS RISK
                                                                             Users of the AIR Typhoon Model for Japan and the
    typically extend for hundreds of kilometers (as opposed
                                                                             AIR Inland Flood Model for Japan can easily assess
    to tens of kilometers for the wind footprint); thus, even
                                                                             the risk of tropical cyclone precipitation-induced
    storms hundreds of kilometers offshore can cause
                                                                             flood, non-tropical cyclone precipitation-induced
    significant flood damage on land.
                                                                             flood, and storm surge for a comprehensive view of
                                                                             water-related perils risk across Japan.

                                                                        Storm Surge Module Incorporates High-
                                                                        Resolution Bathymetry and Terrain and Storm
                                                                        Surge Elevation Data
                                                                        Although little correlation exists between typhoon wind speed
                                                                        and precipitation intensity, storm surge is strongly correlated
                                                                        with wind speed. Other factors influencing the storm surge
                                                                        threat include bathymetry and tide. A given typhoon will typically
                                                                        produce a larger storm surge along a coastline with shallow
                                                                        bathymetry than one with steep bathymetry. Background
                                                                        astronomical tide level—that is, the water height that would
                                                                        have been observed in the absence of a storm—influences
                                                                        the total water level seen during a tropical cyclone event. In
                                                                        addition, coastal defenses and levees have an impact on water
                                                                        levels, mitigating the effects of storm surge. Through the use
                                                                        of high-resolution bathymetry and terrain elevation data and by
                                                                        accounting for detailed coastal defense and levee information,
                                                                        the storm surge module simulates a storm surge event from its
                                                                        inception to its farthest extent inland.
    Total event precipitation (inches) of Typhoon Hagibis (2018), the
    wettest tropical cyclone in Japan's recorded history.

    The AIR model employs a separate module that is
    used to determine the spatial and temporal distribution
    of accumulated runoff in rivers and over land. High-
    resolution data on soil, land use/land cover, and slope
    are all used to simulate the hydrological response to
    precipitation over the model domain. Risk from both

4
THE AIR TYPHOON MODEL FOR JAPAN
— Damage functions that account for the duration of
high winds at a building’s location
ACCOUNTING FOR JAPAN’S — Method for estimating business interruption that
ENGINEERED FLOOD DEFENSES varies by occupancy and accounts for business
Japan continues to invest heavily in flood risk
characteristics (i.e., resilience, the ability to relocate)
reduction measures by increasing the level of flood
and building size and complexity
defenses, including levees, dams, cisterns, and
— Detailed age bands for wood frame buildings
storm drains. To provide the most accurate view of
— Unknown damage functions for wind, precipitation-
flood risk possible, the AIR model accounts for the
induced flood, and storm surge that vary by
designed capacity of flood defenses, as well as their
prefecture
current state of repair, which can differ notably from
— Flood damage estimations that account for existing
design conditions. The details of coastal defenses
flood defenses
and levees are critical for accurately simulating the
— Five secondary risk characteristics for both the
storm surge, especially in areas such as Hiroshima
precipitation-induced flood and storm surge modules
and Saga prefectures.
support: foundation type, custom protection, custom
elevation, floor of interest, and first floor height
— Damage functions that support specialized risks,
which include large industrial facilities, composite
construction classes (to support Japan’s old and new
fire codes), marine hull, railways, and buildings under
construction
— Employs a detailed, component-based approach for
industrial facilities
— Support for marine, fine art, and specie lines of
business, with 20 construction codes for asset types
and 12 occupancy codes for storage conditions,
enabling 107 distinct asset/storage risk combinations
Variability in Regional Building Practices
An underground cistern north of Tokyo (Source: Yomiuri
Shimbun).
Captured with Regional Vulnerabilities
The AIR Typhoon Model for Japan employs a detailed
view of the temporal and spatial variation of vulnerability—
incorporating findings from a comprehensive study of
Damage Functions Provide Robust View local construction practices and building codes—that
of Wind, Precipitation-Induced Flood, and supports peril-specific damage functions for wind,
Storm Surge Risk precipitation-induced flood, and storm surge, allowing the
Based on engineering studies, post-disaster surveys model to appropriately estimate losses even when not all
following recent storms, and analyses of a large set the building characteristics are known. For engineered
of claims data, AIR engineers have developed peril- buildings, regional vulnerabilities were developed using
specific, intensity-based damage functions for 62 different design specifications from the Architectural Institute
construction classes and 116 occupancy classes in of Japan. For non-engineered structures—those not
Japan. Further highlights of the AIR model’s vulnerability constructed to meet national codes—these vulnerabilities
module include: are based on the composite hazard: wind, seismic
— Separate damage functions for the wind, activity, and snow load.
precipitation-induced flood, and storm surge perils
— Peril-specific damage functions that vary by building
height, construction, and occupancy
5THE AIR TYPHOON MODEL FOR JAPAN
AIR’s Industry Exposure Database for major typhoons since 1991, from representative companies.
Japan AIR’s comprehensive approach to validation confirms that
AIR’s industry exposure database for Japan is a detailed overall losses are reasonable and that the final model output
collection of information on exposures—including the is consistent with both basic physical expectations of the
occupancy and physical characteristics of structures, underlying hazard and unbiased when tested against historical
such as construction types and height classifications. and real-time information.
AIR’s industry exposure database is the foundation for all
modeled industry loss estimates. It provides risk counts Separating Wind, Precipitation-Induced Flood,
with replacement value breakdowns by line of business and Storm Surge Losses for More Accurate
(LOB) and coverage, with take-up rates for wind and flood Model Results
risk that reflect market conditions. Insurance coverage for wind damage is automatically included
in standard fire insurance policies. Flood and surge coverage are
Companies can use our industry exposures to benchmark treated as “water” coverage and must be purchased separately
their own exposures, better estimate the vulnerability of from wind. Policy conditions in Japan differ significantly for
unknown exposures, disaggregate exposures down to a water-related perils—including precipitation-induced flood and
detailed level (1 km2), and assess real-time losses. storm surge perils—as compared to the wind peril. Touchstone®
allows users to input separate policy conditions for wind and
Comprehensive Approach to Validation water-related perils, and obtain separate loss estimates for the
To produce realistic and robust model results, AIR three sub-perils, leading to more accurate loss estimates.
builds its models from the ground up, validating each
component independently against multiple sources. AIR Results can be made more accurate if disaggregation is applied
modeled wind speeds, precipitation totals, and storm to exposure data submitted at the aggregate level. Innovative
surge inundation depth are validated using Ministry disaggregation techniques available in Touchstone distribute
of Land, Infrastructure, Transport, and Tourism (MLIT) prefecture-level, ku-level, or yubin-level exposure data down to
data and AMeDAS and buoy data from the Japan a high-resolution grid based on distributions in AIR’s detailed
Meteorological Agency. industry exposure database for Japan.
AIR also validates top down, comparing modeled losses
to industry loss estimates and company data. Modeled
losses for the AIR Typhoon Model for Japan have been
validated against actual loss and claims data from
Observed (Trended)
Modeled
Modeled losses for select events
Insured Loss
compare well to observed losses based
on individual company data. Note that
for early events, such as Vera and
Nancy, where observed losses are not
available, industry loss estimates are
used for comparison.
Ta , 06
4
4
9
4
91
93
1
18
8
04
11
5
05
59
9
9
,0
,0
,1
98
,0
,6
,1
,1
i,1
,9
an
e,
y,
da
is
ge
ri,
s,
i,
da
i,
,
cy
xa
bi
i,
au
ra
rt
am
nc
ab
ill
ib
la
ck
sh
ea
Je
ng
ka
Ba
an
ha
Fa
Ve
ire
Et
ag
Ya
N
an
Vi
M
Tr
To
So
N
C
M
H
Sh
6THE AIR TYPHOON MODEL FOR JAPAN
Model at a Glance
Modeled Perils Tropical cyclone wind, precipitation-induced flood, and storm surge
Model Domain Northwest Pacific Ocean and the Japanese archipelago
Supported Geographic Latitude/longitude, JIS/ku/sonpo/yubin, and prefecture
Resolution
Catalogs 10,000-year catalog includes more than 83,000 loss-causing events; historical catalog
comprises 21 events, including Jebi (2018), Trami (2018), Faxai (2019), and Hagibis (2019); and
one Lloyd’s realistic disaster scenario (RDS) and four extreme disaster scenarios (EDS) are
provided
Supported Construction — 62 construction classes and 116 occupancy classes
Classes and Occupancies — 107 modeled asset/storage code combinations support diverse marine, fine art, and specie
lines, including marine cargo, inland transit, and builder’s risk
— Supports aviation, marine hull, railways, automobiles, infrastructure, and large industrial
facilities
— Supports five secondary risk characteristics for precipitation-induced flooding and storm
surge to accurately differentiate vulnerability
— When detailed exposure data (e.g., construction type or height) is unavailable, the model
applies an Unknown Damage Function that takes into account the building inventory in
Japan, which varies by prefecture
Supported Policy Supports a wide variety of location, policy, and reinsurance conditions, as well as Extra
Conditions Expenses and Debris Removal; and complex policies that are commonly used in Japan, such
as endowment or step policy functions
Model Highlights
— Basinwide modeling in the Northwest Pacific enables companies to estimate losses seamlessly for policies and portfolios
that span multiple countries and territories
— Incorporates central pressure–wind speed relationship specific to the Northwest Pacific basin
— Explicit modeling of wind, precipitation-induced flooding, and storm surge
— Peril-specific vulnerability framework accounts for damage to buildings, contents, and business interruption from wind,
precipitation-induced flooding, and storm surge
— Accounts for regional variations in building vulnerability due to multi-hazard environment
— Accounts for the impact of flood defense systems in mitigating flood risk
— AIR’s industry exposure database for Japan reflects replacement values and policy conditions
— Touchstone enables users to run wind/flood/surge scenarios and can distribute aggregated exposure data down to a 1-km
resolution grid based on distributions in AIR’s detailed industry exposure database
7ABOUT AIR WORLDWIDE AIR Worldwide (AIR) provides risk modeling solutions that make individuals, businesses, and society more resilient to extreme events. In 1987, AIR Worldwide founded the catastrophe modeling industry and today models the risk from natural catastrophes, supply chain disruptions, terrorism, pandemics, casualty catastrophes, and cyber incidents. Insurance, reinsurance, financial, corporate, and government clients rely on AIR’s advanced science, software, and consulting services for catastrophe risk management, insurance- linked securities, longevity modeling, site-specific engineering analyses, and agricultural risk management. AIR Worldwide, a Verisk (Nasdaq:VRSK) business, is headquartered in Boston with additional offices in North America, Europe, and Asia. For more information, please visit www.air-worldwide.com. For more information about Verisk, a leading data analytics provider serving customers in insurance, energy and specialized markets, and financial services, please visit www.verisk.com. ©2021 AIR Worldwide
You can also read