Nitrogen Dioxide in the United Kingdom - Summary AIR QUALITY EXPERT GROUP
←
→
Page content transcription
If your browser does not render page correctly, please read the page content below
AIR QUALITY EXPERT GROUP

Nitrogen Dioxide in
the United Kingdom
Summary

Prepared for:
Department for Environment, Food and Rural Affairs;
Scottish Executive; Welsh Assembly Government; and
Department of the Environment in Northern Ireland

This is the first report produced by the Air Quality Expert Group.

United Kingdom air quality information received from the automatic monitoring sites and
forecasts may be accessed via the following media:

Freephone telephone helpline: 0800 556677
Teletext page 156
Internet www.airquality.co.uk
         www.defra.gov.uk/environment/airquality

Department for Environment, Food and Rural Affairs
Nobel House
17 Smith Square
London SW1P 3JR
Telephone 020 7238 6000
Website: www.defra.gov.uk

© Crown copyright 2004

Copyright in the typographical arrangement and design rests with the Crown.

This publication (excluding the logo) may be reproduced free of charge in any format or
medium provided that it is reproduced accurately and not used in a misleading context.
The material must be acknowledged as Crown copyright with the title and source of the
publication specified.

This document is also available on the AQEG website:
http://www.defra.gov.uk/environment/airquality/aqeg

Published by the Department for Environment, Food and Rural Affairs. Printed in the UK
April 2004, on recycled paper containing 80% post-consumer waste and 20% totally chlorine
free virgin pulp.

Product code PB 9144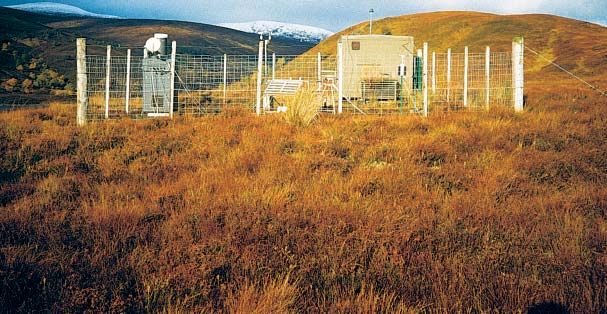
1

          Introduction
Following the publication of the ‘Air Quality Strategy for England, Scotland, Wales and Northern Ireland’,
the Air Quality Expert Group (AQEG) was set up in 2002. It aims to help the UK Governments tackle air
pollution by examining where pollutants come from and what their concentrations are in the UK.

This is a summary of AQEG’s first report on nitrogen dioxide that is aimed at the general public.
We have also included a glossary at the back to explain certain terms (these are shown in bold the
first time they appear in the document).

         What is nitrogen dioxide                                             NO2 and the UK
         and how does it affect                                               Air Quality Strategy
         the environment?                                             The concentration of NO2 is measured in
                                                                      micrograms in each cubic metre of air (µg m-3).
Nitrogen dioxide is a brown gas, with the chemical
                                                                      A microgram (µg) is one millionth of a gram. A
formula NO2. It is chemically related to nitric oxide
                                                                      concentration of 1 µg m-3 means that one cubic
(nitrogen monoxide), a colourless gas with the
                                                                      metre of air contains one microgram of pollutant.
chemical formula NO (Figure 1). These
                                                                      To protect our health, the UK Governments set
abbreviations are often used instead of writing the
                                                                      two air quality objectives for NO2 in their
names of the chemicals in full. We will follow this
                                                                      Air Quality Strategy:
practice in this report.
                                                                      1. The hourly objective, which is the concentration
Figure 1 A diagram of the structures of NO2 and NO.                      of NO2 in the air, averaged over a period of one
                                                                         hour. This is designed to make sure that we are
                                                                         not exposed to high concentrations of NO2 for
                                                                         short periods of time. High concentrations can
                                                     nitric oxide        arise in episodes, which are usually associated
     nitrogen dioxide                           (nitrogen monoxide)
           NO2                                             NO            with particular weather conditions.
                        represents a nitrogen atom
                        represents an oxygen atom                     2. The annual objective, which is the
                                                                         concentration of NO2 in the air, averaged over a
Together, NO and NO2 are known as NOX. NOX                               period of a year. This aims to protect us from
is released into the atmosphere when fuels                               being exposed to NO2 over a long time.
are burned (for example, petrol or diesel in a car                    The European Union (EU) has also developed
engine, or natural gas in a domestic central-                         legislation to limit our exposure to air pollutants,
heating boiler or power station). NO2 can affect                      through what are known as limit values. Table 1
our health. There is evidence that high levels of                     shows the objectives and limit values for NO2.
it can inflame the airways in our lungs and, over                     The values of both are the same, but the UK Air
a long period of time, affect how well our lungs                      Quality Strategy aims to achieve its objectives
work. People with asthma are particularly affected.                   earlier than the EU has set. Local authorities must
NO2 can also affect vegetation.                                       identify areas where NO2 concentrations are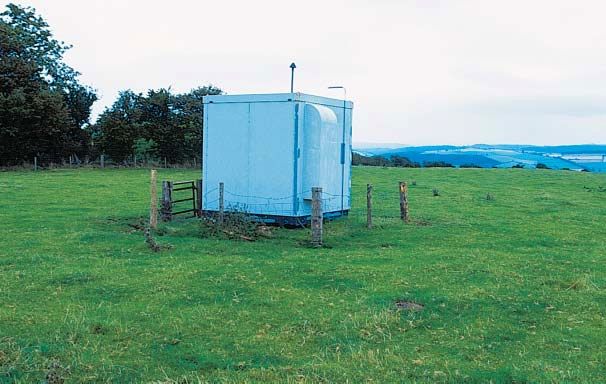
2

higher than the objectives (and limit values) and                       levels to limit emissions of NOX, for example from
develop local measures to put things right.                             road vehicles and power stations, in order to
Legislation is also set at national and European                        control concentrations of NO2 in the air.
Table 1 EU limit values and the UK Air Quality Strategy objectives for NO2.

Legislation                                        Hourly                                        Annual                Achieve by

EU First Daughter                                  200 µg m-3 with no more than                  40 µg m-3             2010
Directive (99/30/EC)                               18 exceedences per year

Air Quality Strategy (2000)                        200 µg m-3 with no more than                  40 µg m-3             2005
                                                   18 exceedences per year

For the hourly objective, it is appropriate to have an allowed number of exceedences for the objective. This allows for situations where
it is not practical to expect hourly average concentrations to always be within the allowed limit (for example, where bad weather conditions
can affect concentrations).

         Where does                                                     predictions through to 2020. The emissions are
                                                                        divided into their different sources. The figure
         NO2 come from?                                                 shows that overall emissions of NOX fell by 37%
NOX is produced when fossil fuels (coal, natural                        from 1990 to 2000, mainly due to reductions in
gas and so on) are burned. When a pollutant                             emissions from road transport and power stations.
is released directly into the atmosphere it is known                    We expect emissions to reduce by a further
as an emission. Figure 2 shows the total                                25% by 2010.
emissions of NOX in the UK since 1970, with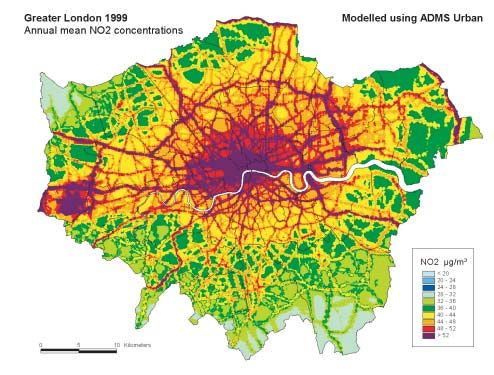
3

Figure 2 NOX emissions in kilotonnes in the UK by source from 1970 to 2020.

                         3000
                                                                                               Source:
                                                                                                   Other
                         2500
                                                                                                   Non-road
                                                                                                   transport and
                                                                                                   machinery
                         2000
         NOx emissions

                                                                                                   Road transport

                                                                                                   Domestic
                         1500
                                                                                                   Industry

                         1000                                                                      Power stations

                          500

                            0
                                1970 1975 1980   1985 1990 1995   2000 2005 2010 2015   2020

Road transport is the largest source of NOX                        this source. One reason for this is as a side-effect
emissions in the UK, contributing 49% of total                     of measures that have been developed to reduce
emissions in 2000. However, emissions from road                    emissions of particulate matter from diesel
transport have fallen by 34% between 1990 and                      vehicles by treating the exhaust using diesel
2000. This is due to improvements in engine                        particulate filters. These primary NO2 emissions
design and fitting three-way catalysts to petrol                   can lead to high concentrations of NO2 at the
cars, to meet increasingly strict European                         roadside, especially where there are many diesel
standards. The importance of road transport is                     vehicles.
even greater in urban areas, but we expect these
                                                                   NO2 is also formed in the atmosphere in a
emissions to reduce greatly by 2010 (by about
                                                                   chemical reaction between NO and ozone (O3):
50%, in London, for example, compared with
                                                                                  NO + O3 → NO2 + O2
1999 values). By contrast, we expect domestic
                                                                                     ozone     oxygen
and commercial emissions in central London
(mainly from heating), which currently contribute                  Because this NO2 is not released straight into the
25%, to increase over the next 10 years.                           atmosphere, but is formed there by a chemical
                                                                   reaction, it is known as secondary NO2.
NOX emissions from burning fossil fuels are mainly
                                                                   Sometimes this reaction cannot take place
as NO, but some sources can release a lot of NOX
                                                                   because there is not enough O3 for the NO to
as NO2. These primary NO2 emissions are
                                                                   react with. This is most common close to where
particularly important from diesel vehicles
                                                                   NO is released, for example, near to busy roads.
(especially when moving slowly), and can make up
as much as 25% of the total NOX emissions from
4

    Box 1                                                      How is NO2 measured
    The formation of                                           and how much is there
    ground-level ozone                                         in the atmosphere?
    Like NOX, volatile organic compounds              Nitrogen dioxide is measured continuously using
    (VOCs) are emitted into the atmosphere            an instrument called a chemiluminescence
    through the burning of fossil fuels. They also    analyser. There are networks of over 200
    come from several other sources, both             monitoring sites, using chemiluminescence
    domestic and industrial, such as the production   analysers, throughout the UK (Figure 3).
    and use of paints. Vegetation also emits VOCs.    The main networks are:
    Sunlight causes chemical reactions to occur
                                                      ●   The Automatic Urban and Rural Network
    between VOCs and NOX, which leads to ozone
                                                          (AURN) – funded mainly by the UK
    formation. Ozone also affects your health,
                                                          Governments, but with some local
    especially if you have asthma.
                                                          authority sites.
    The chemical reactions occur quite slowly,
                                                      ●   The London Air Quality Network (LAQN), which
    over hours or days. During this time, winds
                                                          is made up only of local authority sites.
    can move the air over considerable distances
    – hundreds of kilometres. As a result,            Other monitoring sites are run by groups such as
    measures to control ozone have to be              local authorities, the Highways Agency and the
    developed internationally, since, for example,    electricity generating companies.
    emissions in continental Europe can influence     As part of their report, AQEG assessed NO2
    ozone concentrations in the UK.                   concentrations during 2001 for 212 automatic
    As air containing ozone crosses a city, it gets   monitoring sites, and then looked at information
    mixed with air containing NOX from the urban      from 15 of these sites in detail. The analysis
    emissions. A reaction then occurs between         showed that annual average NO2 concentration
    NO and ozone, forming NO2. The formation          above 40 µg m-3 (the objective for 2005 and limit
    of this secondary NO2 depends on the amount       value for 2010, see Table 1) were measured at
    of ozone that is brought to the city from         most roadside and kerbside sites in London and
    background locations. Importantly, measures       at about half of the background sites (see Box 2
    to reduce NOX can lead to reductions in NO2,      for an explanation of these terms). Exceedences
    but may also increase ozone, because there        outside London were mainly at roadside and
    is less NO to react with it and hence remove      kerbside monitoring sites. The measurements
    it from the air.                                  show that the annual average is the most impor-
                                                      tant assessment objective for NO2 – that is, it is
                                                      much more difficult to meet the annual average
                                                      objective than the hourly objective (see Table 1).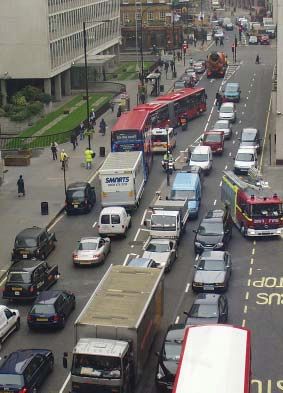
5

                                                                           Figure 3 Location of NO2 monitoring sites in 2001
                                                                           used in the AQEG study.

AURN, Automatic Urban and Rural Network; LAQN, London Air Quality Network; KAQN, Kent Air Quality Network; HBAPMN, Hertfordshire
and Bedfordshire Air Pollution Monitoring Network; Calibration club, run by Local Authorities but with data handling managed by a single
company; Heathrow, run by Heathrow Airport Ltd.; JEP Innogy and JEP Powergen, run by power generators.
6
Box 2
Definition of
the types
of monitoring site
Monitoring sites within the
networks are located across the
Urban Centre Suburban
UK. These range from sites that
Sites away from roads in city Sites typical of residential areas
are strongly affected by local
and town centres (for example, on the outskirts of a town or
pollution sources (such as road
pedestrian precincts and city. For example, Hillingdon,
traffic or industrial processes) to
shopping areas). For example, London.
sites within remote or rural areas.
Glasgow Centre, Scotland.
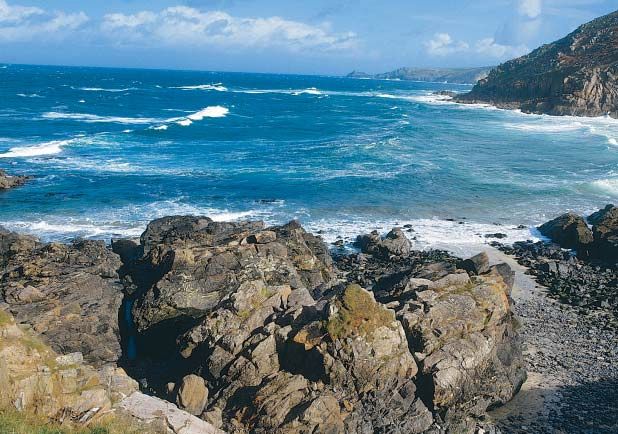
Rural
Kerbside Urban Background
Sites in the open country away
Sites with sample inlets within Urban locations (for example,
from roads, industrial areas and
one metre of the edge of a busy parks and urban residential
where people live. For example,
road. For example, Marylebone areas) away from emission
Aston Hill, Wales.
Road, London. sources. These locations broadly
represent city-wide background
concentrations. For example,
Londonderry, Northern Ireland.
Remote
Roadside
Sites in the open country in
Sites with sample inlets between
isolated rural areas, that only
one metre of the edge of a busy
Urban Industrial have regional background
road and the back of the
Sites where industrial emissions pollution concentrations for
pavement (usually five metres
make an significant contribution most of the time. For example,
from the roadside). For example,
to measured pollution Strath Vaich, Scotland.
Hounslow Roadside, London.
concentrations. For example,
Grangemouth, Scotland.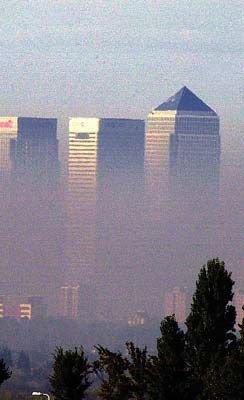
7
Trends in concentrations An assessment of rolling annual average
concentrations at 11 background and roadside
of NO and NO2 sites in London since 1996 shows that, on
An analysis of measured concentrations of NO average, NOX concentrations have dropped to
and NO2 over the last 10 years shows that annual 70% of the 1996 values. By contrast, NO2 in 2001
average concentrations of NOX at urban were, on average, 88% of their 1996 values. This
background and urban centre sites (Figure 4) fall in concentrations of NOX measured in the
have gone down faster than NO2 concentrations atmosphere matches the fall in the amount of NOX
(Figure 5). that was emitted from the burning of fossil-fuels.
225
Figure 4 Annual average
NOX concentrations at 200
Annual average NOx (µg m-3, as NO2)
selected urban centre and
175
urban background sites.
150
125
100
75
50
25
0
1983
1984
1985
1986
1987
1988
1989
1990
1991
1992
1993
1994
1995
1996
1997
1998
2000
2001
90
Figure 5 Annual average
NO2 concentrations at 80
selected urban centre and
Annual average NO2 (µg m-3)
70
urban background sites.
60
50
40
30
20
10
0
1983
1984
1985
1986
1987
1988
1989
1990
1991
1992
1993
1994
1995
1996
1997
1998
2000
2001
Bridge Place London Bloomsbury London Bexley
West London Manchester Town Hall Glasgow City Chambers
Belfast Centre Port Talbot Lullington Heath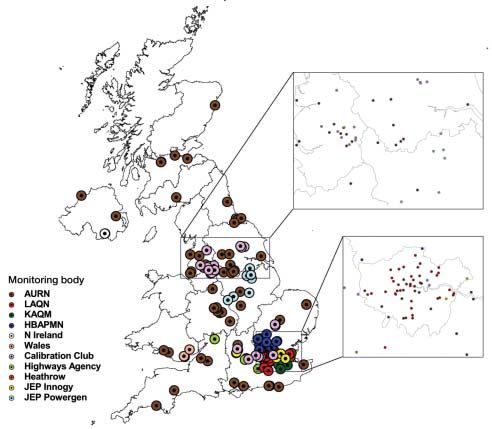
8

Similar trends (a smaller decrease in NO2 concen-             What are the
trations than in NOX concentrations) were also
seen for roadside and kerbside sites, although
                                                              concentrations in places
these results are for a shorter period of time. The           without monitoring sites?
smaller fall in NO2 concentrations is due to both             How do you predict
increases in emissions of primary NO2 over the
last few years and details of the chemistry by
                                                              future concentrations?
which secondary NO2 is formed.                        We use computer models to assess
                                                      concentrations in places without monitoring sites
Annual average NO2 concentrations monitored at
                                                      and to predict future concentrations of NO2.
urban background sites in the United Kingdom
                                                      These models are of two types:
broadly compare with those monitored across
Europe. Being close to traffic appears to be the      ●   Empirical models that are mainly based
major influence on the annual average NO2                 on analysing the concentrations of different
concentrations monitored at over 1600 sites               air pollutants measured at monitoring sites.
across Europe. Annual average exceedences of              They can be used to estimate NOX
40 µg m-3 NO2 are widespread in urban centres             concentrations in a range of locations and link
across Europe.                                            these concentrations to emissions sources.
                                                          The models are then used to predict future
                                                          concentrations on the basis of estimates of
                                                          future emissions.

                                                      ●   Deterministic models that rely on mathematical
                                                          descriptions of the physical and chemical
                                                          processes that take place in the atmosphere.
9 The report draws on both types of model, and on models based on a combination of the two approaches. Figure 6 shows a map of the estimated annual average background concentrations of NO2. We can also develop a map for roadside concentrations. The model used to make these maps is called the national empirical model. In London, maps have also been made using a model that is a combination of the empirical and deterministic methods (Figure 7). These results show that annual average exceedences of 40 µg m-3 are widespread throughout London near roads with a lot of traffic (Table 2). In the centre of London, exceedences also take place in the areas between main roads and motorways. Outside London, exceedences are mainly in roadside locations. In England roughly one third of the total length of built-up major roads had modelled concentrations of NO2 higher than 40 µg m-3 (in London, this figure is 90%). There are fewer roadside exceedences in Scotland, Wales and Northern Ireland. Figure 6 Annual average background NO2 concentrations (µg m-3) for 2001 estimated using the national empirical model.
10

Figure 7 Annual average NO2
concentrations (µg m-3) for 1999
in London, estimated using a
computer model.

                                                                                           NO2 (mg m-3)
                                                                                               52
          0       5         10 kilometers

         Are there conditions                          ●   Summer episodes take place when the
                                                           weather is hot and sunny and wind speeds are
         that lead to very high                            low. High concentrations of ozone are created
         concentrations of NO2?                            (by the chemical reactions described in Box 1)
Pollution episodes are short periods of very high          and in turn convert more NO into NO2 in areas
levels of pollution. On these occasions it is likely       where high NO emissions are produced, for
that hourly average NO2 concentrations higher              example, at roadsides.
than 200 µg m-3 (see Table 1) will occur. There are    A study of NO2 episodes since 1988 shows that
two types of episode:                                  they have become less common. Over the last
●    In winter, when the ground is cold and there is   few years, summer episodes have become
     little wind, emissions are trapped near to the    relatively less important than winter episodes in
     ground. Winter episodes took place in 1991 in     terms of their contribution to the number of hours
     London and in 2001 in several locations           with concentrations of NO2 over 200 µg m-3.
     (including Belfast, Glasgow and Manchester),
     with hourly average NO2 concentrations
     reaching 700 µg m-3.
11
How are NO2
concentrations
predicted to change
in the future?
We can predict future concentrations of NO2
using models together with estimates of
future emissions. Studies show that
reductions in NOX emissions will lead
to a significant reduction in annual
average exceedences of 40 µg m-3
NO2 at roadside and in
background locations, nationally
and in London.
Table 2 shows the extent of predicted
roadside exceedences for 2005 and
2010, using the national empirical
model. These predictions are
similar to those made by a
different model that looked at
London in detail. Predictions of the
number of exceedences in background locations
are less consistent between different models.
They predict exceedence areas in Greater London
of between 5% and 32% for 2005 and 3% and
13% for 2010.
Figure 8 Predicted annual average
background NO2 concentration (µg m-3) for
2001 estimated using the national empirical
model.12
Table 2 Percentage of major road lengths where in 1999 (Figure 7). They clearly show the
annual average concentrations of NO2 are likely to be predicted reductions in NO2 concentrations.
more than 40 µg m-3.
The emissions estimates show a significant
2001 2005 2010
change in the sources of NOX in central London
Scotland 17 8 2
by 2010. Traffic and the total of domestic and
Wales 5 2 0
commercial emissions are each predicted to
Northern Ireland 5 3 0
contribute roughly one third of the total annual
London 90 65 23
average NOX concentrations, with the final third
Rest of England 33 18 5
coming from a range of other sources.It is clear
UK 35 20 6
from Table 2 that we need much greater
Figures 8 and 9 show the predicted annual reductions in NOX emissions than those predicted
average national background concentrations for 2005 and 2010 if an annual average
for 2010 calculated using the national empirical concentration of 40 µg m-3 is to be met at all
model and the annual average concentrations locations (including the most highly polluted
for London in 2005 calculated with the London areas). To reduce emissions enough to meet the
model. These figures can be compared with objectives of the Air Quality Strategy by 2005 and
those for the UK in 2001 (Figure 6) or for London the EU limit value by 2010 (Table 1), current
national policies need to change.
Figure 9 Predicted annual average
NO2 concentration (µg m-3) for 2005
in London, estimated using
a computer model.13
In the national empirical model, predictions are ozone would lead to more NO being converted
based on the modelled relationship between into secondary NO2, and so to increases in
current NOX and NO2 concentrations. Two things predicted NO2 concentrations.
could lead to the breakdown in this relationship These issues highlight the difficulties of predicting
and to higher NO2 concentrations than predicted. future NO2 concentrations. The changes occurring
in the background ozone depend on emissions
● More NOX emitted as NO2 (for example, from
occurring worldwide, while primary NO2 influences
increased sales of diesel vehicles together with
air quality in the immediate vicinity of the
no improvements in the primary NO2 emissions
emissions. Both have to be taken into account in
from particulate filters) would lead to changes
predictions of future concentrations of NO2.
in the relationship between NOX and NO2 and
to increases in predicted NO2 concentrations.
● There is evidence that background
concentrations of ground-level ozone are
increasing. This increase seems to come
from changes in emissions of NOX and
in atmospheric chemistry in the northern
hemisphere. This increase in background14
Conclusions ● There is strong evidence that heavy-duty diesel
vehicles make a major contribution to NOX
● There are still widespread exceedences of
emissions from UK road transport and to
40 µg m-3 NO2 as an annual average, despite
primary NO2 emissions.
10 years of decreasing NOX concentrations.
Annual average NO2 concentrations show ● There is evidence that background
significantly smaller reductions than NOX concentrations of ground-level ozone are
concentrations. This is due to both increases increasing. This could lead to increases in future
in emissions of primary NO2 over the last few NO2 concentrations, all other things being equal.
years and details of the chemistry by which ● NO2 should not be considered separately from
secondary NO2 is formed. other pollutants. When developing air pollution
● With current national policies, some controls, there may be trade-offs between
exceedences of the annual average objectives different pollutants. For example, some
and limit values for NO2 will remain in 2005 measures to reduce particle emissions from
and 2010. These will be less widespread than diesel vehicles can lead to increased primary
at present but will still be appreciable. If the emissions of NO2. Reductions of NOX emissions
volume of traffic in the future is higher than in cities can lead to increases in ozone,
expected, or if technology to reduce levels of because less ozone is used up in reactions with
pollutants does not have the effect we expect it NO. AQEG also has concerns that much of
to have, exceedences will be more widespread local air quality management at present is
than predicted. influenced by exceedences of one air quality
objective – the annual average of 40 µg m-3 for
NO2. AQEG feels that a more
flexible and holistic approach to air
quality management would create
more effective control strategies.15
Glossary
Air quality objective A target to reduce the concentration of a pollutant below a certain
level. Sometimes, a set maximum number of exceedences are
allowed within a specified timescale.
Air Quality Strategy Report published by the UK Governments, describing plans to
improve and protect air quality in the UK. A copy can be found at:
http://www.defra.gov.uk/environment/airquality/strategy/index.htm
Concentration The amount of a pollutant in a given volume of air.
Emission Direct release of a pollutant into the atmosphere.
Episode A short period of very high concentrations of pollution.
Exceedence A period of time when the concentration of a pollutant is higher
than the appropriate air quality objective.
Limit value Target set by the European Union to reduce the concentration of a
pollutant below a certain level.
Microgram (µg) One millionth of a gram.
Model A mathematical or theoretical way to convert NOX emissions into
NO2 concentrations.
µg m-3 A unit for describing the concentration of air pollutants in the
atmosphere. A concentration of 1 µg m-3 means that one cubic
metre of air contains one microgram of pollutant.
National empirical model Computer model used to estimate pollutant concentrations at
background and roadside sites across all of the UK.
Ozone Toxic, unstable gas, made up of three oxygen atoms. The chemical
formula for ozone is O3. At ground-level, ozone is formed by
sunlight-driven chemical reactions of NOX with VOCs.
Particulate filter Device for reducing emissions of particulate matter from
diesel vehicles.
Particulate matter General term used for a mixture of solid particles and liquid
droplets found in the air.
Primary A pollutant released straight into the atmosphere.16
Rolling annual average Average, or series of averages, calculated for overlapping time
periods. A rolling annual average NO2 concentration calculated
every month uses concentrations from the previous 12 months.
The period of averaging is stepped forward one month for each
value. For example, 01/04/02 – 31/03/03 and then 01/05/02 –
30/04/03. There are therefore 12 possible monthly rolling annual
averages in a year.
Sample inlet Point, usually at the end of a sampling tube, from where air is taken
to be measured by air pollution monitoring instruments.
Secondary A pollutant formed in the atmosphere by chemical reactions.
Three-way catalyst Device fitted to the exhaust of petrol cars to reduce emissions of
carbon monoxide, NOX and VOCs.
VOCs See volatile organic compounds.
Volatile organic Chemicals containing carbon that easily evaporate at room
compounds temperature, for example, benzene. Volatile organic compounds
(VOCs) are released into the air from burning fossil fuels and other
sources. Some VOCs, such as isoprene, are emitted by vegetation.Further information and contacts
Additional copies of this publication may be ordered from:
AQEG Secretariat
Air and Environment Quality Division
4/E14 Ashdown House, 123 Victoria Street, London SW1E 6DE
Telephone: 020 7082 8421
Fax: 020 7082 8385
Email: air.quality@defra.gsi.gov.uk
Current and forecast pollutant concentrations
Freephone helpline: 0800 556677
TELETEXT: Page 156
Internet: http://www.airquality.co.uk
Contacts
England: Department for Environment, Food and Rural Affairs
Air and Environment Quality Division
4/E14 Ashdown House, 123 Victoria Street, London SW1E 6DE
Telephone: 020 7082 8421
Fax: 020 7082 8385
Email: air.quality@defra.gsi.gov.uk
http://www.defra.gov.uk/environment/airquality/
Northern Ireland: Department of the Environment in Northern Ireland
Air and Environmental Quality
1st Floor, Commonwealth House, 35 Castle Street, Belfast BT1 1GU
Telephone: 028 9054 6425
Fax: 028 9054 6424
Email: EP@doeni.gov.uk
http://www.ehsni.gov.uk/environment/air/air.shtml
Scotland: The Scottish Executive
Air Quality Team
1-G North, Victoria Quay, Edinburgh EH6 6QQ
Telephone: 0131 244 7250
Fax: 0131 244 0211
Email: air.quality@scotland.gsi.gov.uk
http://www.scotland.gov.uk/about/ERADEN/ACEU-AQT/00016215/
Wales: The National Assembly for Wales
Department of Environment, Planning & Countryside
Cathays Park, Cardiff CF1 3NQ
Telephone: 029 2082 3499
Fax: 029 2082 3658
Email: environment.division@wales.gsi.gov.uk
http://www.countryside.wales.gov.uk/You can also read