Assessment of measures to improve local air quality in Bergen
←
→
Page content transcription
If your browser does not render page correctly, please read the page content below
Assessment of measures to
           improve local air quality in Bergen
                              Britt Ann K Høiskar, Ingrid Sundvor, Henrik Grythe, Mona Johnsrud,
                                                                   Tormod W Haug and Hilde Solli

                                                                           ABRIDGED VERSION

Abridged version of the assessment of measures, including the City Council’s
decision of 27 September 2017 and revised calculations for particulate matter
                          as of 15 November 2017
Contents

1   Introduction…………………………………………………………………………………4
2   Air pollution and health effects……………………………………………………4
3   Limit values and national air quality targets…………………………………5
4   Air quality monitoring in Bergen, 2002–2016……………………………….9
5   Air quality in Bergen today and projections until 2021………………..11
6   Effect of package of measures…………………………………………………….16
7   Ten-point programme for improved air quality in Bergen……………20
8   Bergen City Council, decision of 27 Sept. 2017, item 230/17……….21
9   References………………………………………………………………………………….23

                                      2
3
1   Introduction
In 2015, the EFTA Court pronounced judgment against Norway for violation of the EU’s
Ambient Air Quality Directive, both for exceeding limit values for local air quality and
because the municipalities’ assessments of measures for improving the local air quality did
not meet the requirements of the Directive. The judgment concerned a number of
municipalities, including Bergen, and the Norwegian Environment Agency has ordered the
City of Bergen to revise the applicable assessment of measures from 2015. The reason for
the order, was, among other things, that the previous assessment had not calculated the
effect of the measures adopted in the action plan.
The Norwegian Institute for Air Research (NILU) has, in cooperation with Urbanet Analyse
AS, prepared a revised assessment of measures for improving the air quality in Bergen. The
assignment was carried out on behalf of the City of Bergen. The work has been carried out in
collaboration with the client and a project group consisting of representatives of relevant
agencies/sections in the City of Bergen, as well as representatives of owners of installations
(the Norwegian Public Roads Administration, Bergen Port Authority), Hordaland County
Council and the County Governor of Hordaland.
The assessments are based on the 2015 action plan and include a revised ten-point
programme consisting of packages of various measures.
As part of the work on the assessment, air quality calculations have been carried out for the
City of Bergen for nitrogen dioxide (NO2) and particulate matter (PM10 and PM2.5) for the
current situation (2015), the reference situation (2021), and the expected effect of a package
of measures to be launched in 2021. The calculations of the reference situation (2021) are
based on the assumption that existing measures will be continued, and expected
developments in key parameters have been taken into account, such as the traffic load, the
composition of vehicles and population growth.
The assessment of measures and the pertaining action plan were adopted by the City
Council on 27 September 2017. The action plan is presented in section 7 and the City
Council’s decision in section 8.
Revised calculations of particulate matter
After the City Council’s consideration, an error was discovered in the calculations of
emissions of particulate matter from wood burning. As a consequence of this error, new
calculations have been carried out for particulate matter (PM2.5 and PM10). The new
calculations do not change the main conclusions in the assessment of measures that formed
the basis for the City Council’s decision. On the contrary, the results show that the adopted
measures have a greater effect on concentrations of both PM10 and PM2.5 than the previous
calculations did.
In this abridged version of the assessment, the main results are presented together with
revised calculations for particulate matter.
2   Air pollution and health effects
Efforts to improve the air quality in Norwegian towns and cities aim to reduce undesirable
health effects of polluted air. Air pollution is a serious health problem worldwide, and it also
affects the health of people living in Norway’s towns and cities. The most important

                                               4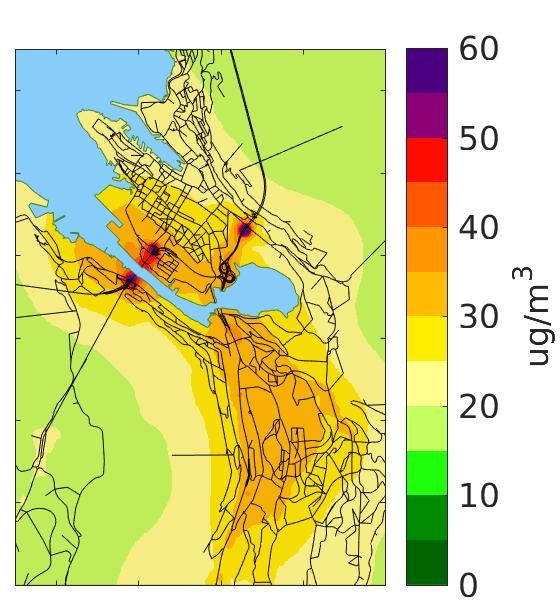
polluting components in Norwegian towns and cities are nitrogen dioxide (NO2) and
particulate matter (PM10 and PM2.5).
Nitrogen oxides (NO and NO2, referred to as NOX) are reactive gases formed during
combustion at high temperature. Emissions from road traffic (exhaust) are the most
important source of NOx in Norwegian towns and cities. Nitrogen dioxide is not harmful in
itself in the concentrations found in Norwegian towns and cities, but it reacts with available
tropospheric ozone (O3) to create a further NO2 contribution that is far more harmful to
health.
The most important health effects of NO2 are reduced pulmonary function and a worsening
of respiratory diseases, such as asthma and bronchitis. Persons with reduced pulmonary
function and chronic respiratory diseases are most at risk of suffering health effects from
NO2.
Particulate matter are fine particles that act as gas and are mixed with and transported by
air. Particulate matter is divided into two fractions. PM2.5 are the smallest particles, with a
diameter of 2.5 micrometres or less. PM10 are particles with a diameter of between 2.5 and
10 micrometres. PM2.5 mainly comes from combustion (wood burning, car exhaust), while
the bigger particles come from agitated road dust and tyre wear. The smallest particles can
travel far by air, and such long-range pollution can also make a significant contribution to the
concentration of PM2.5 in Norwegian towns and cities.
Particulate matter can cause different types of health effects depending on the physical and
chemical properties of the particles. For example, size will have a bearing on how deep the
particles are inhaled into the airways. Surveys from all over the world show a connection
between increased levels of particulate matter in the air and the number of hospitalisations
and deaths in the population. Exposure to particulate matter can trigger inflammatory
reactions that can lead to the development and worsening of pulmonary diseases and
cardiovascular diseases. Research also indicates a connection between exposure to
particulate matter and effects on foetal development, the nervous system and metabolism.
3    Limit values and national air quality targets
In Norway, there are three different management objectives for local air quality: the
Pollution Regulations, the Government’s national targets for local air quality, and air quality
criteria adopted by the Norwegian Environment Agency and the Institute of Public Health.
Legal authority for the Pollution Regulations is found in the Pollution Control Act, and the
Regulations were adopted in 2002 based on the EU’s Ambient Air Quality Directive.1 The
Regulations apply to all outdoor air and set out requirements for measurements,
calculations, reporting, assessment of measures and the implementation of measures to
ensure compliance with the minimum requirements for air quality. The limit values in the
Regulations are legally binding, and any failure to meet these minimum requirements
requires measures to be implemented.

1
  EU (2008) Directive 2008/50/EC of the European Parliament and of the Council of 21 May 2008 on ambient air quality and
cleaner air for Europe. Off. J. Eur. Union, L152, 1–44.

                                                           5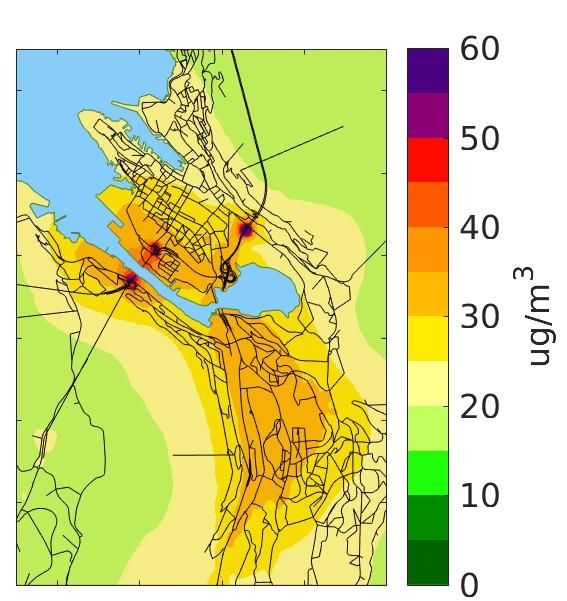
Both short-term exposure to high values and exposure to lower levels over time cause health
problems. There are therefore different limit values for different time intervals (averaging
times).
The national targets are not legally binding, but indicate the Government’s level of ambition
for air quality in Norway. The air quality criteria are based on existing knowledge about the
potential health effects of exposure to air pollution. The criteria are set at a level that most
people can be exposed to without experiencing harmful health effects.

                                               6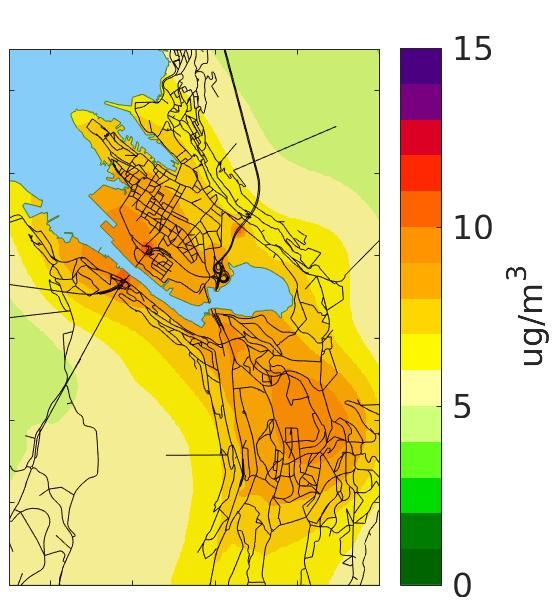
Table 1: Applicable limit values, national targets and air quality criteria for NO2 and particulate
matter
(1)
Component Averaging Limit value National targets of Air quality criteria
(2) (3)
time 1 Jan. 2017
3
NO2 15 minutes 300 µg/m
3 3
Hour 200 µg/m 100 µg/m
Must not be exceeded more
than 18 times per calendar
year
3 3 3
Calendar year 40 µg/m 40 µg/m 40 µg/m
3 3
PM10 24 hours 50 µg/m 30 µg/m
Must not be exceeded more
than 30 times per calendar
year
3 3 3
Calendar year 25 µg/m 20 µg/m 20 µg/m
3
PM2.5 24 hours 15 µg/m
3 3 3
Calendar year 15 µg/m 8 µg/m 8 µg/m
1: Regulations relating to Pollution Control (the Pollution Regulations), Chapter 7. Local air quality.
2: The Royal Norwegian Ministry of Climate and Environment, Prop. 1 S (2016–2017)
3: The Norwegian Institute of Public Health (2013 ) Luftkvalitetskriterier – virkninger av luftforurensning på
helse (‘Air quality criteria – health effects of air pollution’) Oslo, the Norwegian Institute of Public Health
(Report 2013:9)
4 Air quality monitoring in Bergen, 2002–2016
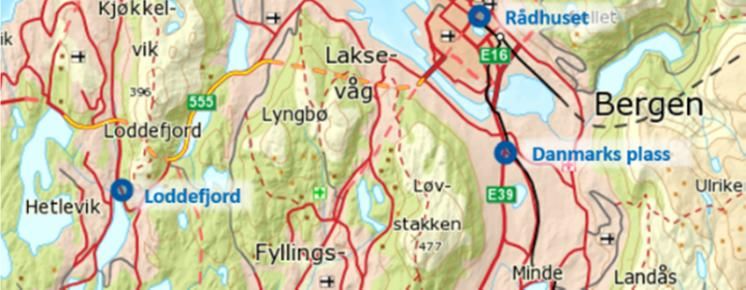
Bergen currently has four air monitoring stations:2 two roadside monitoring stations to
represent the areas where the highest concentrations are expected (Danmarks plass and
Loddefjord) and two urban background stations (Rådhuset and Rolland) representing the air
in a larger area, at a distance from the sources. The monitoring stations in Rolland and
Loddefjord were installed in autumn 2015, while the two others have been in operation
since 2003.
2
After the assessment was concluded, a new roadside monitoring station has been established near Råtjørn in
Fana. In addition, the Rådhuset monitoring station has been moved to Klosterhaugen.
7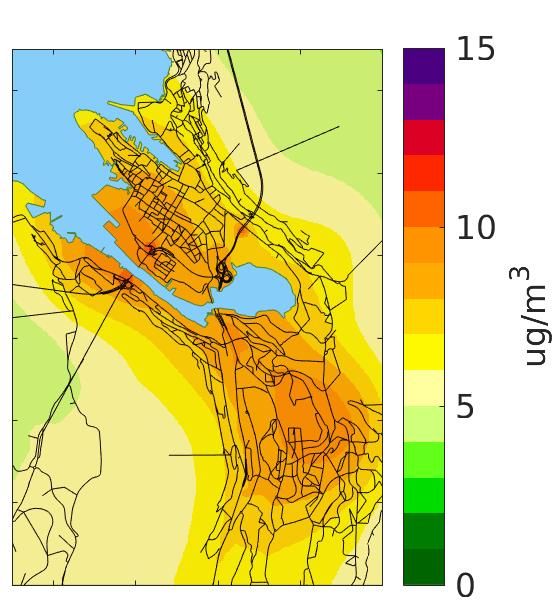
Figure 1: Air monitoring stations in Bergen
Figures 2 to 4 show measurements of NO2 and particulate matter carried out in Bergen
during the period 2003 to 2016.
The main challenge in Bergen in relation to the current regulatory requirements is related to
levels of nitrogen dioxide (NO2). Repeated exceedances of the average mean limit value
show that the level is generally too high. In addition, the number of permitted hours of
exceedances was also exceeded in 2010 and 2016.
No exceedances of the limit values for particulate matter (PM10 and PM2.5) have been
recorded since the monitoring programme started in 2003.

                        Measured annual mean NO2 concentration

                                              8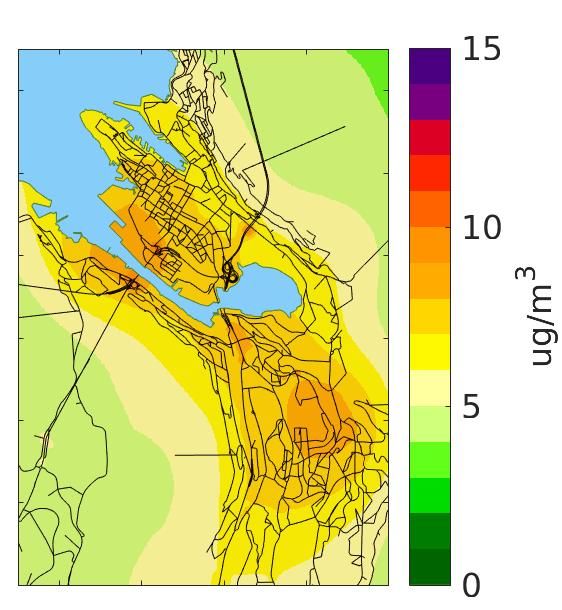
Number of exceedances of the hourly value for NO2

Figure 2: Top: Annual mean NO2 concentration (µg/m3). Bottom: Number of exceedances of the
hourly limit value in Bergen, 2003 to 2016. The limit values set out in the Pollution Regulations are
shown as a yellow line.

Measured annual mean PM10 concentration

                                                 9
Number of exceedances of the daily value for PM10
Figure 3: Top: Annual mean PM10 concentration (µg/m3). Bottom: Number of exceedances of the daily
limit value in Bergen, 2003 to 2016. The limit values set out in the Pollution Regulations are shown as
a yellow line.
10Measured annual mean PM2.5 concentration
Figure 4: Annual mean PM2.5 concentration (µg/m3) in Bergen, 2003 to 2016. The limit values set out
in the Pollution Regulations are shown as a yellow line.
5 Air quality in Bergen today and projections until 2021
NO2
The air quality calculations show that NOx emissions from traffic are expected to be reduced
by approximately 40 per cent in the period from 2015 to 2021. The reduction is primarily
due to the phasing in of new heavy vehicles with Euro VI technology, which have proven to
have very low NOx emissions.3 In addition, an increased proportion of zero-emission vehicles
will help to reduce emissions in the years to come.
The expected reduction in NOx emissions also means that a considerable reduction is
expected in the annual mean concentrations up until 2021, which means that the risk of
exceedances will be considerably reduced; see Figure 5. The calculations still show
exceedances of the annual mean value near the tunnel openings of Fløyfjellstunnelen,
Nygårdstunnelen and Løvstakktunnelen/Damsgårdstunnelen, but the areas where
exceedances occur are smaller than in the current situation.
Elevated concentrations around the tunnel openings are expected, provided that there are
no ventilation towers in continuous operation, since emissions from the tunnels are released
in a limited area. How well the model handles the dispersion from the tunnel openings is
difficult to verify, however, as there are few measurements with which to compare the
model results. Due to lack of information, the effect of ventilation towers (where such exist)
is not included in the calculations. It is therefore possible that the model overestimates the
concentrations where ventilation towers are installed (e.g. Fløyfjellstunnelen) and in
operation when there is a considerable amount of traffic in the tunnel (for example during
3
Emissions from vehicles with Euro 6/VI technology. Results of the monitoring programme in EMIROAD 2015
(TØI/1506/2016)
11rush hour). More detailed studies are needed to assess the levels in these areas and how
large areas around the openings may have concentrations exceeding the limit value.
In 2015, the City of Bergen measured NO2 with the help of passive monitors in Møhlenpris,
Damsgård and Kalfaret. In each place, one monitor was placed relatively close to the tunnel
opening and one a few hundred metres away. The measurements show that the levels are
considerably lower a distance away from the tunnel opening, but a more detailed analysis is
nonetheless recommended to verify the levels in nearby residential areas, especially in areas
of Møhlenpris near the tunnel opening of Nygårdstunnelen.
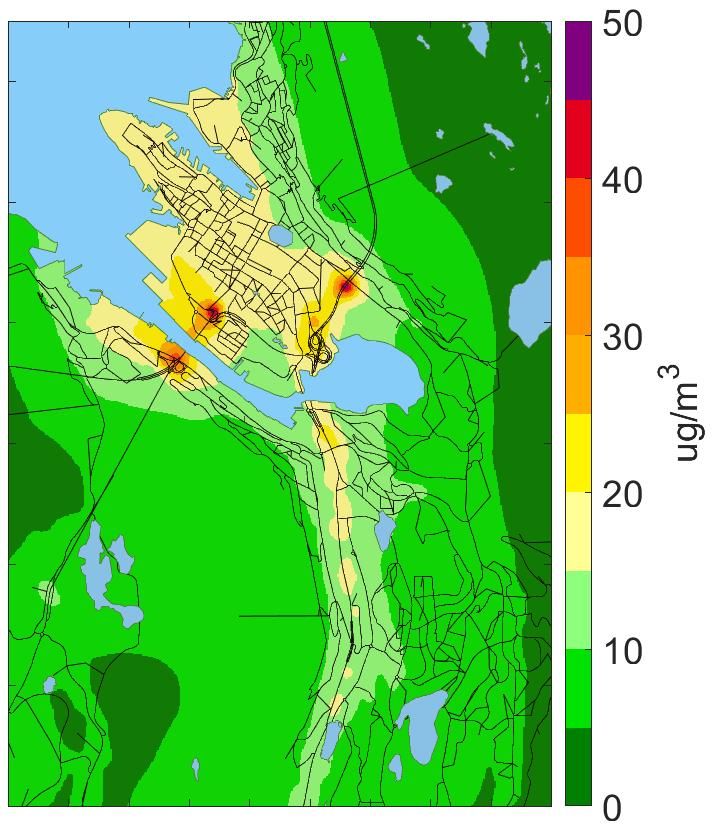
a) Current situation (2015) b) Reference situation (2021)
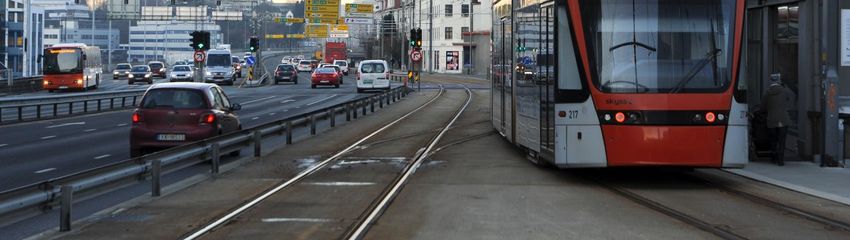
Figure 5: Estimated annual mean NO2 concentration in Bergen city centre for a) the current situation
(2015) and b) the reference situation (2021). Limit value for annual mean NO2 concentration of 40
µg/m3.
The calculation results for the current situation (2015) and the reference situation (2021) in
relation to the Regulations’ requirement for hourly mean values of NO2 are shown in Figure
6. Because the Regulations’ requirement for hourly mean NO2 permits 18 hours of
exceedances of the limit value of 200 µg/m3, the map shows the geographical distribution of
the 19th highest hourly concentration of NO2.
The risk of exceeding the hourly mean limit value is also expected to be considerably
reduced in 2021, but exceedances cannot be ruled out if one or more prolonged inversion
episodes occur during the year. Effective immediate measures that can be implemented
quickly when there is a risk of exceedances will therefore be important.
12a) Current situation (2015) b) Reference situation (2021)
th
Figure 6: The map shows the 19 highest hourly mean NO2 concentration in Bergen city centre for a)
the current situation (2015) and b) the reference situation (2021).
Measures that contribute to reduced traffic and/or accelerate the phasing in of cleaner
vehicles will help to further reduce the risk of exceedances of both annual mean and hourly
mean limit values.
The results are contingent on NOx emissions from heavy vehicles with Euro VI technology
being as low as expected. So far, the test measurements performed show a far greater
reduction than expected in the calculations in the assessment of measures.
PM10
Traffic and wood burning are the most important sources of PM10 in Bergen. The calculations
show that road dust emissions will increase somewhat up until 2021, while exhaust particle
emissions are expected to be reduced in the same period due to cleaner engine technology.
Therefore, only minor changes in the PM10 concentration are expected up until 2021; only a
slight increase in traffic-exposed areas where there is traffic growth. The calculations show a
low risk of exceedances of the limit values for PM10 in 2021 (both the annual mean and the
daily mean) in most places in Bergen, but exceedances may occur near tunnel openings in
Bergen city centre; see Figure 7.
13Figure 7: Estimated annual mean PM10 concentration in Bergen city centre for a) the current situation
(2015) and b) the reference situation (2021).
The estimated annual mean values are also below the Government’s national targets and
the health authorities’ recommendation for the maximum annual mean PM10 concentration
of 20 µg/m3 in most places, except areas around tunnel openings.
The calculation results for the current situation (2015) and the reference situation (2021) in
relation to the Regulations’ requirement for daily mean values of PM10 are shown in Figure
8. Because the Regulations’ requirement for daily mean PM10 permits 30 days of
exceedances of the limit value of 50 µg/m3, the map shows the geographical distribution of
the 31st highest daily mean concentration of PM10. Again, the calculations show that levels
exceeding the daily mean limit value only are only found in areas near tunnel openings in
Bergen city centre. In addition, the calculations show higher values in the areas around the
openings of Lyderhorntunnelen (Høiskar et al., 2017).
14a) Current situation (2015) b) Reference situation (2021)
Figure 8: The map shows the 31st highest daily mean PM10 concentration in Bergen city centre for a)
the current situation and (2015) and b) the reference situation (2021).
The concentrations around tunnel openings are uncertain, and more detailed studies are
therefore recommended of the levels around the openings, especially in built-up areas or
areas where new buildings are planned.
Despite the fact that the PM10 concentrations are below the limit values in most places, the
number of days when the daily mean exceeds the air quality criteria (the health authorities’
recommendations) is nonetheless high, and measures that reduce emissions of particulate
matter may reduce this number.
PM2.5
The calculations show that the annual mean PM2.5 concentration is well below the limit value
of 15 µg/m3 throughout the municipality; see Figure 9. In areas close to the city centre, the
calculations show PM2.5 concentrations near or just above the national targets and the
health authorities’ recommendation of 8 µg/m3, both for the current situation (2015) and for
the reference situation (2021).
The levels of PM2.5 in Bergen will thus not trigger a requirement for measures to be
introduced to reduce the levels, because the limit value in the Pollution Regulations is not
exceeded. Measures to reduce PM2.5 emissions, on the other hand, may help to reduce the
annual mean value and the number of days when the daily mean exceeds the air quality
criteria, and also reduce the risk of exceeding the daily mean limit value for PM10.
15a) Current situation (2015) b) Reference situation (2021)
Figure 9: Estimated annual mean PM2.5 concentration in Bergen city centre for a) the current situation
(2015) and b) the reference situation (2021).
The risk of exceeding the limit values for NO2 will be reduced considerably up until 2021,
with regard to both the annual mean and the hourly mean. Exceedances may occur in
areas near some tunnel openings.
For PM10 and PM2.5, minor changes in the levels are expected up until 2021 compared
with the current level, if no additional measures are implemented.
The annual mean and daily mean PM10 concentrations are well below the limit values,
and also below the national targets and air quality criteria, except around some tunnel
openings.
The annual mean PM2.5 concentrations are well below the limit value throughout the
municipality. In areas close to the city centre, the PM2.5 concentrations are near or just
above the national targets and the health authorities’ recommendation. In other parts
of the municipality, the annual mean is below the national targets.
6 Effect of package of measures
Based on a review of the results of the projections up until 2021, the working group agreed
on what measures to recommend in a revised ten-point action plan for improved air quality
in Bergen. Measures with a quantifiable effect were included in a package of measures, and
new traffic, emission and dispersion calculations were carried out for the package as a
whole.
16The package includes the following measures:
1. Environmentally differentiated road tolls and new toll collection points
The measure is expected to have a traffic-reducing effect and to reduce emissions of
NO2 and particulate matter from traffic.
2. Prohibition against old wood-burning stoves from 2021
The measure is expected to reduce emissions of particulate matter.
3. Studded tyres fee continued as today
The measure is not new and is therefore already included in the projection up until
2021. Continuation of the measure ensures a high proportion of non-studded tyres
and reduces road dust emissions.
4. Bergen Light Rail line to Fyllingsdalen.
The measure is expected to have a traffic-reducing effect and to reduce emissions of
NO2 and particulate matter from traffic.
The calculations show that the proposed measures will reduce the annual mean NO2 and
PM10 concentrations in Danmarks plass by 4 and 6 per cent, respectively, while the effect will
be less pronounced in places not equally affected by traffic.
The model calculations also show that, even with these measures, there may still be a risk of
limit value exceedances for NO2 and PM10 near tunnel openings in Bergen city centre; see
Figure 10 and 11. This concerns both the annual mean and the short-term mean values
(hourly for NO2 and daily for PM10).
b) 19th highest hourly mean
a) Annual mean NO2 b) 19th highest hourly mean NO2
17Figure 10: The figure on the left shows the estimated annual mean NO2 concentration (µg/m3) for the
reference situation (2021) if the package of measures is implemented, while the figure on the right
shows the 19th highest hourly mean.
a) Annual mean PM10 b) 31st highest daily mean PM10
Figure 11: The figure on the left shows the estimated annual mean PM10 concentration (µg/m3) for
the reference situation (2021) if the package of measures is implemented, while the figure on the
right shows the 31st highest daily mean.
The model calculations are uncertain around tunnel openings, and previous measurements
show that the levels decrease markedly in step with the distance to the opening. A more
detailed mapping should be carried out of NO2 and PM10 concentrations in areas around
tunnel openings that show elevated values, to document whether the levels in residential
and public areas exceed the limit values.
The calculations show that the risk of limit value exceedances for NO2 is low in 2021.
However, it is important to underline that the annual mean and the number of exceedances
of the hourly mean limit values depend on meteorological conditions and may vary
substantially from one winter to the next. The weather in the year that forms the basis for
the calculations (2015) was relatively mild, and exceedances cannot be ruled out in a year
with prolonged periods of poor dispersion conditions (inversion episodes). It is therefore
important to have effective immediate measures that can be implemented when there is a
risk of high air pollution.
For PM2.5, the annual mean is currently well below the limit values throughout the City of
Bergen. The Pollution Regulations therefore do not require measures to be implemented to
reduce the PM2.5 levels.
The package of measures leads to a reduction in the annual mean PM2.5 concentrations of
approximately 10 per cent in Bergen city centre. If the proposed measures are introduced,
most areas in Bergen are expected to have annual mean values below the national targets;
18see Figure 12. The calculations thereby show that a prohibition against the use of old wood-
burning stoves in 2021 will be an important contribution to reducing PM2.5 levels in Bergen
city centre.
a) The reference situation (2021) b) The reference situation (2021) if the package of
measures is implemented
Figure 12: The figure shows the annual mean PM2.5 concentration for a) the reference situation (2021)
and b) the reference situation (2021) if the package of measures is implemented. The package of
measures leads to a reduction in the annual mean concentrations of approximately 10 per cent in
Bergen city centre.
On days with inversion, the PM2.5 levels may nonetheless exceed the daily mean air quality
criteria. Emissions from wood burning make a substantial contribution to the high levels on
such days, and reducing these emissions can reduce the number of days when the daily
mean exceeds the air quality criteria (the health authorities’ recommendations).
The risk of exceeding the limit values for NO2, PM10 and PM2.5 is deemed to be low in
2021. The proposed measures help to reduce the risk of limit value exceedances for both
NO2 and PM10. The measures will also help to reduce levels of particulate matter and
NO2 on days with inversion.
It is important that effective immediate measures can be implemented to reduce NO2
emissions on days when there is a risk of high air pollution, in order to further reduce the
risk of exceedances.
197 Ten-point programme for improved air quality in Bergen
Based on a review of the results of the calculations in this assessment and discussions in the
working group, a revised ten-point action plan is recommended, as shown in Table 2.
Table 2: Recommended ten-point action programme for improved air quality in Bergen. Assessment
of measures to improve local air quality in Bergen.
Ten-point action plan for improved air Effect Responsibility Time frame Cost
quality in Bergen
1. Time-differentiated and NO2 The parties to Tentative Generates income.
environmentally differentiated road PM10 the Bergen consideration in Precondition for point 2.
tolls with new rates and collection Programme. autumn 2017.
points Must be
considered by
the Storting.
2. Strengthening of public transport – NO2 The parties to Currently at the Funded by urban growth
Bergen Light Rail line to Fyllingsdalen, PM10 the Bergen planning stage. agreement and road tolls.
in addition to facilitating more Programme.
trolleybuses and zero-emission buses
3. Shoreside power for ships at berth, NO2 Port of Bergen Ongoing. Cruise ships: NOK 140 mill.
and maximum limit for number of not financed. Offshore,
cruise ship calls a day Hurtigruten, others: NOK
27 mill., ENOVA
application
4. Measures in and around the tunnels NO2 The Norwegian Mapping of scope One year of monitoring
in Bergen city centre PM10 Public Roads can start using 20 monitoring
Administration immediately. stations costs in the region
(NPRA) Monitoring for at of NOK 120,000.
least a year
5a. Parking restrictions NO2 Relevant Ongoing, many The measure is not
PM10 municipalities measures already specific enough for a
introduced. concrete assessment of
revenues and costs.
5b. Building more park-and-ride Hordaland Establishing 3,500
facilities County Council new places by
2030
6. Continuation of studded tyres fee PM10 City of Bergen Introduced Generates income.
7. Street cleaning and dust binding PM10 NPRA / City of Ongoing NPRA – approx. NOK 2.5
Bergen mill.
City of Bergen – approx.
NOK 1 mill.
8. Grant for replacement of old wood- PM2.5 City of Bergen Ongoing. Total cost: NOK 50 mill.,
burning stoves, and prohibition from PM10 Prohibition from plus inspection costs.
2021 2021.
9. Warnings and information NO2, City of Bergen Ongoing NOK 1.5 mill.
PM10,
PM2.5
10. Mobility and municipal measures, NO2, City of Bergen Ongoing
with particular focus on facilitating PM10
cycling and carpooling.
208 Bergen City Council, decision of 27 Sept. 2017, item 230/17
‘Assessment of measures for improved local air quality in Bergen 2017’
1. Bergen City Council endorses the ‘Assessment of measures for improved local air quality in
Bergen 2017’.
2. The revised ten-point programme as described in Part 2 of the ‘Assessment of measures
for improved air quality in Bergen’, with the changes and specifications provided under ‘the
City Government’s recommendations’ as described in this item, make up the City of Bergen’s
action plan for improved air quality.
3. The budgetary consequences of the action plan will be considered in connection with
Interim Report 2 (for 2017) and in connection with the City Government’s proposal for the
Action Plan 2018–2021/Budget 2018.
4. Point 2 is changed to: ‘Strengthening of public transport – Bergen Light Rail line to
Fyllingsdalen, in addition to facilitating more trolleybuses and zero-emission buses.’
5. Public transport must be competitive and an attractive alternative. Work continues on
establishing bus and taxi lanes on the most heavily trafficked roads into Bergen.
6. Point 10 is changed to: ‘Mobility and municipal measures, with particular focus on
facilitating cycling and carpooling.’
The City Government’s recommendations
The City Government proposes the following changes and specifications in the ten-point
programme:
Point 1: Time-differentiated and environmentally differentiated road tolls with new rates
and collection points
The City of Bergen has previously decided to introduce low-emission zones when this option
becomes available. The City Government believes we now have an assessment that means
that, in practice, it will not be necessary to introduce low-emission zones subject to fees,
because technological development, supplemented by the introduction of environmentally
differentiated road tolls, can have a very good effect on the local air quality and will ensure
that Bergen meets the statutory requirements by a good margin within a few years.
In that connection, the City Government refers to the City of Bergen’s consultative
statement to the Regulations on low-emission zones (City Government item 1381/16), which
states:
‘In its further work, the City of Bergen will consider the resources needed and the expediency
of establishing low-emission zones as a municipal, parallel system to road tolls.’
Point 2: Strengthening of public transport – Bergen Light Rail line to Fyllingsdalen
The parties to the Bergen Programme are responsible until the end of the year. From 2018,
the Bergen Programme will be replaced by an Urban Growth Agreement.
21The City Government would like to point out that ‘Strengthening of public transport’ does
not only concern the Bergen Light Rail line to Fyllingsdalen. Reference is made to the draft
Urban Growth Agreement for Bergen, which was approved by the City Council on 31 May
2017 under item 145/17 ‘Draft first-generation Urban Growth Agreement for Bergen, 2017–
2023’.
The main goal of the agreement is to contribute to zero growth in passenger car transport in
the area covered by the agreement, meaning the entire City of Bergen. In other words, all
growth in passenger traffic shall be in the form of public transport, cycling and walking.
Commercial traffic and through-traffic are exempt from the zero growth objective.
This item is closely linked to parallel item 146/17 ‘Road toll application for new city package
in Bergen’, intended to ensure local co-funding of the content of the Urban Growth
Agreement.
Point 5: Parking restrictions and park-and-ride facilities
The City Government believes these measures are so different that they must be split into
two points:
5a Parking restrictions. The municipalities concerned are responsible for this measure. At the
same time, reference is made to long-term measures in the development of the new land
use strategy in the land use part of the municipal master plan (KPA), which will further
strengthen this.
5b Building more park-and-ride facilities. Hordaland County Council is responsible for park-
and-ride facilities. Reference is made to the ‘Strategy for park-and-ride facilities’, adopted by
the county council (Fylkestinget) on 11 March 2015. Fylkestinget has adopted a strategy for
growth from today’s 2,500 places to approx. 6,000 places in park-and-ride facilities up until
2030. Arrangements shall be made for electric car charging in 20 per cent of the places.
Point 10: Mobility and municipal measures
Reference is made to the Green Strategy and the ‘Climate and Environmental Plan for the
City of Bergen’s activities from 2017 to 2020’, which was considered and adopted by the City
Council on 22 March 2017. These plans are ambitious in relation to changed mobility, zero-
emission technology and traffic development; this is also positive for air quality.
229 References
Høiskar, B. A. K., Sundvor, I., Johnsrud, M., Haug, T. W., Solli, H. (2017) Assessment of measures
for improved local air quality in Bergen (NILU report, 15/2017). Kjeller: NILU.
2324
NILU – the Norwegian Institute for Air Research
NILU is an independent foundation established in 1969. The purpose of NILU’s
research is to increase our understanding of processes and effects relating to
climate change, atmospheric composition, air quality and environmental toxins.
Based on research, NILU provides integrated analysis, monitoring and advisory
services and products. NILU is concerned with informing and advising society on
climate change and pollution and the consequences they entail.

NILU’s values:        Integrity – Competence – Benefit to society
NILU’s vision:        Research for a clean atmosphere

NILU – the Norwegian Institute for Air Research
P.O. Box 100, NO-2027 KJELLER

Email: nilu@nilu.no
http://www.nilu.no
You can also read