Correlation between Air Quality Index and Traffic Volume - IJERA
←
→
Page content transcription
If your browser does not render page correctly, please read the page content below
Omar Alruwaili,etal. Journal of Engineering Research and Application www.ijera.com
ISSN : 2248-9622, Vol. 10, Issue 4, ( Series - III) April 2020, pp. 51-58

 RESEARCH ARTICLE OPEN ACCESS

Correlation between Air Quality Index and Traffic Volume
Omar Alruwaili*, Ivica Kostanic**
*Department of Computer Engineering and Sciences, Florida Institute of Technology, Melbourne, USA
** Department of Computer Engineering and Sciences, Florida Institute of Technology, Melbourne, USA

ABSTRACT
Measurements of the Air Quality using a set of inexpensive electrochemical sensors is considered. The sensors
measure all pollutants prescribed by US Environmental Protection Agency for calculation of the Air Quality Index
(AQI). The sensors are placed at the street level and connected to a central server through the Internet of Things.
Alongside pollution measurements, traffic density measurements next to the sensor location are performed as well.
A mathematical model that relates traffic density and AQI is developed. The model shows that some gaseous
pollutants have a very strong correlation with the traffic density. Overall, AQI and traffic density show significant
correlation.
Keywords-Internet of Things (IoT), Air Quality Index (AQI), Carbon Monoxide (CO), Nitrogen Dioxide (NO2), Ozone
(O3), Particulate Matter (PM) and Sulphur Dioxide (SO2).

---------------------------------------------------------------------------------------------------------------------------------------
Date of Submission: 07-04-2020 Date of Acceptance: 22-04-2020
---------------------------------------------------------------------------------------------------------------------------------------

 I. INTRODUCTION
 Pollution is defined as the introduction of
pollutants into the natural environment. Pollutants
are often chemical contaminants, but they may also
be more broadly defined to include other
contaminants, such as light or noise. Pollutant gases
emitted through car exhaust consist of chemicals such
as carbon monoxide (CO), nitrogen dioxide (NO2),
ozone (O3), sulphur dioxide (SO2) and particulate
 Fig. 1. Air Pollution
matter (PM) and [1], as shown in Fig.1. Based on its
origin, pollution may be classified as either “point The air pollution becomes smog, which
source” pollution or “nonpoint source” pollution. hangs over cities and poses a major threat to health
Point source pollution comes from a single and climate. The gases in smog are combined with
identifiable place, while nonpoint source pollution dust and are emitted by cars and factories. One of the
comes from many diffuse sources. Pollution coming most prevalent gases that effect air pollution in cities
from the car exhaust is regarded as a “nonpoint is ozone. According to the World Health
source” pollution. Organization (WHO), air pollution accounts for about
 The problem of air pollution is well known 4 million deaths per year contributing to strokes, heart
and of great concern in municipalities throughout the disease, congestion, chest pain, lung cancer and
world. One of the most significant sources of this chronic respiratory diseases. Approximately 91
pollution is vehicular emissions. This pollution percent of the world's population lives in areas where
harms not only humans but also animals and poor air quality exceeds WHO limits. The WHO and
vegetation [2][3]. individual countries are working together to monitor
 air pollution and improve air quality [4].
 To control pollution, one needs to be able to
 measure concentrations of various pollutants. Current
 methods used for these measurements are very
 expensive, and therefore they cannot be done on a
 massive scale. This paper considers a possibility of
 using inexpensive sensors coupled with the Internet
 of Things (IoT) for close to real time measurements
 of pollution. Moreover, the methodology is illustrated

 www.ijera.com DOI: 10.9790/9622-1004035158 51 | P a g e
Omar Alruwaili,etal. Journal of Engineering Research and Application www.ijera.com
ISSN : 2248-9622, Vol. 10, Issue 4, ( Series - III) April 2020, pp. 51-58

through the evaluation of street level air pollution and Environmental Protection Agency (EPA) categorizes
its relationship to the number of vehicles. air quality into six ranges. Each range has different
 levels of potential health concerns. The Air Quality
A. Internet of Things Index (AQI) is calculated by measuring the levels of
 The Internet of Things (IoT) is a system of five main pollutants: ground level (or tropospheric)
physical objects such as sensors and connectivity that ozone, particulate matter, carbon monoxide, sulfur
enables transfer, collection and exchange of data. dioxide, and nitrogen dioxide. The AQI ranges from
Nowadays, the IoT is regarded as one of the most 0 to 500. When the AQI is in the range 0-50, the air
significant technologies being developed. This is in quality is considered “Good” and the pollution poses
part due to its capabilities for improving human health little to no health risk. For AIQ values 51-100, the air
and assisting with societal issues. The advent of the quality is “Moderate” and acceptable for most people,
IoT in many fields has begun to make an impact on but a potential health concern for a very small number
the global economy as well. There have been much of people particularly sensitive to air pollution. When
research in this field leading to new services including the AQI is in the range 101-150 the air quality is
opportunities to connect physical devices and “Unhealthy for Sensitive Groups". Although the
between virtual worlds and devices located in houses, general population is not likely to suffer
cars, streets, and other public environments. The IoT consequences for being exposed to air in this range,
involves applications such as smart cities, smart people with lung disease, older adults, children, and
homes, smart health care, smart transportation and asthmatics are at risk. Between 151-200, the air
smart traffic management [5]. The IoT is important in quality is “Unhealthy”. Everyone might experience
the development of inexpensive air pollution sensing some adverse health effects, and members of sensitive
devices as well. Such devices may be placed around groups may suffer serious, or even life-threatening
a city to measure humidity, temperature, and effects. Between 201-300, the air quality is “Very
concentration of ozone, carbon monoxide, nitrogen Unhealthy”. This usually triggers a health alert
dioxide, noise, and particles [6]. The devices may be warning for people to avoid unfiltered outside air as
configured to send alarms if any of the concentration much as possible because everyone is at risk for more
for any of the pollutants goes above a set threshold. serious health effects. Between 300-500, the air
This type of architecture addresses the main problem quality is “Hazardous”. This calls for an emergency
of air pollution monitoring - expensive and health warning, with the entire population likely to be
cumbersome measurement systems. With the IoT, affected. Keeping informed about the AQI value is
one may possibly deploy hundreds of sensors for near an important way to stay healthy; the Table in Fig. 2
real-time monitoring of air quality over larger summarizes the AQI ranges. Each range is associated
geographical areas. with a specific color (green to black). Colors are used
 in a consistent manner to improve clarity of messages
B. Health Effects that are communicated to the general public [7].
 Gas emissions from cars are the most
important contributors to air pollution. These
emissions cause many adverse effects to the health of
humans. The most sensitive groups are children and
older adults, especially the people that are active
outdoors. The most significant health effects are
respiratory problems such as coughing, congestion,
chest pain, and throat irritation. The pollution also
worsens respiratory diseases such as asthma,
bronchitis, and emphysema. Some gases like SO2
react with other parts of the atmosphere and create
particles that penetrate deeply into sensitive parts of
lungs. Particulate matter is linked to numerous
 Fig. 2. AQI Scale
problems such as premature death with people with
 Air quality is closely related to both the
lung diseases, nonfatal heart attacks, irregular
 climate of the earth and to the global ecosystems. The
heartbeat, aggravated asthma, and a decrease in lung
 carbon dioxide emissions of the world continue to
function [7].
 rise, driven by the same sources as air pollution in
 general. Other pollutants, including both ozone and
C. Air Quality Index
 particulate carbon, have a strong effect on agricultural
 To help manage different types of pollution,
 production as well as on the continuing warming of
government agencies regularly monitor air quality.
 the planet. As a result, some international and national
Unfortunately, the methodology for monitoring is not
 bodies have begun to implement policies aimed
standardized. Within the United States, the

 www.ijera.com DOI: 10.9790/9622-1004035158 52 | P a g e
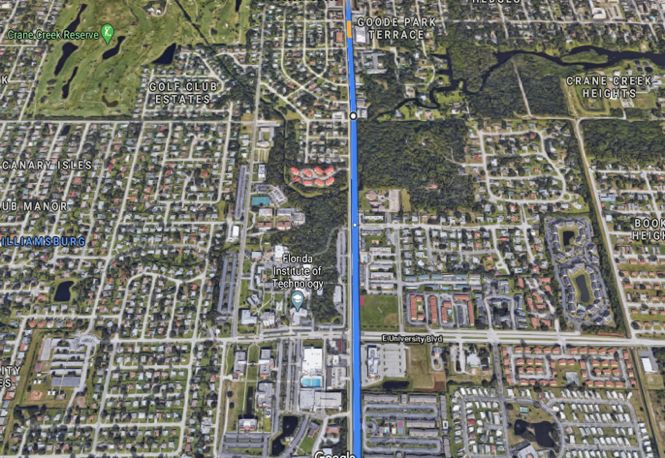
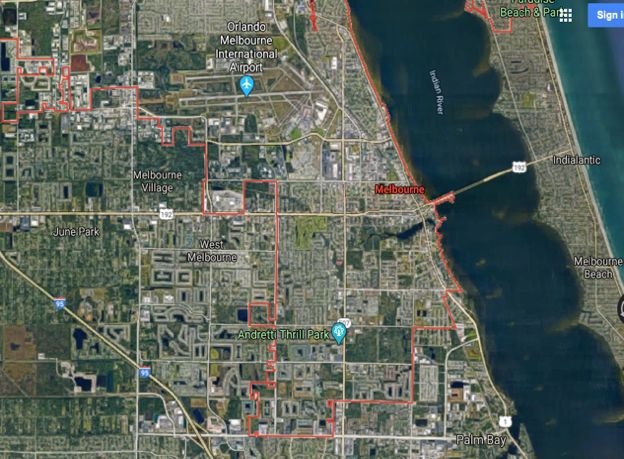
Omar Alruwaili,etal. Journal of Engineering Research and Application www.ijera.com
ISSN : 2248-9622, Vol. 10, Issue 4, ( Series - III) April 2020, pp. 51-58

primarily at reducing the health effects and climate measurements are performed in two locations: P1 and
effects of air pollution. Among them, the World P2 in the city of Bangkok, Thailand for seven days.
Health Organization has been in the forefront of those The AQI result of both locations was approximately
efforts. This organization works with health the same. The air quality was good; the highest AQI
professionals throughout the world to address their was recorded the last day of the study, but it was still
much-needed participation in reducing this health in the range 0-50.
hazard. The WHO is responsible for establishing a In [10] researchers evaluated the Air Quality
Global Platform on Air Pollution and Health. Index (AQI) by measuring the average concentration
Working jointly with governmental and academic of four pollutants (NO2, SO2, PM2.5 and PM10).
experts, they make certain that monitoring of These measurements were used to determine the
exposure and improved surveillance methods are prevailing ambient air quality in the location of study.
implemented on not only a national but also on a The results of seasonal and daily readings of the AQI
global scale. The WHO also has led an effort to ranged from good, to moderate, acceptable, and
establish the BreatheLife campaign, in collaboration unsatisfactory in different AQI computations
with the UN Environment and the Climate and Clean according to the guidelines from CPCB. The results
Air Coalition. The goal of this collaboration is to of this study deduced that PM10 is mainly responsible
increase the awareness of the connections between air for pollution in this location and was causing serious
pollution and climate change and health among not public health problems.
only health care professionals but also among In [11], the study employed the IoT to detect
municipal governments, national governments, and vehicle-produced pollution in real time. There are two
the public [8]. sensors which are used to detect two important types
 of toxic gases produced by gasoline powered
 II. LITERATURE REVIEW vehicles: CO and SO2. Moreover, this study utilized
 There is much research about the Air Quality a Radio Frequency Identification (RFID) reader
Index, some of which is presented in this section. system to count the passing cars on the road. In the
According to [2], emissions due to automobile experiment, the Arduino board is used as a controller
exhausts represent 60 percent of air pollution in India. system to receive data from sensors, and the RFID
In addition, many organic chemical compounds, reader is used to track, detect, and find the location of
either in gaseous form or in particulate form or in the the cars. The data are saved on a central server for the
combined forms, are contained in these emissions. A analysis. The user of the platform is alerted if the
two-month study was done in three locations in the pollution levels exceeds prescribed threshold values.
city of Bhopal, India (Govind Pura, T. T. Nagar, and
Hamidia Road). The study was designed to monitor III. EXPERIMENTAL SETUP
air quality pollutants such as PM10, PM2.5, SO2 and The purpose of this paper is to model and to
NOx. The experiment utilized HVS (APM 460) to analyze pollution data on the street level. The street
get air sampling. All the pollutants were analyzed per level is considered as the best place to measure gas
Central Pollution Control Board (CPCB) guidelines. emissions from cars. The first step of this research is
Moreover, they used AQI to measure the ratio of the to collect data from an air quality sensor in the street.
pollutants concentrated in different places. The study The air quality sensor was placed in close proximity
found PM10 and PM2.5 to be more than the to Babcock Street in Melbourne, FL USA. The second
permissible limit but NOx and SO2 less than the step analyzed the air pollution data. By comparing
acceptable limit. The excesses of PM10 and PM2.5 the average of the number of cars for an hour with the
cause significant environmental risks that threaten average of the air quality for an hour, one is able to
those with heart disease and respiratory symptoms in calculate the correlation between them. Thus, an
the population. analytical model may be created that relates the AQI
 The IoT can help provide air quality to the number of the cars in the street, i.e., traffic
measurement in real time. In [9] by using IoT the density.
authors propose development of smart Low-Power
Wide-Area network (LPWAN) sensors that enable A. Study Area
long-range monitoring of air pollution in real-time. The experiment was conducted in the city of
There are five types of smart sensor for air pollution. Melbourne, Florida, in the United States, Fig 3, on
These sensors can monitor carbon monoxide (CO), Babcock Street, as shown in Fig 4. Babcock Street is
ozone (O3), noise level (dB), carbon dioxide (CO2), one of the main streets in the city. In Melbourne, the
and particulate matter (PM10). The sensors then summers are four months long, hot, with 120 days
calculate the AQI and transmit data using LTE above 24°C to 30°C, and wet, with an average rainfall
technology, NB-IoT to a central server. By using a of 6 inches. The winters are around two months, cool
smartphone, the people can then monitor the existing (with an average temperature of 12°C to 22°C), and
website for the measurements of air quality. The windy. Over the course of the year, the temperature

 www.ijera.com DOI: 10.9790/9622-1004035158 53 | P a g e
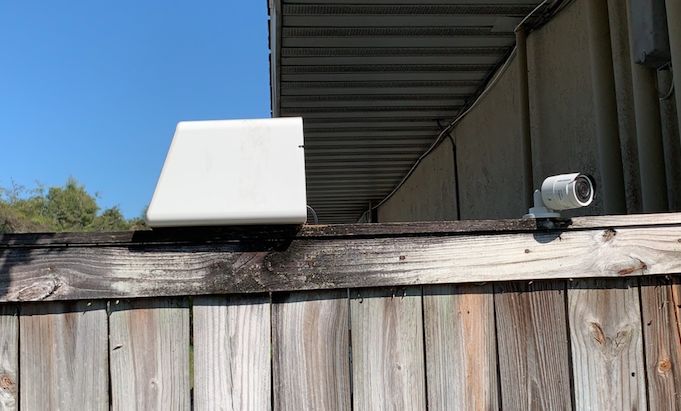
Omar Alruwaili,etal. Journal of Engineering Research and Application www.ijera.com
ISSN : 2248-9622, Vol. 10, Issue 4, ( Series - III) April 2020, pp. 51-58

typically varies between 12°C and 32°C and is rarely video from an IP camera pointing towards the street.
below 4°C or above 34°C. The economic and urban The NVR camera has a hard disk to record and save a
developments of the area have caused negative video for a long time and which could be retrieved at
environmental effects [12]. any time.

 Table. Sensors Details.
 Sensor Element Specifications
 Manufacturer
 Temperature (Farnell) Operating range: -40 to
 125 deg C
 Humidity (Farnell) Operating range 0 to
 100% (non-condensing)
 Pressure (Freescale) Operating range: 15-115
 kPa
 CO, Carbon-Monoxide Range: 0-1000ppm
 (Alphasense)
 NO2, Nitrogen-Dioxide Range: 0-20ppm
 (Alphasense)
 SO2, Sulfur-Dioxide Range: 0-20 ppm
 Fig. 3. Melbourne Scope (Alphasense)
 O3, Ozone (Alphasense) Range: 0-2ppm
 Particle sensor • Range 0-1000ug/m^3
 Plantower (PM2.5,
 PM10)
 Noise sensor (optional) Range 40-111dB

 Fig. 4. Babcock Street

B. Hardware:
 The IoT air quality system which was used
consists of sensors that enable monitoring of the Fig. 5. Installation in Babcock street
concentration of pollutants, as well as several
environmental parameters such as air temperature,
humidity and pressure as shown in Fig 5. Included,
there are sensors for measurements of gaseous
pollutants (CO, SO2, NO2, O3) and PM-Particulate
Matter (PM2.5, PM10). The system collects the data
and sends them via Ethernet, Wi-Fi, cellular
(2G/3G/4G) or NB-IoT interface to a central server
location as shown in Fig 6. The Air Quality Sensor
has some additional features, such as firmware
parameter management (through which update and
retrieval are supported), robust casing, low power
consumption, and operating range from -40 to +125 Fig. 6. Block diagram of AQ sensor
°C. For data processing and visualization, the system
provides an air quality monitoring solution, the main C. Calculating the Air Quality Index (AQI)
purpose of which is to identify and monitor sources The data consists of AQI values for the
of air pollution. Table 1 shows the most important different sources of air pollution as O3, CO, SO2,
data on the sensors used in the air quality NO2, PM2.5 and PM10. In these data, different
measurement system. A Hikvision camera and a readings of the AQI are available for each hour,
Network Video Recorder (NVR) are used to record provided as an average of concentration for each hour

 www.ijera.com DOI: 10.9790/9622-1004035158 54 | P a g e
Omar Alruwaili,etal. Journal of Engineering Research and Application www.ijera.com
ISSN : 2248-9622, Vol. 10, Issue 4, ( Series - III) April 2020, pp. 51-58
for each of the air pollutants being measured. The
AQI values for each of the gases is calculated by
using the following formula from the EPA guideline:
("high# "LOW)
AQI = Ip = &'(&high# &LOW)( ∗ (Cp − CLOW). + ILOW(1)
Where Chigh = breakpoint concentration
greater or equal to given concentration, CLow =
breakpoint concentration smaller or equal to given
concentration, Ihigh = AQI value corresponding to
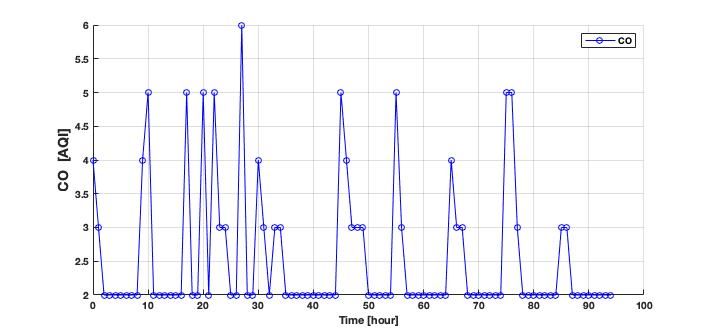
Chigh, ILow = AQI value correspond to CLow, Cp = the Fig. 9. AQI Measurements for CO
concentration of pollutant p, AQI = maximum of Ip
[7].The AQI value is selected from the maximum
value of all gases and particulates measured: O3, CO,
SO2, NO2, PM2.5 and PM10 [13].
AQI =max (O3AQI, CO AQI, NO2 AQI, SO2 AQI,
PM2.5 AQI,PM10 AQI,) (2)
IV. EXPERIMENTAL RESULTS AND
RESULTS ANALYSIS
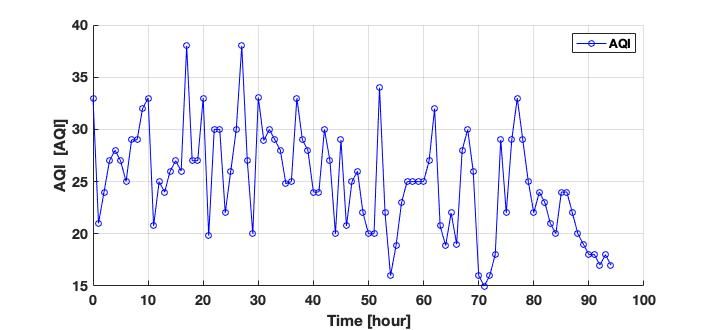
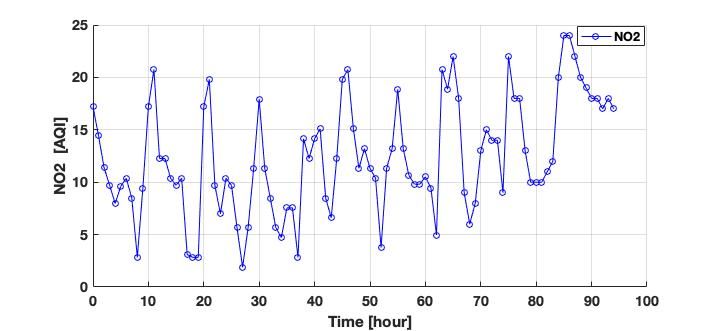
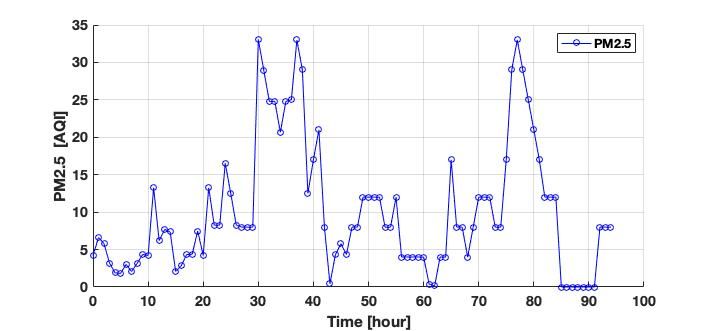
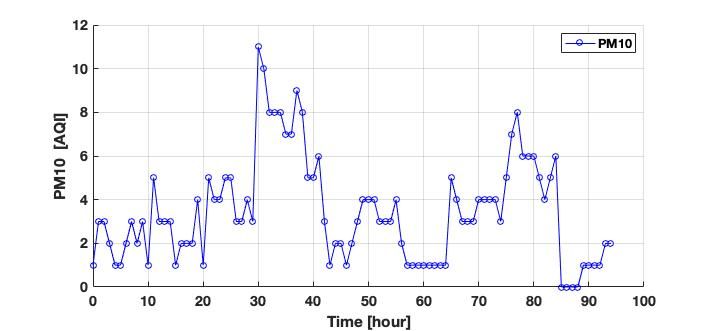
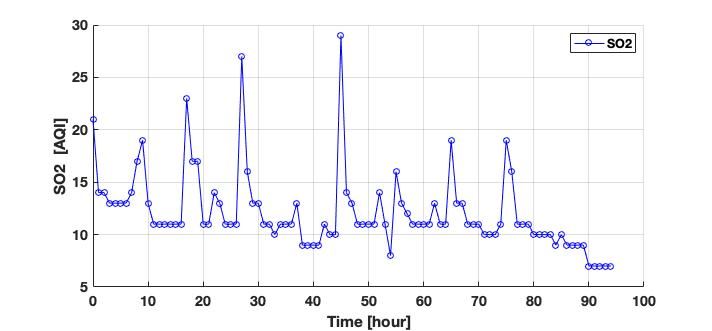
The collected data are shown in Figs. 7
through 13. The results for the AQI of pollutants were Fig. 11. AQI Measurements for SO2
collected for 8 hours per day from 8 AM to 5 PM over
a 10-day period. In the graphs in Figs. 7 through 13,
the X axis represents the time in hours and the Y axis
represents the AQI associated with a pollutant. A
separate chart is provided for each one of the
pollutants. The AQI values for all the days on
Babcock Street were at a Good level, which
corresponds to the AQI value under 50 according to
the EPA categories for air quality.
Fig. 10. AQI Measurements for NO2
Fig. 7. AQI values calculate using (2) Fig. 12. AQI Measurements for PM2.5
Fig. 8. AQI Measurements for O3
Fig. 13. AQI Measurements for PM10
A. Result Analysis
Data are analyzed to examine the
relationship between the traffic density and the AQI.
www.ijera.com DOI: 10.9790/9622-1004035158 55 | P a g e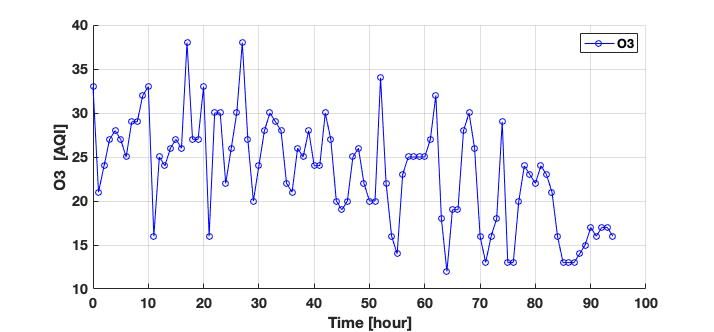
Omar Alruwaili,etal. Journal of Engineering Research and Application www.ijera.com
ISSN : 2248-9622, Vol. 10, Issue 4, ( Series - III) April 2020, pp. 51-58

A simple Linear Regression (LR) is used for model
development [14]. The LR analysis is used to predict
the value of a dependent variable (Traffic Density)
relative to an independent variable (AQI). The linear
regression equation is creating a mathematical model
in order to calculate and measure the Air Quality
Index of air pollution.
AQI = × + (3)
 During the 10 days of collecting the data, it
can be seen that the Air Quality Index is dependent on
the number of cars, as shown in Figs. 14 through 20. Fig. 14. Linear regression for AQI
Table 2 presents the parameters of the LR model. In
the experiment and results as shown in Figs. 14
through 16, the relationship between air pollutants
and car numbers is strong for AQI, O3, and CO. The
R square value tells us that there is a correlation
between the number of cars and the air pollutions. The
R squared value for the LR model between the total
AQI and traffic density is 0.71.The R squared value
for the LR model between the total ozone and the
traffic density is 0.60.The R square presenting the
relationship between CO and traffic density is0.50of
air pollution in the street. As shown in Figs. Fig. 15. Linear regression for O3
17through 20, the results of linear regression show
that the NO2, SO2, PM2.5, and PM10 were very little
effected by the number of cars.

 Table 2. Results.
 Air Linear regression R square Fig. 16. Linear regression for CO
 pollutions equation (R²)

 AQI AQI=15.62*TD+1718 0.71

 O3 O3=10.55*TD+1862 0.60

 CO CO= 67.64 * TD +1936 0.50
 SO2 SO2=14.98* TD + 1927 0.35
 Fig. 18. Linear regression for SO2
 NO2 NO2=-4.453* TD + 2164 0.064

 PM2.5 PM2.5=1.857*TD+ 2090 0.028

 PM10 PM10= 7.946*TD+ 2081 0.039

 Fig. 17. Linear regression for NO2

 www.ijera.com DOI: 10.9790/9622-1004035158 56 | P a g e
Omar Alruwaili,etal. Journal of Engineering Research and Application www.ijera.com
ISSN : 2248-9622, Vol. 10, Issue 4, ( Series - III) April 2020, pp. 51-58

 [4]. " Air pollution-World Health Organization,"
 [Online]. Available:
 https://www.who.int/health-topics/air-
 pollution#tab=tab_1.
 [5]. E. Alexandrova and A. Ahmadinia, “Real-
 time intelligent air quality evaluation on a
 resource-constrained embedded platform,”
 in 2018 IEEE 4th International Conference
 on Big Data Security on Cloud
 Fig. 19. Linear regression for PM2.5 (BigDataSecurity), IEEE International
 Conference on High Performance and Smart
 Computing,(HPSC) and IEEE International
 Conference on Intelligent Data and Security
 (IDS). IEEE, 2018, pp. 165–170.
 [6]. N. Dlodlo, O. Gcaba, and A. Smith, “Internet
 of things technologies in smart cities,” in
 2016 IST-Africa Week Conference. IEEE,
 2016, pp. 1–7.
 [7]. Criteria air pollutants. [Online]. Available:
 https://www.epa.gov/criteria- air-pollutants
 Fig. 20. Linear regression for PM10 [8]. A. T. Teologo, E. P. Dadios, R. G.
 Baldovino, R. Q. Neyra, and I. M. Javel,
 V. CONCLUSION “Air quality index (AQI) classification using
 The paper presents the relationship between CO and NO2 pollutants: A fuzzy-based
the air quality on the street level and the density of the approach,” in TENCON 2018-2018 IEEE
vehicle traffic. The evaluation of the data reveals that Region 10 Conference. IEEE, 2018, pp.
some of the pollutant have very high correlation with 0194–0198.
the density of the traffic. These pollutants are O3, CO [9]. S. Duangsuwan, A. Takarn, R. Nujankaew,
and SO2.On the flip side, according to the and P. Jamjareegulgarn, “A study of air
measurements reported in this study, some pollutants pollution smart sensors LPWAN via NB-IoT
show a weak correlation with the traffic density.
 for thailand smart cities 4.0,” in 2018 10th
These pollutants are NO, PM2.5 and PM10. The
study considered just raw measurements and did not
 International Conference on Knowledge and
correct for environmental conditions (pressure, Smart Technology (KST). IEEE, 2018, pp.
temperature and humidity). Further work will 206–209.
consider these additional factors. [10]. S. Nigam, B. Rao, N. Kumar, and V.
 Mhaisalkar, “Air quality index a
 REFERENCES comparative study for assessing the status of
[1]. S. Nagaraj and R. V. Biradar, “Applications air quality,” Research Journal of
 of wireless sensor networks in the real-time Engineering and Technology, vol. 6, no. 2,
 ambient air pollution monitoring and air pp. 267–274, 2015.
 quality in metropolitan cities—a survey,” [11]. R. Rushikesh and C. M. R. Sivappagari,
 pp. 1393–1398, 2017. “Development of IoT based vehicular
[2]. S. Chaurasia, P. Dwivedi, R. Singh, and A. pollution monitoring system,” in 2015
 D. Gupta, “Assessment of ambient air International Conference on Green
 quality status and air quality index of bhopal Computing and Internet of Things
 city (madhya pradesh), India,” Int. J. Curr. (ICGCIoT). IEEE, 2015, pp. 779–783.
 Sci, vol. 9, pp. 96–101, 2013. [12]. "Weather Spark in Melbourne FL," [Online].
[3]. L. Song, “Impact analysis of air pollutants Available:
 on the air quality index in Jinan winter,” in https://weatherspark.com/y/18790/Average-
 2017 IEEE International Conference on Weather-in-Melbourne-Florida-United-
 Computational Science and Engineering States-Year-Round.
 (CSE) and IEEE International Conference [13]. R. W. Gore and D. S. Deshpande, “An
 on Embedded and Ubiquitous Computing approach for classification of health risks
 (EUC), vol. 1. IEEE, 2017, pp. 471–474. based on air quality levels,” in 2017 1st
 International Conference on Intelligent

 www.ijera.com DOI: 10.9790/9622-1004035158 57 | P a g e
Omar Alruwaili,etal. Journal of Engineering Research and Application www.ijera.com
ISSN : 2248-9622, Vol. 10, Issue 4, ( Series - III) April 2020, pp. 51-58

 Systems and Information Management
 (ICISIM). IEEE, 2017, pp. 58–61.
[14]. S. Kavitha, S. Varuna, and R. Ramya, “A
 comparative analysis on linear regression
 and support vector regression,” in 2016
 Online International Conference on Green
 Engineering and Technologies (IC-GET).
 2016, pp. 1–5.

 Omar Alruwaili,etal. “Correlation between Air Quality Index and Traffic Volume.” International
 Journal of Engineering Research and Applications (IJERA), vol.10 (04), 2020, pp 51-58.

 www.ijera.com DOI: 10.9790/9622-1004035158 58 | P a g e
You can also read


