2021 #21-060 VICTORIA HALL REDEVELOPMENT MICROCLIMATIC STUDY
←
→
Page content transcription
If your browser does not render page correctly, please read the page content below
#21-060

VICTORIA HALL REDEVELOPMENT
         MICROCLIMATIC STUDY

                 2021
                 MAY 25, 2021

                 submitted by:
VICTORIA HALL REDEVELOPMENT
MICROCLIMATE STUDY
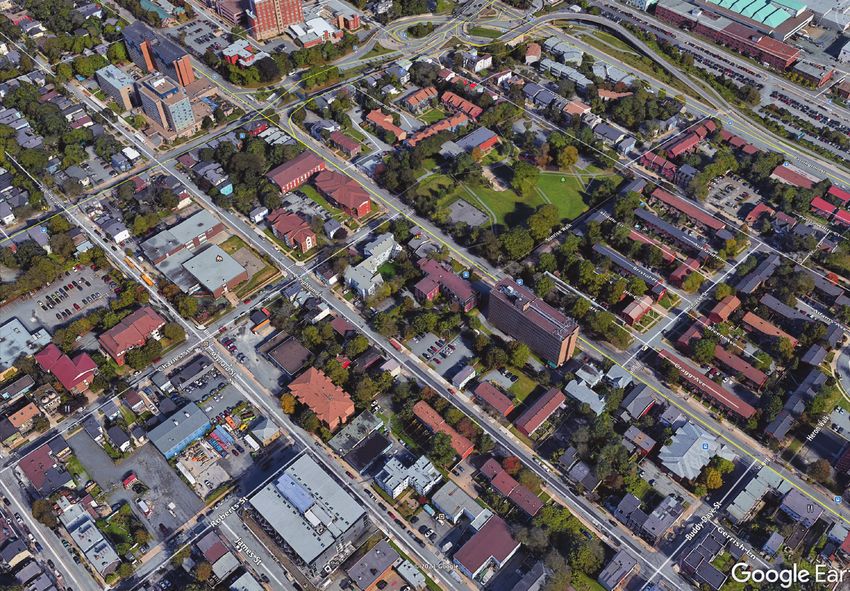
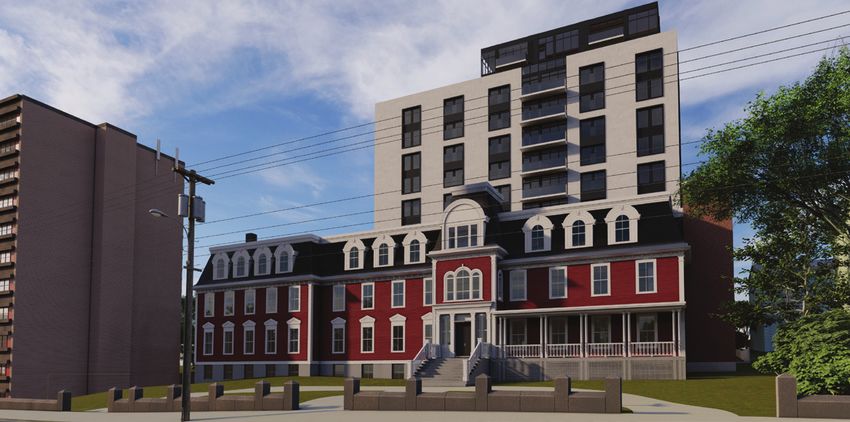
Fig. 1. Victoria Hall Redevelopment from Gottingen Street looking South
THE PROPOSAL
The proposed 12-storey (plus penthouse) multi-unit de-
velopment will replace a 3-storey rear portion of Victoria
Hall (VH) which is being removed as part of the develop-
ment plan (see Figure 2). The site lies just west of an exist-
Prevailing
ing 10-storey block tower and a range of different building Winter Wind
heights around It. Just to the north of this site, is the George
Dixon Park (See Fig 3).
The following qualitative wind assessment analyzes the
*
probable qualitative wind impacts on surrounding proper-
Prevailing
ties and public spaces as a result of the removal of the 3 Summer Wind
storey building at the back of Victoria Hall and replacement
with a single 12-storey building. This assessment follows
the protocols outlined in the Centre Plan Land Use Bylaw
(Appendix 1).
Fig. 2. Site Map
tel. +902 461 2525 l web: www.fathomstudio.ca 1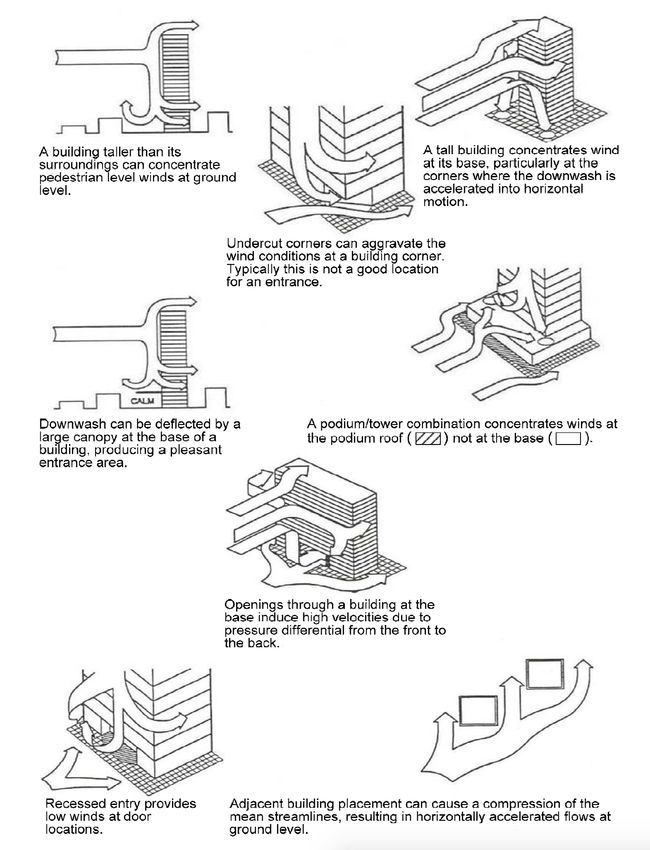
VICTORIA HALL: MICROCLIMATE STUDY
                                                     11

                                10

                       7

                                     10

                                                                      4

                                                          4

                                                                                      10
                            4

             4

                                                                  3

                                                                                           10
                                                                          3

                                                              3

Fig. 3.   Surrounding Building Heights looking North

Fig. 4.   Seasonal distribution of winds approaching Shearwater Airport (1988–2017)

    2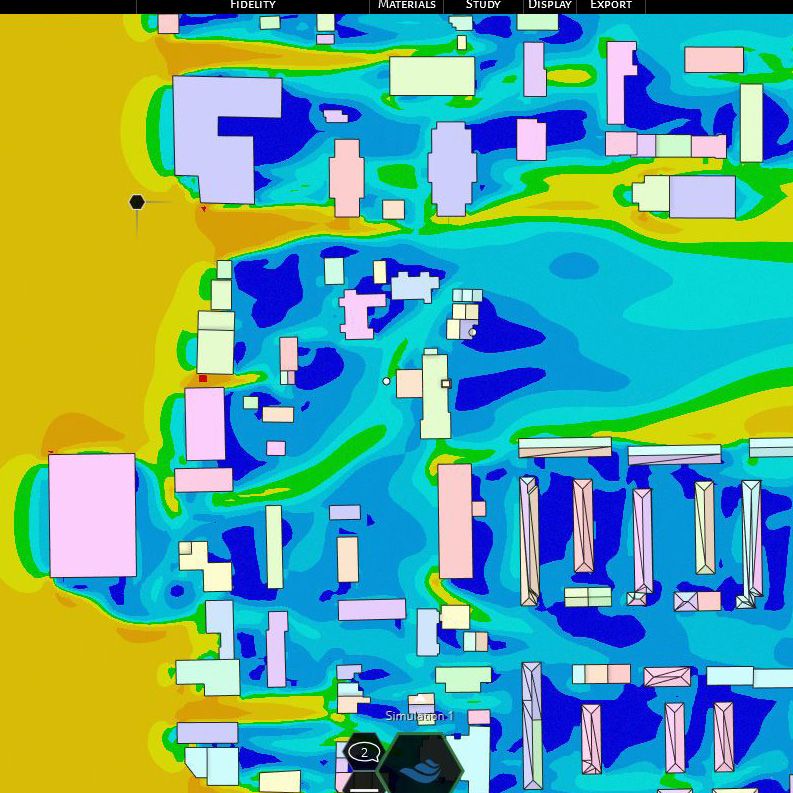
METHODOLOGY                                                   rarely exceed 30km/hr in the summer (May to Oct), while in
                                                              the winter (Nov-Apr) wind speeds over 30km/hr can occur
This microclimate study was designed to estimate human
                                                              as frequently as 9% of the time. This means that winter
thermal comfort changes resulting from changes to wind
                                                              wind conditions are much more likely to impact human
conditions and solar conditions surrounding the new de-
                                                              thermal comfort around the new building, and most of
velopment. For this assessment a series of computer simu-
                                                              these winds come from the prevailing north-western quad-
lations were prepared using a 3D solar modelling appli-
                                                              rant. In the summer months, wind speeds between 11-30
cation and a computational fluid dynamic (CFD) model to
                                                              km/hr occur about 65% of the time from the south-western
assess changes at the ground level for a variety of pedes-
                                                              quadrant so in the summer the prevailing wind direction is
trian activity types.
                                                              from the south-west.

WIND DATA                                                     PEDESTRIAN COMFORT:
Wind data was gathered from the local Shearwater Airport
                                                              Pedestrian comfort and safety is an important consider-
between 1988 and 2017 to understand the intensity, fre-
                                                              ation in the design of new developments in downtowns.
quency, and direction of winds near the proposed site. The
                                                              Building height and massing can have considerable im-
resulting diagrams (Fig. 4) were taken from the Centre Plan
                                                              pacts on human thermal comfort at the street-level im-
Land Use Bylaw for the key study periods (May to October
                                                              pacting the livability and walkability of neighbourhoods,
and Nov to April). These charts show that the highest and
                                                              snow loading on adjacent roofs and the general environ-
most frequent wind speeds annually and then monthly dur-
                                                              mental conditions in neighbourhoods.
ing the summer and winter. The coastal conditions in Hali-
fax bring winds from many different directions throughout     The Beaufort scale is an empirical measure that relates

the year resulting in prevailing winds mostly from south      wind speed to observed conditions on land and sea. The

and southwest in the summer and from the northwest in         attached Beaufort scale (Figure 5) is a general summary of

the winter. For most of the year, winds rarely come from      how wind affects people and different activities, and distin-

the north-east or south-east quadrant. The wind simula-       guishes at what points wind speeds can become uncom-

tions therefore focus on winds from the north-west and        fortable or dangerous. Wind speed is only one variable of

south-west quadrants mainly. In this location, wind speeds    human thermal comfort as described below.

Fig. 5.    Beaufort Scale

          2-5 mph       3-8 km/hr       calm                  Direction shown by smoke drift but not by wind
                                                              vanes
          5-7 mph       8-11 km/hr      light breeze          Wind felt on face; leaves rustle; wind vane moved
                                                              by wind
          7-10 mph      11-16 km/hr gentle breeze             Leaves and small twigs in constant motion; light
                                                              flags extended
          10-15 mph     16-24 km/hr moderate breeze Raises dust and loose paper; small branches
                                                    moved.
          15-20 mph     24-32 km/hr fresh breeze              Small trees in leaf begin to sway; crested wavelets
                                                              form on inland waters.
          +20 mph       > 32 km/hr      strong breeze         Large branches in motion; whistling heard in tele-
                                                              graph wires; umbrellas used with difficulty.

                                                                                         tel. +902 461 2525 l web: www.fathomstudio.ca   3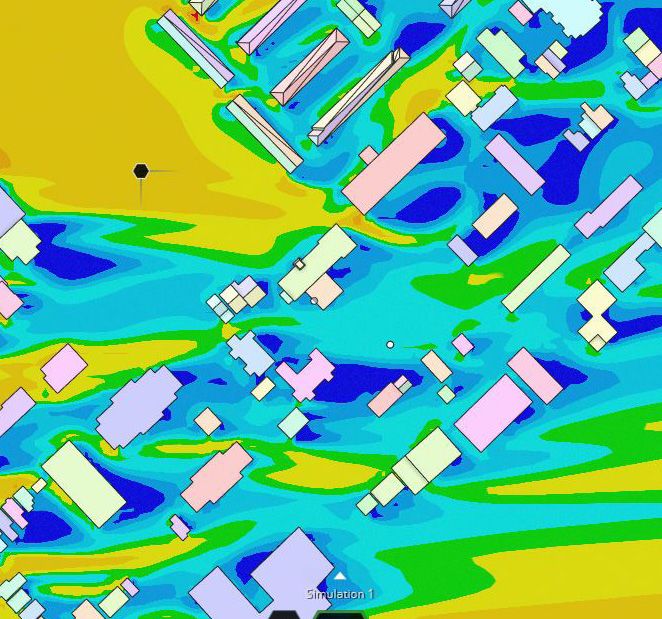
VICTORIA HALL: MICROCLIMATE STUDY

           URBAN WINDBREAK
                                                                               pressure at the top down the windward face increas-
                                                                               ing pedestrian wind speeds. The taller the exposed

           IMPACTS
                                                                               face is, the higher the wind speed will be at the base.
                                                                               The stepback surrounding the proposed tower at the

           Wake zones for zero porosity structures can extend 8-30             third storeys will receive the bulk of this downwash

           times the height of a structure. A 12-storey building (36m)         instead of the streets and surrounding properties.

           can generate increased wind speeds between 0.3 - 1km
                                                                          2.   The corner effect: at the windward corners of build-
           on the downwind side (see Fig. 6 and 7). Beyond the wake
                                                                               ings there can be unexpected increases in wind
           zone, there is typically more turbulence and eddies as a
                                                                               speeds as wind forces around the windward corners
           result of more turbulent air. This can be characterized as
                                                                               from high pressure on the windward face to low pres-
           being slightly more gusty winds with quiet periods inter-
                                                                               sure on the lee side. Some of the ways to decrease this
           spersed with gusts of wind. Directly behind the windbreak,
                                                                               impact is to create pyramidal steps which increases
           the quiet zone can extend from 0 to 8 times the height on
                                                                               the surface area of the edges.
           the downwind side. In this quiet zone, wind speeds can be
                                                                          3.   The Wake Effect: Wake is generally caused by both
           somewhat reduced causing a ‘wind shadow’. Around the
                                                                               the downwash and corner effect. The greatest impact
           edges of the building, wind speeds can increase as wind
                                                                               area occurs within an area of direct proportion to the
           flows around the structure.
                                                                               tower height and width on the lee side of the wind.
                                                                               Impacts are minimized by creating a stepback base on

           WIND IMPACTS FROM TALL BUILDINGS                                    the building.

           There will be a number of aerodynamic impacts from a           4.   Building Groups: The effects that occur individually
           new tall building including:                                        around buildings cannot be applied directly to groups
                                                                               of buildings. The cumulative effect of many clustered
           1.   Downwash: Wind speed increases with the surface
                                                                               tall buildings, like in this situation, can create a wide
                area of the building (i.e. height and width) so when a
                                                                               range of different wind scenarios that must be mod-
                tower is exposed to wind, the pressure differential be-
                                                                               elled as a group to understand the cumulative im-
                tween the top and the bottom of tower forces the high
                                                                               pacts.

Downwash                  The Corner Effect                     The Wake Effect                         Building Groupings
            Fig. 6.    Wind impacts on and from buildings in downtowns
 4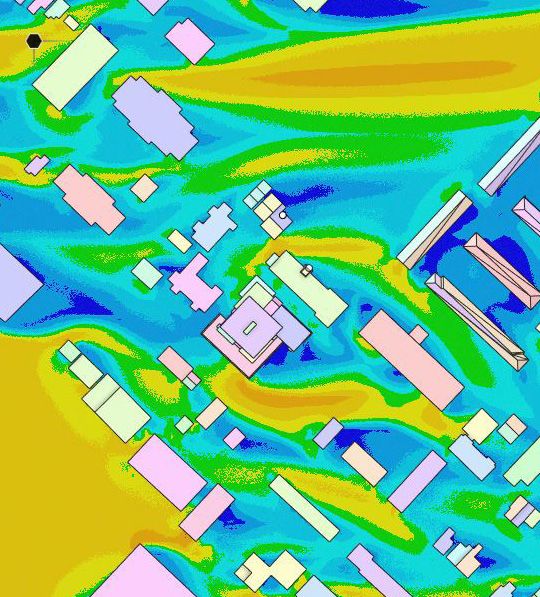
Fig. 7.   Typical Wind conditions near tall buildings
                                                        tel. +902 461 2525 l web: www.fathomstudio.ca   5
VICTORIA HALL: MICROCLIMATE STUDY

              WIND IMPACTS FROM
                                                                             els and are still time consuming and expensive. Results
                                                                             from CFD wind simulation are considered to be a reliable

              THE NEW BUILD
                                                                             sources of quantitative and qualitative data and are fre-
                                                                             quently used to make important design decisions. For this

              To simulate the impacts of different wind conditions and       wind assessment, a CFD model was employed using the 3D

              directions resulting from the building, Fathom employed a      model of the existing version of the building (simplified to

              CFD simulation (Computational Fluid Dynamics) to model         reduce modelling complexity) and a the proposed future

              the wind impacts at different times of the year. The CFD       building. The simulation was set at a starting wind velocity

              was constructed using Ansys Discovery 2021 which is a          of 15 m/s or 54 km/hr (yellow) to match the frequency an-

              platform commonly used for steady state wind simula-           alysis of the Shearwater wind data, and the simulation was

              tions. CFD simulations are now being widely used for the       allowed to run until steady state was achieved. Both ex-

              prediction and assessment of pedestrian wind comfort en-       isting conditions and future conditions were simulated to

              vironments and high-rise building aerodynamics. There are      show the difference between the anticipated wind condi-

              various types of wind analysis that can be carried out using   tions today and the changes resulting from the new tower

              a CFD and they provide a high predictive qualitative as-       behind Victoria Hall.

              sessment but more detailed quantitative assessments still
                                                                             As noted previously, the western semi-circle (360 degrees
              employ wind tunnels to measure actual wind speeds. Wind
                                                                             to 180 degrees counterclockwise), accounts for most of
              tunnels require the construction of scaled physical mod-
                                                                             the high wind conditions that would create uncomfortable

    Fig. 8.     North Wind Existing

                                                                                                                                 KM/Hr      M/S

    EXISTING CONDITIONS                                                                                                          65         18.1

                                                                                                                                 58.8
                                                                                                                                            15.1
                                                                                                                                 50.6

                                                                                                                                 43.4       12.1

                                                                                                                                 36
                                                                                                                                            9
                                                                                                                                 28.9

                                                                                                                                 21.7       6

                                                                                                                                 14.4
                                                                                                                                            3
                                                                                                                                 7.2

                                                                                                                                 0          0.00

6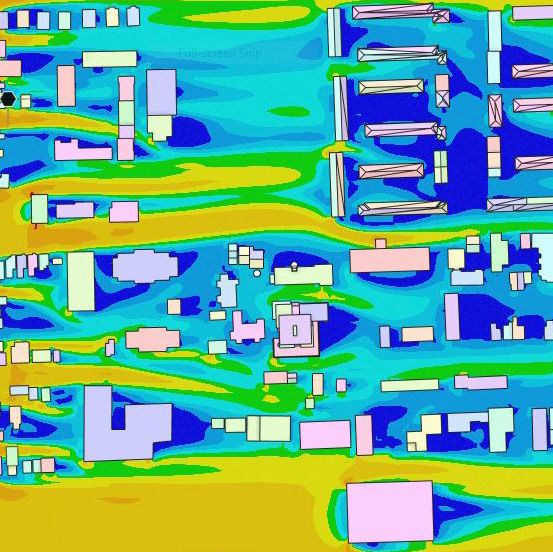
conditions for pedestrians. For this reason, our analysis fo-   reduce wind sheer travelling down the building, instead
    cuses on this semi-circle at 45 degree intervals. Generally     focusing it on the fourth storey terraces. Victoria Hall will
    speaking, the area around the proposed building is mixed        provide a 3-storey wind break for wind sheer from the tow-
    height with a range of low rise, mid rise and high rise tow-    er between the tower and Gottingen Street. The main en-
    ers within a few blocks of the site. The Gottingen neigh-       trance also includes a large canopy and inset doors to pro-
    bourhood in and around the site is also blessed with a ma-      vide additional wind protection from downdrafts and wake
    ture urban forest which reduces windspeeds at the ground        effects near the entry. Additional articulation of the street-
    level most of the year (more pronounced in the summer           wall creates additional building complexity designed to re-
    with full canopy). Trees were not considered in the simu-       duce wind effects at the street while providing architectural
    lation due to the complexity of modelling, but they would       articulation of the ground floors from the street. The para-
    have a further dampening effect on wind speeds.                 pets added to the top floor and 4th floor stepbacks will also
                                                                    capture much of the downdraft wind reducing street level
                                                                    impacts.
    DESIGN CONSIDERATIONS
                                                                    All of these architectural features have been purposely de-
    The proposed building has been purposely designed to
                                                                    signed by Fathom’s architects to reduce wind and provide
    reduce wind impacts with a 3-storey streetwall employing
                                                                    architectural articulation and visual interest to the building.
    a 6m stepback on the Maynard side of the building and a
                                                                    The 4th storey roof-deck on the new building will have to
    partial 2m stepback behind Victoria Hall. These stepbacks
                                                                    be designed for some gusting on the Maynard side of the

Fig. 9.   North Wind Future

                                                                                                                               KM/Hr            M/S

 FUTURE CONDITIONS                                                                                                             65               18.1

                                                                                                                               58.8
                                                                                                                                                15.1
                                                                                                                               50.6

                                                                                                                               43.4             12.1

                                                                                                                               36
                                                                                                                                                9
                                                                                                                               28.9

                                                                                                                               21.7             6

                                                                                                                               14.4
                                                                                                                                                3
                                                                                                                               7.2

                                                                                                                               0                0.00

                                                                                                tel. +902 461 2525 l web: www.fathomstudio.ca          7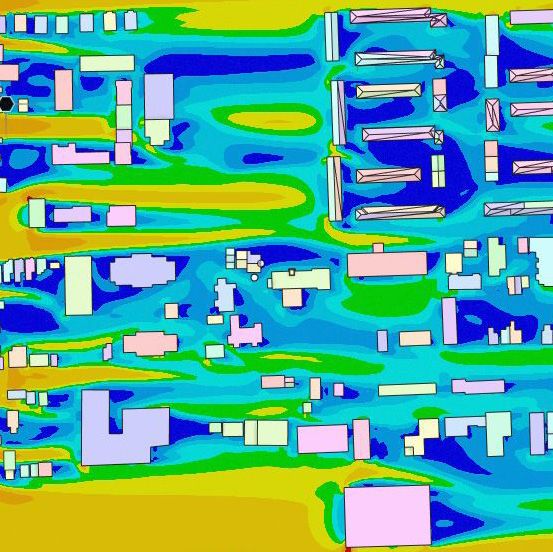
VICTORIA HALL: MICROCLIMATE STUDY

               roof-deck. The wind impacts vary around the building de-
                                                                               NORTH WIND IMPACTS (FIG 8 & 9)
               pending on the prevailing direction of the wind, and the
                                                                               Winds from the north are not overly frequent in the sum-
               wind speeds. In some places wind speeds will increase
                                                                               mer, but are a little more frequent in the winter. For ex-
               but in many areas, the higher building will create a greater
                                                                               ample, wind speeds over 30 km/hr only happen about 1-2%
               wind shadow than exists today.
                                                                               of the time in the winter and less than .5% of the time in the
               To keep the model simple (CFD’s are notoriously compu-          summer. The CFD simulation was set to start in the windi-
               tationally intensive simulations), we did not model trees       est conditions starting at 14m/s (Yellow) in order to model
               which can further reduce wind speeds at the ground by           a worst case scenario for pedestrian comfort. Areas in or-
               creating additional surface roughness. The simulations          ange and red are areas where wind speeds will be acceler-
               were run approximately 6’ (2m) off the ground. We mod-          ated at a higher wind speed than the starting wind speed
               elled existing conditions and future conditions from all dir-   (15 m/s to > 18 m/s).
               ections to contrast the differences that result from the new
                                                                               Looking at the existing and future conditions, the wind
               building.
                                                                               shadow is much more pronounced (see purple and blue
                                                                               areas) in the future condition and there are slightly lower
                                                                               wind speeds on Gottingen and Maynard. There is slightly
                                                                               windier conditions (orange and red) to the property west of
                                                                               the new building. Gottingen in front of VH gets slightly less
                                                                               windier than today.

    Fig. 10.     Northwest Wind Ex-
    isting

                                                                                                                                  KM/Hr         M/S

    EXISTING CONDITIONS                                                                                                           65            18.1

                                                                                                                                  58.8
                                                                                                                                                15.1
                                                                                                                                  50.6

                                                                                                                                  43.4          12.1

                                                                                                                                  36
                                                                                                                                                9
                                                                                                                                  28.9

                                                                                                                                  21.7          6

                                                                                                                                  14.4
                                                                                                                                                3
                                                                                                                                  7.2

                                                                                                                                  0             0.00

8
NORTH-WEST WIND IMPACTS (FIG 10 & 11) WEST WIND IMPACTS (FIG 12 & 13)
Winds from the northwest are the most frequent prevail- Winds from the west are the fairly frequent in the winter
ing wind direction in the winter and is fairly frequent in and relatively infrequent in the summer. Even though this
the Summer. Even though this direction is prevailing, wind direction is prevailing, wind speeds over 30 km/hr only
speeds over 30 km/hr only occur about 1% of the time from occur about 1% of the time from the northwest.
the northwest. The CFD simulation was set to start in the windiest condi-
The CFD simulation was set to start in the windiest condi- tions starting at 14m/s (Yellow) in order to model a worst
tions starting at 14m/s (Yellow) in order to model a worst case scenario for pedestrian comfort. Areas in orange and
case scenario for pedestrian comfort. Areas in orange and red are areas where wind speeds will be accelerated at a
red are areas where wind speeds will be accelerated at a higher wind speed than the starting wind speed (15 m/s
higher wind speed than the starting wind speed (15 m/s to > 18 m/s
to > 18 m/s Looking at the existing and future conditions, winds from
Looking at the existing and future conditions, there is very the west direction create slightly windier conditions on a
a slight increase in wind speeds on Gottingen Street when portion of Gottingen Street right in front of VH and for a
winds come from the north-west though it is less windy in small portion of Maynard Street south of the new building
the park across the street. There is little change on May- (though portions of Maynard in and around the school get
nard Street but slightly windier conditions at the back of less windy).
VH.
Fig. 11. Northwest Wind
Future
KM/Hr M/S
FUTURE CONDITIONS 65 18.1
58.8
15.1
50.6
43.4 12.1
36
9
28.9
21.7 6
14.4
3
7.2
0 0.00
tel. +902 461 2525 l web: www.fathomstudio.ca 9VICTORIA HALL: MICROCLIMATE STUDY
Fig. 12. West Wind Existing
KM/Hr M/S
EXISTING CONDITIONS 65 18.1
58.8
15.1
50.6
43.4 12.1
36
9
28.9
21.7 6
14.4
3
7.2
0 0.00
Fig. 13. Southwest Wind
Existing
KM/Hr M/S
EXISTING CONDITIONS 65 18.1
58.8
15.1
50.6
43.4 12.1
36
9
28.9
21.7 6
14.4
3
7.2
0 0.00
10Fig. 14. West Wind Future
KM/Hr M/S
FUTURE CONDITIONS 65 18.1
58.8
15.1
50.6
43.4 12.1
36
9
28.9
21.7 6
14.4
3
7.2
0 0.00
Fig. 15. Southwest Wind
Future
KM/Hr M/S
FUTURE CONDITIONS 65 18.1
58.8
15.1
50.6
43.4 12.1
36
9
28.9
21.7 6
14.4
3
7.2
0 0.00
tel. +902 461 2525 l web: www.fathomstudio.ca 11VICTORIA HALL: MICROCLIMATE STUDY
Fig. 16. South Wind Existing
EXISTING CONDITIONS KM/Hr M/S
65 18.1
58.8
15.1
50.6
43.4 12.1
36
9
28.9
21.7 6
14.4
3
7.2
0 0.00
There are little or no impacts to wind speeds on Gottingen
SOUTH-WEST WIND IMPACTS (FIG 14 & 153) or Maynard when winds come from this direction.
South-west winds are frequent in the summer months but
fairly infrequent in the winter months. Even though this SOUTH WIND IMPACTS (FIG 16 & 17)
direction is prevailing in the summer, wind speeds over 30
South winds are one of the most frequent wind direction
km/hr only occur less than 1% of the time from the south-
in the summer in Halifax, but are fairly rare in the winter.
west. In the winter, this direction occurs less than 2% of
Winds rarely exceed 30 km/hr from the south in the sum-
the time.
mer and winter.
The CFD simulation was set to start in the windiest condi-
The CFD simulation was set to start in the windiest condi-
tions starting at 14m/s (Yellow) in order to model a worst
tions starting at 14m/s (Yellow) in order to model a worst
case scenario for pedestrian comfort. Areas in orange and
case scenario for pedestrian comfort. Areas in orange and
red are areas where wind speeds will be accelerated at a
red are areas where wind speeds will be accelerated at a
higher wind speed than the starting wind speed (15 m/s
higher wind speed than the starting wind speed (15 m/s
to > 18 m/s
to > 18 m/s
Comparing the existing and future wind condition maps,
Looking at the existing and future conditions, winds from
the new building actually improves the wind conditions
the south direction generally slow the wind speeds on
in the park across the street but there are slightly windier
Gottingen and Maynard. The west corner of the building
conditions in the immediate vicinity of the new Building.
12Fig. 17. South Wind
Future
FUTURE CONDITIONS KM/Hr M/S
65 18.1
58.8
15.1
50.6
43.4 12.1
36
9
28.9
21.7 6
14.4
3
7.2
0 0.00
makes for a slightly windier spot at the west of the new building. The reaar of VH is windier in the future with winds from
the south.
WIND IMPACTS: OTHER DIRECTIONS
The other wind directions are infrequent enough that winds from other directions (10-170 degrees) will have very little
impact as a result of the new building. For the purpose of wind studies in HRM, these directions have been disregarded
for modelling due to their infrequent nature.
OTHER DESIGN CONSIDERATIONS
More often than not, this building could cause additional wind shadows (less windy conditions) surrounding the
development which improves the human thermal comfort from wind gusts, but this in turn, creates some additional snow
loading on surrounding properties as wind speeds are reduced causing snow to deposit faster. In the winter, there could
be some additional snow loading on the roofs and properties of the properties to the south of the new development.
tel. +902 461 2525 l web: www.fathomstudio.ca 13+1 month 06:05 20:02 13:57 01:17 shorter 05:33 20:34 15:01 01:26 shorter
+2 months 06:43 19:05 12:22 02:52 shorter 06:13 19:35 13:22 03:05 shorter
+3 months 07:22 18:08 10:46 04:28 shorter 06:52 18:39 11:47 04:40 shorter
+6 months 07:37 16:46 9:09 06:05 shorter 07:04 17:19 10:15 06:12 shorter
VICTORIA HALL: MICROCLIMATE STUDY
Notes: Daylight saving time, * = Next day. Change preferences.
Sydney, Canada - Sunrise, sunset, dawn and dusk times, graph
SHADE STUDY © Gaisma.com 23
22
21
20
During the summer solstice (June 21) Halifax receives 15.46 19
18
hours of sunlight with sunrise at 5:29 am and sunset at 8:53 17
16
pm. At the equinox (Sept 21 and March 21), Halifax gets 15
14
12.12 hours of sunlight with sunrise at 6:46 am and sunset 13
12
at 6:59 pm. On the shortest day of the year (winter solstice, 11
10
9
Dec 21), Halifax gets 8.37 hours of sunlight with sunrise at 8
7
7:40 am and sunset at 4:17 pm. 6
5
4
To study the shade impacts of the new building, a 3D model 3
2
of the site and surrounding context was constructed using
Sydney, Canada - Sunrise, sunset, dawn and dusk times for the whole year - Gaisma 1
142.177.178.217, 2020-07-20T16:08
a terrain model made from existing the topographic survey I II III IV V VI VII VIII IX X XI XII
using the city’s LIDAR database. The building was simulat- Darkness Dawn Sunshine Dusk Notes: How to read this graph? Change preferences.
© Gaisma.com
Date: N
2019-01-18 Time: 19:45 Sun path
ed at the equinox period as recommended in the land use 330 30 Today
Size: More: 10° June solstice
bylaw to assess the shade impacts at the mid point of the 20°
December solstice
20:56 30° 05:09
year. The model does not include trees which create addi- Annual variation
40°
Sydney, Canada
300 - Sun path diagram 06
60 Equinox (March and September)
20:44 50° 05:30
tional shade conditions except in winter for hardwood tree Sunrise/sunset
60° 06
species. 70° Sunrise
18 80° Sunset
The 3D computer model was placed in real-work space and W
18
09 E Time
15 09 00-02
assessed on an hourly basis for the Spring and Fall Equinox 12
03-05
15 12 06-08
(March 21 and September 21) periods. These simulations 09-11
240 120 12-14
provide a good overview of the intermediate shade condi- 16:18 07:40 15-17
tions which occur twice per year. 15 09 18-20
12 21-23
210 150
Equinox (March 21 and September 21): In the Equinox, 142.177.178.217, 2020-07-20T16:08 S
https://www.gaisma.com/en/location/sydney.html
the sunrise is at 7:00am and sundown is at 7:22pm giving Notes: • = Daylight saving time, * = Next day. How to read this graph? Change preferences.
only about 12 hours of sunlight. At 8:00am and 7:00pm, Size: + - Reset
the shadows are the longest (sun angles are low) so even a
Sydney, Canada - Seasons graph and Earth's orbit
tree can shade an area for very long distances up to 10x the
height of the object.
© Gaisma.com Events
Today
Because the building is next door to a 10 storey building, its X II I
December solstice
additional shade impacts will be minimal when compared to I I March equinox
X
I
existing Conditions. While the diagram may look like a large 1.02 AU
June solstice
September equinox
area east of the new building are impacted, when compared 1 AU
Perihelion [?]
II I
Aphelion [?]
X
0.98 AU
with existing conditions, there are only a few areas that re-
Earth's orbit
ceive slightly less sunlight per day during the equinox. The
This year
schoolyard of Joe Howe School would be in shade for one Min, years 1600–2600 [?]
IV
IX
Max, years 1600–2600 [?]
hour in the morning, and much of George Dixon Park would Variation, years 1600–2600
not be impacted except the corner of Gottingen and Sunrise Seasons
Winter
II
V
VI
Walk. Some of the townhomes on Uniacke Street will have Spring
VII VI Summer
about an hour or two less sunlight per day during the equi- Fall
142.177.178.217, 2020-07-20T16:08
nox but most of these are already impacted by the existing
Notes: Earth's orbit is highly exaggerated for illustrative purposes. Change preferences.
10-storey Sunrise Manour.
Size:
14
Next Previous
Event Date Time toFIG 8. SHADE STUDY
Fig 16. Equinox (Sept 21 & Mar 21)
HUMAN THERMAL
strongly depend on individual activity when they are sit-
ting, standing, walking or running. Someone sitting is un-
COMFORT
comfortable in lower wind speeds than someone running
or jogging. The comfort level also depends on the amount
Human comfort in an outdoor space is dependant on a of time that the person experiences the windy conditions.
number of variables including wind speed, activity level Generally, the Lawson model assumes that the wind
(sitting, walking, running), long-wave radiation (sunlight speeds are exceeded less than 5% of the time (3 minutes
emitted from the sun), temperature, shortwave radiation per hour). The Lawson criteria can be divided into a range
(heat emitted from surrounding buildings and site fea- of activity criteria comfort levels depending on wind speed.
tures), clothing level (partially to fully clothed), and relative
In our wind simulations, wind speeds which do not exceed
humidity. The combination of variables can be very com-
4 m/s (Purple our wind plots) are generally comfortable for
plex on any site leading to a wide range of human thermal
sitting. Once the color changes to blue (6m/s) the areas are
comfort outcomes. But many cities have developed criteria
comfortable for standing but a little uncomfortable for sit-
of comfort based on wind alone to determine relative com-
ting. Once the colour reaches light blue in our plots (8 m/s),
fort levels in different wind conditions.
the area is comfortable for strolling but a little uncomfort-
able for sitting or standing. Once wind speeds reach green
in our plots (10 m/s), the areas are comfortable for brisk
LAWSON WIND CRITERIA. walking. If the 10 m/s wind speed is sustained for more
Lawson criteria, are a series of comfort criteria categories
than 3-5 minutes it could start to get uncomfortable even
that quantify the worst wind conditions that most passers-
brisk walking. At wind speeds over 15 m/s for more than a
by will consider acceptable. Levels of pedestrian comfort
tel. +902 461 2525 l web: www.fathomstudio.ca 15VICTORIA HALL: MICROCLIMATE STUDY
minute (red in our plots), it is unsafe for elderly frail people. Once wind speeds exceed 20 m/s for more than a minute, it
is unsafe for many people.
KM/Hr M/S
81 22.6
72
18.9
63
54 15
S
45
11.3
36 D&E
27 7.5
C
B
18
3.8 A
9
0 0.00
BUILDING AND SPACE CONSIDERATIONS
The following is a summary of key microclimatic issues that will need to be addressed by the design team relating to
reducing impacts from the new building:
1. The stepback at the 4th storey surrounding the entire building is important for reducing downdrafts on the sur-
rounding neighbourhoods.
2. The extended cantilevered patios create surface friction which helps to break up wind speeds from the north-west
direction (prevailing winter).
3. Additional building articulation below the streetwall will further reduce wind speeds near the street.
4. The main entry canopy on Maynard Street will successfully reduce downdrafts near the entrance of the building.
5. There will be some additional snow drifting to the south of the new building due to the wind shadow created by the
building.
6. Maintaining or adding new trees on Maynard and Gottingen Street will be important to reducing wind impacts from
the new building. Any trees lost during construction should be replaced with wind tolerant large caliper species.
16You can also read