Responding to Assessed Climate Impacts: Implications for Bayside Planning and Community Resilience
←
→
Page content transcription
If your browser does not render page correctly, please read the page content below
Responding to Assessed Climate Impacts: Implications for
Bayside Planning and Community Resilience
                                          Lalitha Ramachandran, Senior Project Manager Sustainability
                                                              Kate Nagato, Foreshore Place Manager
                                                              Department of Environment & Renewal,
                                                                                 City of Port Philllip

Background
The City of Port Phillip is a highly developed and densely populated inner urban municipality
just south of the City of Melbourne, and contains part of the southern Melbourne CBD. One of
10 municipalities around Port Phillip Bay, it has 11 kms of foreshore from Port Melbourne to
Elwood. As well as being a popular and vital tourist and urban beach destination, it contains
some of Melbourne’s iconic foreshore buildings (Luna Park, SeaBaths, Palais Theatre) and
premier entertainment and café destinations (Acland Street, Fitzroy Street).
The City is built on mostly low lying coastal swamp, with a flat, sandy terrain that is now largely
covered (over 80%) by impervious surfaces. The City also is an end-of-pipe, upstream urban
stormwater receiver before its entry into the Bay; much of this received stormwater has high
pollutant loads.

Climate Change in the City of Port Phillip – An Initial Perspective
In January 2007, the City of Port Phillip released Climate Change in the City of Port Phillip – An
Initial Perspective. The report aimed to provide an assessment of the local and regional
impacts and likely flow-on effects from known and estimated climate change (2020, 2050,
2100) and the resulting consequences and challenges facing the City. It also aimed to provide
some clear emerging directions, considerations and implications for Council and the
community in both greenhouse gas abatement and climate change adaptation. The report
combined 3 primary aspects:
      1. A commissioned assessment of the anticipated local impacts (by Earth Systems and
          Planning Research Centre, University of Sydney) and an analysis of the likely
          implications on the municipality
      2. A compilation of international and national data on global climate and likely regional
          economic, social and environmental impacts (draft 4th IPCC Assessment Report, Stern
          Review)
      3. A footprint of the municipality’s greenhouse gas emissions (1996-2006) and water use
          (2001-2006).
The focus of this paper however, is primarily on the first aspect – the risk identification and
assessment of local climate impacts. The results suggest a range of risks to Council assets and
services as well as for the broader community that require an urgent response. This paper

                                                                                                      1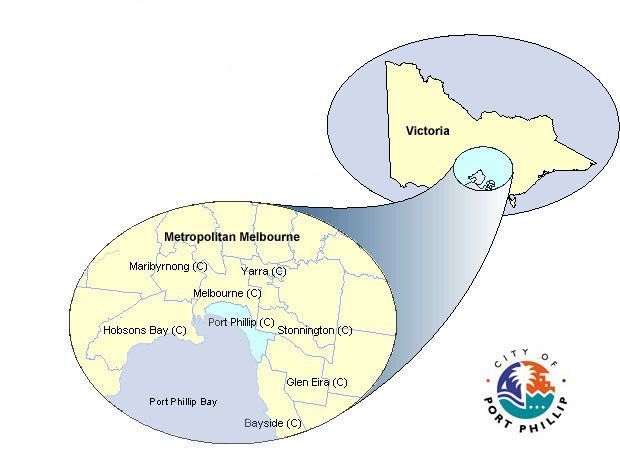
provides an overview of the City’s identified climate risks and flow-on effects, the City’s
approach to climate adaptation action, and the findings and learnings to date.

What’s Different About This Local Climate Risk Assessment?
The City of Port Phillip’s local climate risk identification and assessment report was the first local
climate change risk and impacts assessment by an Australian Local Government. Most
critically, it increased council and community consciousness about both greenhouse gas
abatement and climate adaptation, and the differing responses to each.
It also placed the climate adaptation agenda on the map for other Victorian councils. Like
many other Australian Local Governments, in 2006 the City initiated an agenda to move
toward carbon neutrality, later setting ambitious greenhouse and potable water use
reductions targets and timelines for both council and the municipality as a whole (see Toward
Zero Sustainable Environment Strategy). However, the City also initiated abatement action, at
the time, a policy and strategy sleeper for most other Councils, state and federal agencies.

The City of Port Phillip’s approach to climate adaptation is as follows.
Strategic Framework for Climate Adaptation, City of Port Phillip                                   When
STAGE 1 – IDENTIFY and ASSESS LOCAL CLIMATE RISKS                                                  Completed
           Identify local climate risks (such as sea level rises, storm surges, temperature       and Published
           increases) and determine level of risk                                                  - Jan 2007
           Assess local flow-on effects (determine on-ground effects on assets, infrastructure,
           services, significant sites, properties)
STAGE 2 – ANALYSE LIKELY PRIORITY ACTIONS TO REDUCE RISK                                           Anticipated
A comprehensive analysis of how the City might meet 5 identified primary adaptation needs          completion –
as follows –                                                                                       Dec 2008
     1. Flooding and stormwater management (including permeability and water quality)
     2. Building, planning and development
     3. Beach and coastal management (including erosion)
     4. Infrastructure management (including roads, drainage, maintenance)
     5. Emergency management.
The analysis includes likely actions required, by when, at what likely cost, and in partnership
with whom. It also combines a comprehensive in-council assessment, consultation on issues
and emerging solutions with state and regional agencies, and whole-of-catchment modelling
and mapping in key needs areas.
STAGE 3 - DEVELOP and IMPLEMENT ACTION PLAN                                                        Anticipated
           Resulting Action Plan and regional consultation.                                       completion
           Adopt and Implement Action Plan (reviewed biennially)                                  June 2009
Effective implementation will definitely require strengthened Local Government advocacy to,
and partnerships with, state, federal and regional agencies.

Stage 2 allows the City of Port Phillip to proactively understand and prepare for the changes
required to how we currently plan, manage and service the municipality and community. It
also allows the City to understand and evidence the institutional and statutory barriers to such
change at the local level, and initiate action in the correct channels to overcome such
identified challenges.

Risk Assessment of Local Climate Impacts - Area of Study, Methodology and Data
The study area (10km2) covered the southern half of the municipality’s foreshore area – from
Albert Park to Elwood and across to St. Kilda Road. It encompasses around 20,750 residential
properties, 1,000 commercial properties, one of the City’s major activity centres and several
significant neighbourhood activity centres, and some of the most popular and visited foreshore
areas. It includes Elwood Canal and some of the City’s primary flood risk areas.
The methodology is consistent with AS/NZS 4360:1999 and outlined in Climate Change Impacts
and Risk Management – A Guide for Government and Business (AGO, 2006). The assessment
used CSIRO’s CLIM tool and all data and aerial imagery available at the time (local, Bureau of
Meteorology, state and national). In summary, 2 sets of data were combined - the likelihood of
an event and the impact (consequence) of that event. Each was given a score out of 5
(negligible, low, moderate, high, extreme), and then combined to provide a risk score.

                                                                                                           2
In the last 18 months, there have been vast advances in data imaging. Equally, current
climate science indicates an accelerated rate of pace of climate change. The City of Port
Phillip will be completing a data update in consultation with state and regional agencies
(August 2008) to ensure its remaining assessments use the latest climate science.
Assessed Local Impacts and Flow-on Effects from Climate Change
The following table outlines the local climate trends, the climate risk impacts and their primary
flow-on effects for the City of Port Phillip.
Indicator Local Climate Impacts Primary Associated Risks
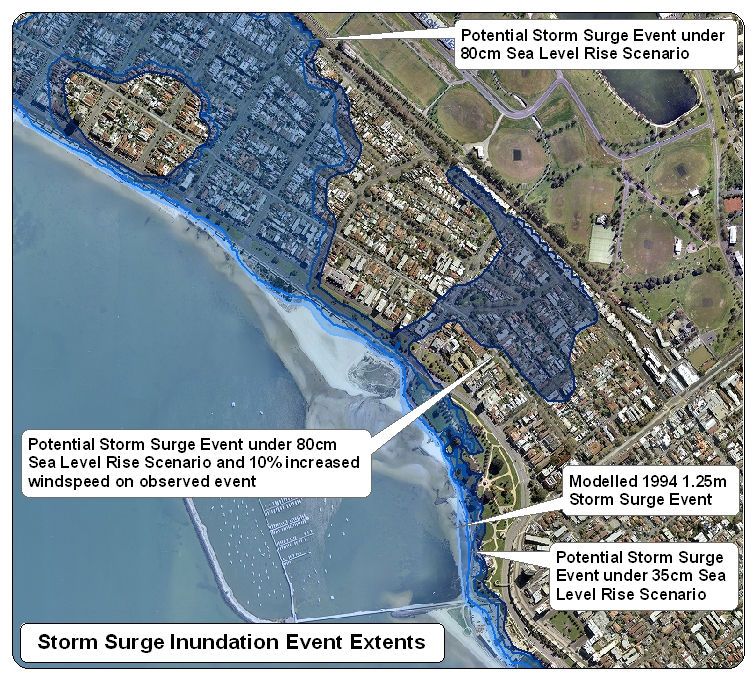
Sea Level Over the last 10 years, an averge sea level Infrastructure Instability – Beachside buildings and infrastructure,
Rise, Storm rise of 3cm has been estimated for Port particularly in St. Kilda (St. Kilda Pier, Harbour Marina, SeaBaths
Surge and Phillip Bay. The observed rises in sea level and Luna Park) and residential areas adjacent to Elwood Canal,
Storm Tide for the City are largely consistent with the are especially at risk. The City’s coastal bike trails and paths and
global trend. beachside amenities are also at significant risk.
Average sea level rises for the City are Loss of beaches - Coastal infrastructure combined with severe
estimated to be 4.5cm (3-10cm range) by storm events has already contributed to significant coastal
2020, 13.5cm (5-30cm range) by 2050 and erosion around Port Phillip Bay in the last 50 years. Modelling of
28.5cm (10-88cm range) by 2100. Middle Park Beach indicates that with a mean sea level rise of
As linear extrapolation of current trends 30-50cm, the actual recession of the beach berm may be
may not be an accurate indication of between 3.5m and 5m respectively. Middle Park and St. Kilda
future changes of variables that increase Beach are susceptible to erosion and potential loss as a result.
risk, the ranges above (IPCC and CSIRO) West Beach is particularly susceptible to subsequent sediment
provide indicators of upward variability. deposition. This could result in siltation and subsequent
obstruction of the Royal Melbourne Yacht Squadron slipway
Potential future storm surge levels in Port
Phillip Bay include a 1.65m storm surge with entrance.
a 35cm sea level rise, a 2.06m storm surge Impacts on planning zones – Increased storm surges and tides
with an 80cm sea level rise, or a 2.31m leading to potential flooding mean planning designations are
storm surge with an 80cm sea level rise and likely to be affected in the future. Flooding was the third highest
a 10% wind speed increase. primary risk, and has a lower likelihood of occurrence in the
short term, but is likely to be the primary driver behind planning
zone impacts. The areas most at risk from coastal inundation
and resultant salinity are low-lying areas around the St. Kilda
foreshore and Elwood Canal. Flooding of these areas is likely to
affect key infrastructure and areas such as Acland Street,
Catani Gardens, The Esplanade and Beaconsfield Parade, and
residential properties around Elwood Canal.
Flooding of coastal properties – Erosion increases the
vulnerability of coastal infrastructure and buildings to wave
attacks during storm events. The City’s study area has over 9000
addresses within 3 km of the coastline and below 4m in
elevation. These are the most at risk from beach erosion and
subsequent flooding. Key tourist attractions (Acland Street,
SeaBaths, Luna Park) are also at risk of flooding.
Additional Impacts – Damage to coastal ecosystems and
vegetation, deposition of debris on beaches.
Intense Climate change will increase the Stormwater Runoff – Impacts focus around the quality, quantity
Rainfall magnitude (duration, intensity and and flow rate of stormwater; which in turn depend on the area
frequency) of storm events. of impervious surface and storm intensity/duration. High
The following storm intensity estimations are resolution aerial photography (2004) of the study area suggests
likely for the City – 5% increase in intensity that about 80% is impervious. In dry periods, the permeability of
of a 20 yr event by 2020, 35% increase in pervious surfaces decreases, and is not as capable of dealing
intensity of a 20 yr event by 2050, 70% with intense rainfall, resulting in increased runoff when it does
increase in intensity of a 20 yr event by rain. Primary impact areas as a result of the primary risk areas
2100. include stormwater and drainage management, stormwater
CSIRO also predicts a 5% increase in storm quality and planning zone implications for onsite stormwater
management (WSUD) and increased permeability.
event rainfall per degree of climate
warming. It is estimated that a 5% increase Flooding – Flooding can occur from accumulated stormwater
in intensity of the standard design 1 in 100 runoff that drainage infrastructure is unable to cope with. There
year ARI would result in an additional are approximately 4000 residential properties within the existing
1.8mm of rainfall per 2 hour storm event, ARI flood extents that are at very high risk from future flood
and a 10mm increase in flood levels. In events. The City’s roads are also susceptible to flooding; this
short, it results in a 1 in 70 year event. increases the risk of lack of access for people moving in/out of
the City as well as emergency services, and can impede
transportation services.
3Indicator Local Climate Impacts Primary Associated Risks
Extreme There will be an increased frequency of Roof and Structure Damage from heavy winds – corrugated iron
Weather strong winds, hailstorms and lightning. It is roofs and fences are particularly susceptible
Events estimated that changes to hailstorm and Damage to Buildings, Powerlines and Roads from falling trees
lightning events will be negligible. The and branches – general infrastructure damage, energy
primary impact is strong winds. Like storm infrastructure damage, indirect roof and building damage,
surges and intense rainfall, increased strong increased maintenance and clean-up. A 25% increase in peak
winds indicate changes to atmospheric gust can cause a 650% increase in building damages (AGO
and surface temperatures, which affect 2006). Wind gusts during the February 2005 storms reached 104
pressure systems resulting in increased wind km/h and resulted in $300,000 worth of damage to trees alone
speeds. Strong winds can therefore and over 12,000 reports of building damage (Port Phillip City
exacerbate the effects of storm surges and Council, 2005). Wind gusts in April 2008 reached 132 km/h and
intense rainfall. cut power to 300,000 homes and properties in Victoria.
Temperature The best available predictions for Port Phillip Heat-related illness – Primary risks are heat stress, heat stroke,
Rises indicate that mean temperature may heat exhaustion and dehydration, as well as exacerbation of
(Study increase further by 0.5°°C by 2020, 1.5°°C by respiratory and cardiac conditions. The primary group at risk is
assumed 2050, and 2.5°°C by 2100 as a result of the 25% of the City’s population over 60 years. The secondary
that there climate change. Each 1.0°C rise is group are the anticipated increased numbers of beach-goers.
has already equivalent to towns in southern Australia Water and Energy Demand – Extremely hot days generally result
been a 1.0°°C shifting northward by about 100km (BOM, in sharp increases in peak energy and water demand.
rise in 2006). The number of days over 35°°C in
Infrastructure Risks – Extreme heat can affect road materials
temperature) Melbourne will increase from 9 days to 11 and undermine their stability, leading to drying out and cracking
days per year by 2020, 16 days by 2050 and
of building materials. However, these impacts are more as a
as many as 40 days by 2100.
result of persistent increased mean temperatures.
In 2005, the average Australian Fire Risk – Increased fire risk and propensity to bushfires across
temperature was 0.9°C above the
Victoria, as well as increased smog mean that Melbourne’s air
standard 1961-1990 average. There has quality is likely to deteriorate during hot and dry periods. Timber
also been an increase in the frequency of structures and other flammable materials in residential properties
heat waves in the last 5 years. are also at increased risk of fire.
Decreasing Regional predictions for Victoria indicate a Water Availability - Coupled with falling rainfall and inflows to
Precipitation decrease in precipitation per degree of Melbourne’s catchments, Melbourne is likely to continue
and climate warming. Future precipitation experiencing dry spells and droughts, as well as significant water
Increasing decreases across the City include a shortages.
Evaporation decrease of 2% by 2020, 4% by 2050 and Water Quality - Decreased precipitation can affect water
15% by 2100. Coupled with decreasing quality. Negative water quality impacts on Port Phillip Bay are
precipitation is the potential increase in possible due to increased concentrations of pollutants entering
evaporation. The average potential the Bay coupled with higher ambient bay water temperatures.
evaporation for Melbourne is estimated to Decreased stream flow can also reduce the quality of water
increase by 3% by 2020. entering Melbourne’s catchments.
In effect, our climate and terrestrial Biodiversity, Parks and Gardens – Changes in precipitation
surfaces are becoming progressively dryer, coupled with less rainfall and encroaching saline waters will
with even less humidity. significantly impact on both vegetation and wildlife.
Rainfall - The last 10 years have recorded Infrastructure Damage and Thermal Comfort – Moisture loss from
annual rainfall of over 100 mm below the building materials and soil (ground subsidence) can lead to
Melbourne average (539 vs 655mm pa). warping in timber and cracking in mortar, as well as consequent
This is likely to lead to step decreases in instability of building foundations.
rainfall to 510 mm pa by 2020 and to
465mm pa or 25% less than standard by
2050.
The Flow-On Effects from Local Climate Impacts
In summary, the following were demonstrated to be highly likely.
By 2020 -
Increased flooding and storm damage of properties and infrastructure – at least 9000
properties at high risk of inundation, traffic and debris congestion very likely to cause
further damage to nearby properties in floods
Increased pressure on drainage infrastructure capacities and requirements for stormwater
and flood management (action needs to be initiated from at least 2010 to meet the
challenge)
Increased loss of beaches as well as additional beach debris (already very costly)
Increased structural damage to built form from prolonged and extreme hot and dry
weather
Increased heat stress and drought on parks, trees, reserves
4 Increased need for adequate and current emergency response management.
By 2050 -
Accelerated beach and coastal erosion
Regular flooding and inundation
Regular storm damage to properties and infrastructure
Increased infrastructure and built form instability and subsidence
Increased heat-related and respiratory illnesses.
City of Port Phillip - Storm Surge Inundation Estimates -
Resulting Climate Adaptation Recommendations from the Report
The report provided a series of adaptation and abatement recommendations for action. The
adaptation recommendations, many of which have been initiated, are as follows:
1. Expansion of local climate risk identification and assessment regionally across both Port
Phillip Bay (Association of Bayside Municipalities) as well as neighbouring upstream
catchment (inner Melbourne and Yarra region) to provide the following primary
outputs –
o Comprehensive local climate data, modelling and research across Port Phillip Bay
and inner Melbourne/Yarra region over the next 4 years
o A Local Government climate risk assessment tool to strategically identify priorities
and develop solutions
o Regional and national collaboration to achieve the other recommended outputs.
2. An assessment of Council infrastructure with regard to capacity to be climate-adept.
This includes Council’s stormwater and drainage systems, road infrastructure in identified
5risk areas such as coastal roads and low-lying areas, and coastal public amenities and
facilities
3. An assessment of Council and community assets with regard to capacity to be climate
adept. This includes most of Council’s public buildings, coastal parks and reserves, and
recreational facilities along the foreshore, as well as properties (residential and
commercial).
4. Enhanced efforts to secure changes to the state planning policy framework for
sustainable and climate-adept built form through the planning and zoning process.
Consideration of the development of an adaptation planning tool that works side-by-
side with sustainable design tools such as STEPS/SDS to assist all developments,
redevelopments and renovations in the municipality to become more sustainable and
climate-adept.
5. Water sensitive urban design to develop a City with increased permeability, increased
stormwater quality, reduced water needs, and stormwater calming infrastructure
6. An assessment of Council’s foreshore and coastal management with regard to
managing erosion, calming coastal inundation and flooding/stormwater management.
7. An assessment of Council’s management plans and contracts with regard to managing
local climate impacts, particularly in drought and heat management, beach cleaning
and maintenance, vegetation management, planning and surface conditioning, site
development or redevelopment.
8. An assessment of the municipality’s emergency management with regard to capacity
for effective responses to community safety in the event of severe weather events or
floods.
9. Increased efforts to regionally advocate for and collaborate on climate change action,
through Council’s current regional Local Government forums such as RMF (Regional
Mayors Forum), IMAP (Inner Melbourne Action Plan) and ABM (Association of Bayside
Municipalities).
Lessons and Emerging Challenges to Date
The Flooding Paradox -
Victorian Councils have responsibility for land use planning and stormwater drainage but no
statutory responsibility for floodplain management. The City of Port Philip’s flood management
requirements now include -
Catchment - How to get more water out quickly (inundation, storm water – both local and
upstream)
Sea - How to keep more water out more effectively (sea level rise and storm surges)
Increased efforts to reduce pollutant loads in stormwater and increase water quality to the
Bay
Current primary challenges include –
The lack of current science and modeling to inform emerging solutions, for instance,
updated flood modeling and whole-of-catchment mapping (such as of stormwater, total
drainage capacity)
The lack of a holistic approach to regional modeling and consultation on emerging
solutions – for instance, the Department of Sustainablity and Environment’s Future Coasts
Study only examines coastal impacts.
Emerging solutions already look to combine a variety of defensive (eg. sea walls) and
flood calming (eg. stormwater reticulation tanks) measures, but their considerations to
date demonstrate that without a widely consulted regional approach using current
climate science, we are unlikely to find and implement solutions that may not have an
6adverse impact in some other direction (example, neighbouring municipality).
The Planning Paradox -
Victorian Councils have no legislative power to require either sustainable design or climate
adaptation requirements in planning and building beyond the minimum standards set by the
state and federal governments (currently non-existent). The City of Port Philip’s planning and
development management requirements should now include –
State allowance of local planning scheme amendments and overlays addressing
flooding and structural integrity for over 40% of all existing properties and development
sites in the municipality (at least 20,000 properties/sites)
The capacity to limit foreshore site developments that do not address identified local
climate risks; as well as the capacity to retrospectively require appropriate climate
adaptation measures on significant foreshore buildings and developments.
The capacity to limit Local Government liability from past planning decisions when climate
change impacts affect foreshore properties.
Current primary challenges include -
The lack of proactive state and federal action in setting minimum climate adaptation
(and sustainable design) standards in both planning frameworks and building codes.
The absence of state planning policy addressing climate adaptation based on current
science and modeling.
Who wears the cost of abandoning property and retreating to higher ground? Federal
legislation (such as Environment Protection and Biodiversity Conservation Act 2000)
effectively makes Local Government responsible for community liability.
The Playground Paradox -
Urban beaches are a vital part of the intricate web that currently sustains community vitality
and sense of place in most inner urban Cities with a foreshore around Australia. Port Phillip’s
beaches are already facing increasing erosion from storm surges and extreme weather. The
City of Port Philip’s foreshore management requirements should now include –
Supporting and protecting urban beaches – in effect, beach protects infrastructure
protects properties
Retreat is not an option for urban communities! There is nowhere to go….
Increased foreshore pollution – debris and rubbish.
Current primary challenges include -
The lack of regional foreshore management plans and policy using current science and
whole-of-catchment modeling ( There is a Victorian Coastal Strategy but not a
management plan)
Beach renourishment is increasingly complex, expensive and short-term
Issues with long-term solutions (eg. groynes) are primarily around balancing aesthetics with
effectiveness
Conclusion
Risk management is not a new area for Local Governments, and indeed, a critical component
to good local governance. However, climate change does pose new challenges and
solutions that require new ways of doing and thinking. This is undoubtedly complicated by the
rate of pace of climate change and the resulting shifts in climate science. Equally, many of
the practical solutions to both climate adaptation and greenhouse gas abatement are
already there.
Cities can proactively manage & reduce the local impacts of climate change through
adaptation solutions that make local spaces climate-adept & act to prevent the worst
impacts. Most critically, proactively laying the foundation for a climate-adept future City is
going to be the cornerstone for building community resilience. The City of Port Phillip is up for
the challenge!
7You can also read