Changes in northern farming system climate conditions - Goondiwindi
←
→
Page content transcription
If your browser does not render page correctly, please read the page content below
Changes in northern farming system climate conditions - Goondiwindi
               Steven Crimp and Mark Howden, Australian National University

Key words
climate projections, production impacts, adaptation options

Take home messages
•   Greenhouse gas (GHG) emissions continue to accumulate in the earth’s atmosphere and drive
    warmer global temperatures. Warming of globally averaged air temperatures of just over 1oC
    since records began in 1850 has produced national, regional and local changes in environmental
    conditions. These changes have shifted debate from “Is climate change real?” to “What should
    we do about it?”
•   Adapting agricultural practises will be required to respond to changing environmental conditions
    and will require all components of the agricultural value chain to work together in order to
    maintain resilient and profitable food systems

Historical changes in climate?
Preliminary results suggest that 2019 is likely to be either the second or third warmest year on
record, with globally annual averaged air temperatures now 1oC warmer than the long-term average
calculated for the period 1961 to 1990. This warming is driven by increasing concentrations of all
the major long-lived greenhouse gases in the atmosphere, with carbon dioxide (CO2) concentrations
rising from 208ppm prior to the industrial revolution, to 413.65 ppm as of 4 January 2020 (NOAA,
2020).
In Australia, warming in average temperature (average temperature) has resulted in 2019 being the
warmest year on record (1.52oC above the 1961 to 1990 average of 21.8oC) (BoM, 2020). Average
daytime maximum temperatures in 2019 of 30.69oC were 2.09oC above the 1961 to 1990 average.
In December 2019 more than 40% of the entire country recorded maximum temperatures greater
than the 97th percentile i.e. top 3% of temperatures. Examining the shift in the distributions of
monthly day and night-time temperature shows that very high monthly maximum temperatures that
occurred around 3% of the time in the past (1951–1980) now occur around 12% of the time (2003–
2017) (BoM & CSIRO, 2018). Very warm monthly minimum, or night-time, temperatures have shown
a similar change from 2% of the time in the past (1951–1980) to 12% more recently. This shift in the
distributions towards hotter temperatures and more extreme high temperature conditions has
occurred across all seasons, with the largest change being in spring (BoM & CSIRO, 2018).
In the Goondiwindi region over the period 1960 to 2019 (length of the temperature record),
warming has occurred in both minimum and maximum temperatures with mean temperatures now
approximately 1.4oC warmer than in 1960. For the period 1960 to 1991 an annual average maximum
temperature of 28oC occurred, on average, 10% of the time. More recently (1992 to 2019) this
temperature now occurs on average 19% of the time. Similarly mean annual minimum
temperatures have warmed with the frequency of a minimum temperature of 13oC increasing from
25% to 35% of the time (Figure 1). Despite warming in both minimum and maximum temperatures
the number of frost events (i.e. defined here as the temperatures below 0oC) has more than tripled
during June to August, with an average of 9 events occurring most recently. Daily minimum
temperatures of -2oC now occur 38% of the year as opposed to only 20% of the time over the period
1960 to 1991. When examining the extreme daily maximum temperature values, considerable
warming has occurred in Goondiwindi. Extreme maximum temperatures of 43oC occurred on
average 18% of the year for the period 1960 to 1991 (Figure 2). During the more recent period
(1992 to 2019), this temperature occurred, on average 38% of the year.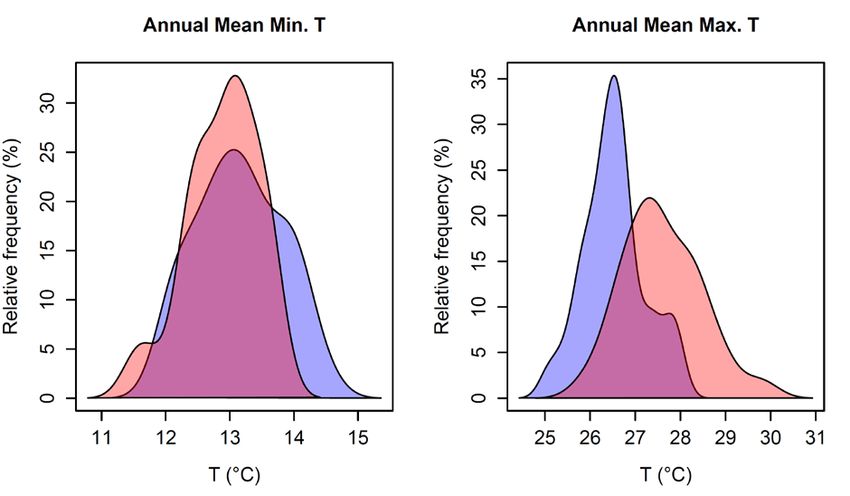
Figure 1. Probability distributions of annual mean maximum temperature (right) and annual mean
minimum temperatures (left) for Goondiwindi for two periods, namely 1960 to 1991 and 1992 to
2019.
Figure 2. Probability distributions of daily maximum temperature extremes for Goondiwindi for two
periods, namely 1960 to 1991 and 1992 to 2019.
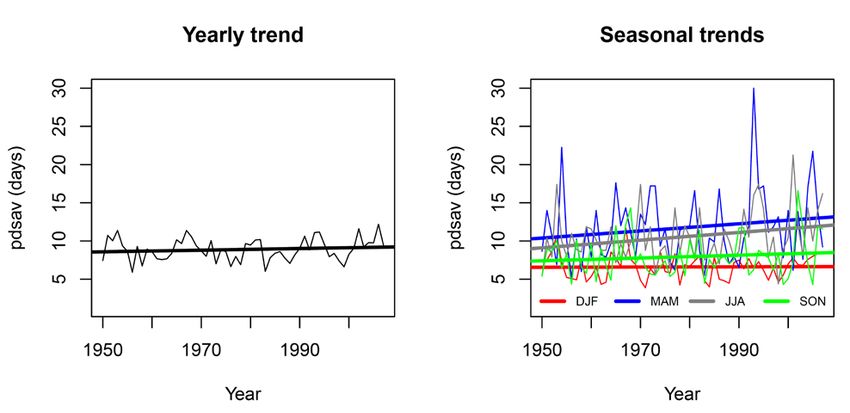
The Goondiwindi rainfall record exhibits a declining trend, with declines during the June to August
and September to November periods most pronounced. Mean dry spell lengths have also increased,
with the average time between rainfall events now three days longer during June to August (i.e. an
average dry spell length of 12 days for the period 1986 to 2018) (Figure 3). Similarly the number of
heavy rainfall events (i.e. greater than the 90th percentile) across the whole year has declined, again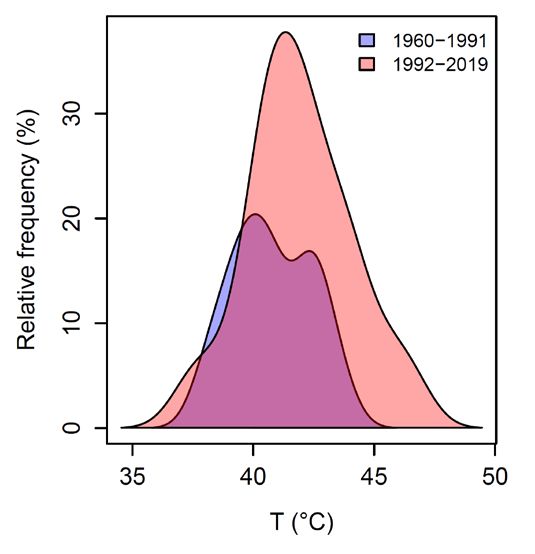
most notably during the June to August and September to November periods. The maximum
number of consecutive dry days has increased across the whole year with March to May, June to
August and September to November periods increasing by 3, 4 and 5 days respectively (i.e. now 33,
28 and 22, days respectively).

 Figure 3. Mean annual dry spell length (left) and seasonal dry spell length for December to January
   (DJF), March to May (MAM), June to August (JJA) and September to November (SON). Dry spell
                                   lengths are expressed in days.
The current acceleration of global warming is expected to continue based on future greenhouse gas
(GHG) emissions trajectories. Previous studies have examined how the rates of record-breaking have
changed in the US (Anderson et al., 2011), the UK (Kendon, 2014), and Australia (Lewis & King,
2015). These studies have found increased rates of hot temperature records and decreased record
setting for cold temperatures in recent decades (King et al., 2015; King, 2017). Lewis and King (2015)
found that from 2000 to 2014 there were 12 times as many hot record‐breaking temperatures as
cold records in Australia and attributed this to anthropogenic climate change. Recent BoM analyses
has shown that from 1960-2018 the ratio of hot records to cold records set across Australia was 6:1
whereas from 1910-2018 the ratio was 9:1 (Blair Trewin pers Comm. 2020). In 2019 the ratio of hot
to cold records broken at the state area average level was 34:0 (Blair Trewin pers Comm. 2020).
Across the world, there were about five times more record‐breaking monthly temperatures than
would be expected without a long‐term warming trend (Coumou et al., 2013) over the early 21st
century.
During the 2018/19 Australian summer more than 206 individual location extreme temperature
records were broken in just 90 days (Climate Council, 2019). Climate change has been found to not
only increase the likelihood of breaking high temperature records (e.g. Lewis and Karoly, 2013), but
record‐breaking hot summers and years over previous decades are also attributable to
anthropogenic climate change (King et al., 2016). More recent research by Mann et al. (2018) has
shown that the synoptic features (large scale weather systems) responsible for prolonged heatwaves
are on average 50% more prevalent under a business-as-usual GHG emissions trajectory.
In addition to record breaking temperatures, changes in rainfall patterns, sea levels, rates of glacial
retreat and biological responses have also been detected consistent with expected climate change
projections. This mounting evidence has led to scientific consensus that:
• Emissions of greenhouse gases and aerosols due to human activities continue to alter the
atmosphere in ways that affect the climate system and these changes and resultant trends will
continue for the foreseeable future; and
• There is at least 95% confidence that humans are the main cause of global warming since 1950,
and most likely responsible for 100% of that temperature rise (IPCC, 2018) with a less than 1 in
100 000 chance that human activities are not responsible for the observed increase in global
temperatures (Kokic et al., 2014).
These changes are already likely to have negatively impacted on Australian agriculture, acting as a
major drag on yield growth with similar impacts on yield growth globally for the major crops (Porter
et al., 2014).
A major issue in understanding historical and future climate change is how much are the various
human-induced climate forcings (greenhouse gas emissions, stratospheric ozone depletion, Asian
aerosols, and landcover change) interact with components of natural variability (Watkins, 2005,
McKeon, 2006). Thus, it is important for successful climate adaptation that agricultural decision-
makers keep informed of the evolving climate science and updated climate change scenarios. As
scientific understanding improves and there is more confidence in emission scenarios, current and
future uncertainties can be rapidly assessed in terms of decision making.
What is expected to happen in the future?
In response to the continued growth in atmospheric GHG concentrations, scientists estimate that
global average temperatures could increase by up to 4.8oC by the end of the present century,
dependent on global population growth, technological advancement and economic growth (IPCC,
2013). To put this in context, the difference between our historical temperatures and those of the
last ice age was only about 5oC. So even though 4.8oC does not sound like much, it signals a huge
change in how the climate-ocean-land systems of the earth function and hence how agriculture will
operate.
In Australia, national projections suggest additional warming of up to 1.3oC of additional warming
could be experienced by 2030 and up to 5.1oC of warming could be experienced by 2090, with the
greatest warming being in inland Australia and the lesser warming along the southern coast and
Tasmania (CSIRO, 2015). Global studies indicate that a rule of thumb is that global potential crop
production drops by 6% per degree warming (Porter et al., 2014).
Whilst changes in rainfall are more uncertain, projections suggest drier conditions in the southern
half of Australia, particularly in the south-west and during the cool season months of May to
October, with as much as 20% less by 2030 and up to 50% less rainfall by 2090 in the south-western
parts of Australia by 2090, respectively (CSIRO, 2015).
At a regional scale projected change in climate for the Eastern Downs region (Goondiwindi
represents a southern town in this study region) are summarised in Table 1. In addition to warmer
temperatures and declines in mean annual rainfall, evaporation rates are likely to increase. The
annual potential evaporation (1986-2005) for the region is 1539 mm. By 2050 the median value of
annual potential evaporation is projected to increase by 6 % under a high emissions scenario.Table 1. Projected changes in temperature and rainfall for Eastern Downs region (Goondiwindi is on
found on the Southern part of this region). Present average temperatures and rainfall are calculated
for the period 1986 to 2005. The data contained in this table represents information compiled from
the Queensland Department of Environment and Science, SILO database.
Historical mean
Variable Season 2030 2050 2070
(1986 to 2005)
Annual 20.0oC 1.1 1.9 2.9
(0.5 to 1.6) (1.1 to 2.6) (2.0 to 3.8)
Summer 26.4oC 1.1 2.0 3.0
Mean (0.4 to 1.8) (1.0 to 2.9) (2.0 to 4.3)
temperature Autumn 20.4oC 1.0 1.8 2.9
change (0.1 to 1.6) (0.9 to 2.6) (1.8 to 3.6)
(oC change) Winter 12.7oC 1.0 1.9 3.0
(0.1 to 1.7) (1.2 to 2.5) (2.1 to 3.8)
Spring 20.6oC 1.1 1.9 3.0
(0.5 to 1.8) (1.0 to 3.2) (2.0 to 4.2)
Annual 636mm -5 -6 -9
(-20 to +7) (-23 to +14) (-23 to +13)
Summer 248mm 0 0 -2
Mean (-15 to +21) (-23 to +27) (-21 to +29)
rainfall Autumn 144mm -3 -4 -8
change (-28 to +27) (-33 to +36) (-42 to +41)
(% change) Winter 106mm -1 -14 0
(-25 to +13) (-39 to +13) (-49 to +14)
Spring 139mm -6 -8 0
(-22 to +20) (-34 to +12) (-42 to +21)
Adapting to projected climate changes
Climate change is likely to pose a significant challenge for Australian agriculture. Of greatest concern
are likely to be changes in water availability, and the change in frequency of climatic extremes (e.g.
heatwaves, drought and floods).
Many of the actions required for adapting to climate change are extensions of those currently used
for managing climate variability. For this reason, efforts to improve current levels of adaptation to
climate variability will have positive benefits in addressing likely climate change impacts.
Examples of likely farm level adaptation options include:
• Enhancing the current implementation of zero tillage and other minimum disturbance
techniques, retaining crop residues, extending fallows, changing row spacing, changing planting
density, staggering planting times, traffic and erosion controls
• Alter planting decisions to be more opportunistic – more effectively taking into account
environmental condition (e.g. soil moisture), climate (e.g. seasonal climate forecasting) and
market conditions
• Expand routine record keeping of weather, production, degradation, pest and diseases, weed
invasion
• Incorporating seasonal climate forecasts and climate change into farm enterprise plans
• Improve efficiency of water distribution systems (to reduce leakage and evaporation), irrigation
practices and moisture monitoring• Learning from farmers in currently more marginal areas
• Selection of varieties with appropriate thermal time and vernalisation requirements, heat shock
resistance, drought tolerance, high protein levels, resistance to new pests and diseases and
perhaps that set flowers in hot/windy conditions
• Enhance current consideration of decision support tools/training to access/interpret climate
data and analyse alternative management options (e.g. APSIM, EverCrop).
There are also longer-term decisions at a family farm level - to sell up, to buy more land, where to
invest. These are especially pertinent for farmers in low rainfall regions and it will increasingly be
more difficult to find no-regret decisions if climate change progresses as anticipated (Hayman,
2005). These decisions, along with industry infrastructure (silos etc.) and industry support (drought
policy) are hard decisions requiring full understanding of the likely future risks (Hayman, 2005).
The value of adaptation
In Australia a number of studies have examined the economic benefits of adaptation in the wheat
industry at both national and regional scales under a range of likely future climate conditions.
Hochman et al. (2017) highlighted that the adoption of new technology and management systems
held actual yields fairly steady: without these advances, water-limited yield would have dropped by
27%. It was estimated that rainfall declines should have accounted for about three-quarters of the
fall in simulated yield potential, whilst observed warming should have accounted for about a quarter
of fall in yield potential.
Continued adaptation to climate change has been estimated to add an additional AU$500M per
annum (Howden and Crimp, 2011) via the introduction of improved water-use efficiency options and
may mitigate potential yield losses by up to 18% through broader scale adaptation (Ghahramani et
al. 2015).
The results suggest a number of adaptation options exist to manage increased future downside risk
however the effectiveness of adaptation is driven by the extent of future change. Under conditions
of large climate change, tactical adaptation will only have limited effectiveness and more extensive
adaptation options, often defined as transformation adaptation, may be required.
Advisers have a key role to play in changing the nature of the climate change dialogue. In the space
of about five years many grain growers and their advisers have moved from asking "What is climate
change?" or "Is it real?" to "How do we manage for climate change?" and "What will the impact be
on the grains industry?"
Advisers have a vital role to play in this dialogue, not only in assisting grain growers in reducing
greenhouse gas emissions from on-farm activities, but also in developing information systems that
growers can tap into in order to build farming systems that can cope with current climate variability
and can adjust to ongoing climate changes.
References
Anderson, A., Kostinski, A., Anderson, A., and Kostinski, A. (2011). Evolution and distribution of
record‐breaking high and low monthly mean temperatures. Journal of Applied Meteorology and
Climatology, 50(9), 1859–1871. https://doi.org/10.1175/JAMC‐D‐10‐05025.1
BoM (2020) Retrieved from http://media.bom.gov.au/releases/739/annual-climate-statement-2019-
periods-of-extreme-heat-in-2019-bookend-australias-warmest-and-driest-year-on-record/
BoM and CSIRO (2019) Retrieved from http://www.bom.gov.au/state-of-the-climate/State-of-the-
Climate-2018.pdf
Climate Council (2019). The Angriest Summer. 978-1-925573-91-6Coumou, D., Robinson, A., and Rahmstorf, S. (2013). Global increase in record‐breaking monthly‐ mean temperatures. Climatic Change, 118(3–4), 771–782. https://doi.org/10.1007/s10584‐012‐ 0668‐1 CSIRO and Bureau of Meteorology (2015). Climate Change in Australia Information for Australia’s Natural Resource Management Regions: Technical Report, CSIRO and Bureau of Meteorology, Australia. Ghahramani, A., Kokic, P.N., Moore, A.D., Zheng, B., Chapman, S.C., Hoden, S.M., and Crimp, S.J. (2015). The value of adapting to climate change in Australian wheat farm systems: farm to cross- regional scale. Agriculture, Ecosystems & Environment, 211, 112-125. Hayman, P. (2005). Linking Climate change to Farming Systems. Research Update for Advisers – Southern Region (http://www.grdc.com.au/growers/res_upd/south/_content.htm) Hochman, Z, Gobbett, D.L. and Horan, H (2017). 'Climate trends account for stalled wheat yields in Australia since 1990', Global Change Biology, vol. 23, pp. 2071–81. https// doi: 10.1111/gcb.13604. Howden, S.M. and Crimp S.J., (2011). Regional Impacts: Australia. Yadav, S.S., Redden, R.J., Hatfield, J.L., Lotze-Campen, H. and Hall, A.E. (ed.) Crop adaptation to climate change. Wiley-Blackwell, Oxford. IPCC, (2018). Summary for Policymakers. In: Global warming of 1.5°C. An IPCC Special Report on the impacts of global warming of 1.5°C above pre-industrial levels and related global greenhouse gas emission pathways, in the context of strengthening the global response to the threat of climate change, sustainable development, and efforts to eradicate poverty [V. Masson-Delmotte, P. Zhai, H. O. Pörtner, D. Roberts, J. Skea, P.R. Shukla, A. Pirani, W. Moufouma-Okia, C. Péan, R. Pidcock, S. Connors, J. B. R. Matthews, Y. Chen, X. Zhou, M. I. Gomis, E. Lonnoy, T. Maycock, M. Tignor, T. Waterfield (eds.)]. World Meteorological Organization, Geneva, Switzerland, 32 pp. IPCC, (2013). Climate Change 2013: The Physical Science Basis. Contribution of Working Group I to the Fifth Assessment Report of the Intergovernmental Panel on Climate Change [Stocker, T.F., D. Qin, G.-K. Plattner, M. Tignor, S.K. Allen, J. Boschung, A. Nauels, Y. Xia, V. Bex and P.M. Midgley (eds.)]. Cambridge University Press, Cambridge, United Kingdom and New York, NY, USA, 1535 pp.https://doi.org/10.1017/CBO9781107415324. Kendon, M. (2014). Has there been a recent increase in UK weather records? Weather, 69(12), 327– 332. https://doi.org/10.1002/wea.2439. King, A.D. (2017). Attributing Changing Rates of Temperature Record Breaking to Anthropogenic Influences. Earth’s Future. https://doi.org/10.1002/2017EF000611. King, A.D., Black, M.T., Min, S.K., Fischer, E.M., Mitchell, D.M., Harrington, L.J., and Perkins‐ Kirkpatrick, S.E. (2016). Emergence of heat extremes attributable to anthropogenic influences. Geophysical Research Letters, 43(7), 3438–3443. https://doi.org/10.1002/2015GL067448. King, A.D., Donat, M.G., Fischer, E.M., Hawkins, E., Alexander, L.V., Karoly, D.J., Perkins, S.E. (2015). The timing of anthropogenic emergence in simulated climate extremes. Environmental Research Letters, 10(9), 94015. https://doi.org/10.1088/1748‐9326/10/9/094015. Kokic, P. Crimp S.J., Howden, S.M. (2014). A probabilistic analysis of human influence on recent record global mean temperature changes. Climate Risk Management, 3, 1-12. https://doi.org/10.1016/j.crm.2014.03.002 Lewis, S.C., and Karoly, D.J. (2013). Anthropogenic contributions to Australia's record summer temperatures of 2013. Geophysical Research Letters, 40(14), 3705–3709. https://doi.org/10.1002/grl.50673.
Lewis, S.C., and King, A.D. (2015). Dramatically increased rate of observed hot record breaking in
recent Australian temperatures. Geophysical Research Letters, 42(18), 7776–7784.
https://doi.org/10.1002/2015GL065793.
Mann, M.E., Rhamstorf, S., Kornhuber, K., Steinman, B. A., Miller, S. K., Petri, & Coumou, D. (2018)
Projected changes in persistent extreme summer weather events: The role of quasi-resonant
amplification. Science Advances, 4(10), eaat3272. https://doi.org/10.1126/sciadv.aat3272.
McKeon, G.M. (2006). ‘Living in a variable climate’, article prepared for the 2006 Australia State of
the Environment Committee, Department of Environment and Heritage, Canberra.
NOAA (2020) Retrieved from https://www.esrl.noaa.gov/gmd/ccgg/trends/
Porter, J.R., Xie,L., Challinor, A.J., Cochrane, K., Howden, S.M., Iqbal, M.M., Lobell, D.B. and Travasso,
M.I. (2014). Food security and food production systems. In: Climate Change 2014: Impacts,
Adaptation, and Vulnerability. Part A: Global and Sectoral Aspects. Contribution of Working Group II
to the Fifth Assessment Report of the Intergovernmental Panel on Climate Change [Field, C.B., V.R.
Barros, D.J. Dokken, K.J. Mach, M.D. Mastrandrea, T.E. Bilir, M. Chatterjee, K.L. Ebi, Y.O. Estrada, R.C.
Genova, B. Girma, E.S. Kissel, A.N. Levy, S. MacCracken, P.R. Mastrandrea, and L.L.White (eds.)].
Cambridge University Press, Cambridge, United Kingdom and New York, NY, USA, pp. 485-533
Watkins, A.B. (2005). ‘The Australian Drought of 2005’, Bulletin of the World Meteorological
Organisation 54:156-162.

Acknowledgements
The authors would also like to acknowledge that this research was made possible via financial support
from the New South Wales Department of Environment and Heritage. We would like to acknowledge
the Australian Bureau of Meteorology (BoM) for provision of its Australian Climate Observations
Reference Network – Surface Air Temperature (ACORN-SAT) data and the Science Division of the
Queensland Department of Environment and Science (DES) for provision of it SILO climate projections
for analysis.

Contact details
Dr. Steve Crimp
Climate Change Institute
Australian National University
Fenner School of Environment and Society
Building 141, Linnaeus Way, Action, ACT 2601
Ph: 02 6125 7265
Email: Steven.Crimp@anu.edu.au
You can also read