TOWARD A LOW CARBON AND CLIMATE RESILIENT POWER SYSTEM: A CASE OF THE INDONESIAN POWER SECTOR
←
→
Page content transcription
If your browser does not render page correctly, please read the page content below
TOWARD A LOW CARBON AND CLIMATE RESILIENT POWER SYSTEM: A CASE OF
THE INDONESIAN POWER SECTOR

Kamia Handayani, Department of Governance and Technology for Sustainability, University of Twente, the Netherlands and PT PLN
                                                                            (Persero), Indonesia, Email: k.handayani@utwente.nl
      Tatiana Filatova, Department of Governance and Technology for Sustainability, University of Twente, the Netherland, Phone:
                                                                                    +31534899111, Email: t.filatova@utwente.nl
       Yoram Krozer, Department of Governance and Technology for Sustainability, University of Twente, the Netherlands, Phone:
                                                                                     +31534899111, Email: y.krozer@utwente.nl
                 Pinto Anugrah, Department of Electrical Engineering, Universitas Negeri Padang, Indonesia, Email: Pinto Anugrah
                                                                                                      pinto.anugrah@ft.unp.ac.id

       1. Overview
       One in five people on the planet today still lacks access to electricity (United Nations Development Programme, 2018).
       Hence, ensuring universal access to energy services is a vital goal for the power sector worldwide. However, this goal
       has to be aligned with another pivotal global ambition: curbing climate change. Moreover, while the power sector
       becomes the target for reducing global carbon emissions, the sector itself is vulnerable to the adverse impacts of the
       changing climate. Climate change affects the power sector in two ways: through acute, disruptive, severe weather
       events and gradual long-term changes in climate parameters (Sieber, 2013).
       This paper aims to analyze the interplay between three goals –electrification, climate change mitigation, and climate
       change impact and adaptation– taking the Indonesian power sector as a case study. The country strives to achieve
       near-universal electricity access by 2020 (Government of The Republic of Indonesia, 2014). While today the country’s
       electricity supply relies heavily on fossil fuels, it pledges to reduce its carbon emissions by 29% in 2030 (Government
       of The Republic of Indonesia, 2016). Meanwhile, the electricity supply in the country is often interrupted by severe
       weather events (PLN Yogyakarta, 2015), which promise to be even more frequent and severe in the climate-changed
       world. We address this problem by providing a framework for an integrated analysis of electrification, climate change
       mitigation, and climate change adaptation for developing a low-carbon and climate-resilient power system.

       2. Methodology and data
       To address the nexus between electrification, climate mitigation, and climate adaptation ambitions, we employ a mix
       of methods. This approach allows us to integrate both climate change mitigation and adaptation into the analysis of
       long-term power sector development in Indonesia (Fig. 1, left-hand flow). We use these methods within the framework
       of electrification as foreseen by the Indonesian policy. For the mitigation part, we develop a long-term scenario for
       the power sector development taking into account the country’s low-carbon development policy. Subsequently, we
       use the Long-range Energy Alternative Planning System (LEAP), an energy system model developed by the
       Stockholm Environment Institute (SEI), to analyze the electrification & climate mitigation scenarios.
       Furthermore, since climate impacts and adaptation to them are local, we need to find data to setup parameters for
       integrating climate change impact and adaptation into LEAP. We take a 3 step approach here (Fig. 1, right-hand flow).
       Firstly, we carry out an extensive fieldwork by visiting ten major power plants in Indonesia between February-March
       2018. We collected data on the impacts (in energy not supplied, monetary costs) of extreme weather (e.g., heavy
       precipitations and heavy winds) as well as gradual pressures such as changes in precipitation patterns. We also hold
       interviews to explore the responses of electric power utility to the adverse impacts. Secondly, we do an extensive
       literature review on downscaling climate scenarios to identify the likely trends in temperature and precipitation for
       the Indonesian archipelago. Thirdly, we identify the variables and functions in the LEAP model architecture to
       parameterize the possible climate impacts and adaptation response of the Indonesian electricity sector. We focus on
       three major power plant types namely coal-fired power plant (CFPP), natural gas power plant (NGPP), and
       hydroelectric power plant (HEPP). For the HEPP, we use the Water Evaluation and Planning System (WEAP), which
       was also developed by SEI, to analyze the impacts of future climate change on water availability for hydroelectric
       power plants. In summary, we rely on findings from our fieldwork and on the current literature to parameterize the
       impacts of future climate change on thermal power plants (TPPs).
Electrification LEAP Analysis of the least-
cost electrification pathway
(reference scenario)
Climate change Climate change
mitigation pathway adaptation scenario
LEAP Analysis of
the Indonesian Projected climate change
Identification of
renewable energy historical impacts
targets of extreme weather
and changes in Impacts on HEPPs Impacts on TPPs
climate variables
LEAP results: the
WEAP analysis Parameterization
reference energy
for LEAP input
mix, CO2 emissions Estimation of
and costs financial losses and
adaptation
responses of the WEAP results: Technical
electricity utilities availability of characteristics of
LEAP’s climate HEPPs under future TPPs under future
change mitigation- climate change climate change
adaptation pathway
LEAP results: a
low-carbon and
climate-resilient
power system
Fig. 1 Conceptual framework for integrating climate change mitigation and adaptation into the LEAP model
2.1. LEAP setup for analyzing the electrification and low carbon scenarios
In this study, we focus on the Java-Bali power system, which comprises 75% of Indonesian electricity consumption
(PLN, 2017) and serves 59% of the Indonesian populations (BPS, 2010). Moreover, the Java-Bali mirrors Indonesia’s
power sector in term of the historical energy mix, supply, and demand (Handayani, Krozer and Filatova, 2019). Firstly,
we develop a reference scenario, i.e., the electricity expansion scenario without considering climate change. Hence,
the objective of this scenario is solely to satisfy the future demand for electricity in Java-Bali islands, employing
LEAP’s least-cost optimization. LEAP optimizes power capacity expansion based on total costs over the time horizon
of the study. The methodology of the Java-Bali LEAP model is explained in details in (Handayani, Krozer and
Filatova, 2019). This study updates the previous one by including the most recent historical data of energy demand
and supply. Accordingly, the LEAP base year is updated from 2015 to 2017. Furthermore, we update the electricity
demand projection in accordance with the latest electricity development plan (PLN, 2018). Likewise, the capital cost
of electric power technologies is now assumed to decrease every five years following the percentage of technology
cost reduction in the World Energy Outlook (OECD/IEA, 2017).
Furthermore, we add alternative scenarios, which include low carbon and climate-resilient pathways. The low carbon
pathway refers to the country’s policy of increasing the share of renewable energy in the national energy mix up to
23% by 2025 and 31% by 2050. Hence, we set up the LEAP horizon until 2050 putting the renewable energy targets
as constraints of the simulations. This scenario serves as the climate mitigation scenario, where we assume the future
development of the Java-Bali power system shifts to a low carbon path, yet neglecting the sector’s adaptation to
climate change for now.2.2. Integrating climate change impacts into LEAP
2.2.1. Identification of weather and climate effects on power generation
We identify the actual effects of severe weather and changes in climate variables on the Indonesian electricity sector
based on the data that were collected through an extensive fieldwork and reviews of utilities’ internal reports as well
as published energy sector information. The fieldwork included interviews, site visits, and focus group discussions
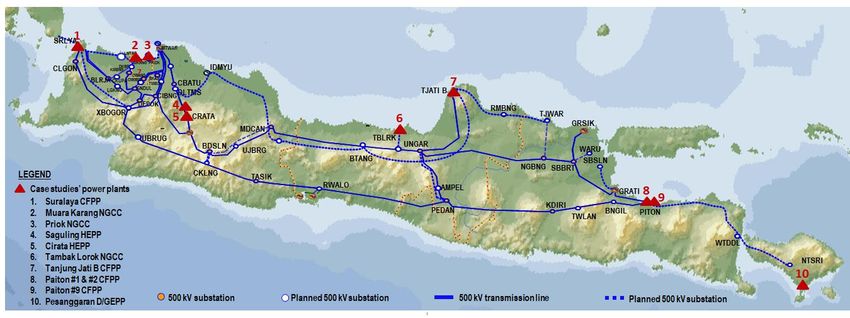
(FGD) with ten power plants, one load control center, two transmission offices, and two distribution offices, involving
51 participants. The selected power plants consist of coal-fired power plants, natural gas power plants and
hydroelectric power plants – the three major power plant’s types in Indonesia – spread throughout Java and Bali
islands (Table 1, and Fig. 2). In total, the ten power plants represent 35%1 of total power generation capacity in the
Java-Bali electricity grid.
Prior to conducting the fieldwork, we developed a questionnaire for guiding the interviews and FGDs, which included
questions about the occurrence of power plants’ disruptions due to weather and climate and how the utilities respond
and adapt to those disruptions.
Table 1 Indonesian power plants where primary data collection has taken place.
Power plant Capacity (MW) Location Primary energy source
Saguling 797 West Java Hydro
Cirata 1,008 West Java Hydro
Tanjung Priok 1,900 Jakarta Natural gas
Muara Karang 909 Jakarta Natural gas
Tambak Lorok 1,350 Central Java Natural gas & oil
Pesanggaran 325 Bali Natural gas & oil
Suralaya 3,400 Banten Coal
Tanjung Jati B 2,640 Central Java Coal
Paiton #1& #2 800 East Java Coal
Paiton #9 660 East Java Coal
Fig. 2 Locations of power plants where data collection has taken place, modified from PLN (2018).
2.2.2. Projections of future climate change
For the climate change scenarios, we refer to projections from the Southeast Asia Climate Analysis and Modelling
Framework (SEACAM). SEACAM downscaled data from six global climate change models to generate high-
resolution (25 km) climate change projection for Southeast Asia up to the year 2100 (Rahmat et al., 2014). These
projections are based on the A1B scenario of the IPCC special report on emission scenarios (SRES) with two time
slices: 2031-2060 and 2071-2100 compared to the baseline period of 1970-2000. To fill the data gap of temperature
changes from 2018 through to 2030, we refer to World Bank (2011), which projects an increase in temperature ranging
from 0.2°C to 0.3°C per decade. Meanwhile, the precipitation changes during the same period were interpolated from
the available climate projection data.
1
Calculated based on KESDM (2017) and PLN (2017)2.2.3. Accounting for climate change impacts in LEAP
As a bottom-up energy model, LEAP allows setting detailed characteristics of energy technologies in its input data.
In this paper, we identify the pathways to translate climate change impacts and potential adaptation actions into the
changes in technical characteristics of electric power technologies. We rely heavily on our fieldwork as well as on the
literature reporting downscaled climate change scenarios. We focus mainly on CFPPs, NGPPs, and HEPPs as they
constitute most of the Indonesian power generation capacity, i.e., 50%, 28%, and 9%, respectively.
3. Results
3.1. Electrification and climate change mitigation: LEAP results
3.1.1. Least-cost Electrification
The demand for electricity in Java-Bali islands is projected to increase over fivefold from around 175 TWh in 2017
to 904 TWh in 2050. Consequently, the electricity generation from power plants – which also accounts for own
consumption and transmission losses – increases at the same pace i.e., 982 TWh in 2050, compared to 182 TWh in
2017. Concerning the primary energy use, the electricity mixes in 2025 and 2050 mirror that in the base year (2017)
(see Fig 3). In 2050, electricity generation from coal keeps dominant in the electricity mix, followed by natural gas,
hydro and geothermal. Hence, there is no significant change in the deployment of energy resources and technologies.
Fig. 3 The Java-Bali electricity mix in 2017, 2025, and 2050
3.1.2. A low-carbon power sector development
While fossil fuels served most of the demand for electricity in the base year, under the low-carbon pathway scenario,
they gradually reduce their share in the Java-Bali electricity mix. Renewables compose 23% and 31% of the electricity
mix by 2025 and 2050, respectively (see Fig. 4). Accordingly, there is a significant change in the deployment of energy
resources and technologies where biomass, solar, and wind now appear in the electricity mix.
Fig. 4 The Java-Bali electricity mix in 2017, 2025, and 20503.1.3. CO2 reduction and cost implication
The increased deployment of renewable energy in the low-carbon scenario results in a reduction in cumulative CO2
emissions of the Java-Bali power system (Fig. 5). By 2025 and 2050, the cumulative CO2 emissions under the low-
carbon scenario are 3% and 23% lower, respectively compared to the reference scenario (least-cost electrification
scenario). The low- carbon scenario involves an estimated 76.6 billion USD of total costs by 2050 (Fig. 6), which is
8% higher compared to that in the reference scenario.
Fig. 5 Cumulative CO2 emissions over the study period
Fig. 6 Total production costs over the study period
3.2. Historical evidence and future impacts of climate change
3.2.1. Identified impacts and adaptation responses
Based on the fieldwork and reviews of internal power plants documents, we identified a number of effects of severe
weather and changes in climate variables on power generation as described in Table 2. Severe weather and changes
in climate variables affect the power generation. So far, in Indonesia, severe weather mainly affects fuel coal quality
and stock of CFPPs and cooling water supply in CFPPs and NGPPs. Heavy precipitation often reduces coal quality
causing reductions in the power plant’s capacity factor. Extreme events also cause direct monetary losses for electric
power utilities, such as the case of jellyfish inflow in 2016, which forced Paiton#9 to shut down for 20 days, causing
an estimated financial loss of 21.3 million USD for the utility. Meanwhile, gradual climate change such as changes in
precipitation patterns affect HEPPs’ operation. Furthermore, our fieldwork confirms that ambient air temperature
influences the power output of NGPPs.
To some extent, utilities have implemented adaptation actions in response to severe weather. These actions encompass
behavioral, managerial and technological responses. The technological responses include investment in the flood
control system in power plants and the application of weather modification technology to create artificial rain toincrease water inflow to HEPPs’ reservoirs. Behavioral and managerial responses include alteration of coal shipment
contract, increase in routine checking of distribution networks in anticipation of the approaching rainy season, and
modification of HEPP’s operation pattern plan.
Table 2 Impacts of severe weather and changes in climate variables on the Indonesian power sector
Severe event Identified impacts
Heavy - Heavy precipitation can turn a significant amount of dry coal into wet coal, making the
precipitation burning efficiency lower and thus reducing the power output. Moreover, wet coal causes
plugging in the coal feeder resulting in further reduction in power output;
- An increase in river flow due to heavy precipitation brings more waste into the sea,
which impedes the power plant’s water uptake;
- Heavy precipitation that lasts for days leads to high water inflow to the hydropower
reservoir. This situation can cause water spills from the reservoir, increasing the risk of
flooding downstream;
- Heavy precipitation can cause floods;
Heavy wind and Interruptions in coal shipping jeopardize the fuel coal stock of coal-fired power plants
high sea waves (CFPPs), which leads to a reduction of power generation capacity or even a shutdown of
power plants;
Jellyfish inflow Jellyfish can clog in the circulating water pump of coastal thermal power plants causing a
reduction in the power generation capacity or even a plant shutdown;
Heatwave Warm ambient air temperature affects the efficiency of gas turbine and gas/diesel engine
power plants;
Drought Very low water inflow causes a significant decrease in power generation capacity;
Sea level rise The increase in sea level rise causes coastal flooding affecting coastal power plants;
Seawater An increase in seawater temperature affects the efficiency of the cooling water system.
temperature
3.2.2. Future climate change scenarios
Based on our literature review of downscaled climate change projections for Indonesia, we identify scenarios of
temperature and precipitation changes relevant to the Indonesian electricity sector (see Table 3). Concerning the
temperature changes, the SEACAM results are uniform between all models with the average annual temperature rise
ranging from 2°C to 3°C in 2031-2060. Contrarily, the precipitation change projections vary between models. In this
study, we take into account extreme precipitation changes in each season, which include both reduction and
intensification in precipitations compared to the baseline period. Accordingly, we develop scenarios for those extreme
situations taking into account combination in changes of the two climate variables (see Table 4).
Table 3 Projection of future changes in temperature and precipitation for Indonesia as compared to 1971-2000
period (Rahmat et al., 2014; World Bank, 2011)
Future time slice Temperature changes (°C) Precipitation changes (%)
Minimum Maximum Minimum Maximum
2001-2030 +0.2 per decade +0.3 per decade -10 +14
2031-2060 +2 +3 -20 +29
Table 4 Climate change scenarios
Scenarios Description
Tlow Pdecrease Temperature increases by 2 degrees, seasonal precipitations decrease up to 20%
Tlow Pincrease Temperature increases by 2 degrees, seasonal precipitations increase up to 29%
Thigh Pdecrease Temperature increases by 3 degrees, seasonal precipitation decreases up to 20%
Thigh Pincrease Temperature increases by 3 degrees, seasonal precipitations increase up to 29%
3.2.3. Modeling climate change impacts and adaptations in LEAP
Referring to the identified effects of climate change as discussed in Section 3.2.1, we identify the most detrimental
effects and transform them into changes in technical characteristics of power plants. The changed technical
characteristics include capacity factor and or efficiency of the respective power plants (de Lucena, Schaeffer and
Szklo, 2010; Asian Development Bank, 2012; Anugrah et al., 2015). These changes are expected to influence theenergy resource/technology mix and installed capacity, and reflect the costs of climate change and benefits of
adaptation. Table 5 lists climate change impacts on three types of power plants to be integrated into the LEAP model.
Table 5 Accounting for climate change adaptation in the LEAP Model
Climate change impacts on power generation Source of impact Technical characteristics to
be adjusted in LEAP
Reduction in power output of the natural gas turbine Increase in surface Capacity factor
air temperature
Changes in water availability for hydroelectric power plants Changes in Capacity factor
precipitation and
temperature
Reduction in the efficiency of the cooling water system in Increase in seawater Efficiency
thermal power plants due to increased temperature of inlet temperature
cooling water
Reduction in power output of coal-fired power plants due to Increased Capacity factor
the wet coal precipitations
3.2.4. Ongoing work
This is a work in progress. Our next step is to quantify the effects of climate change on power plants, given the
downscaled climate change scenarios, into the changes in technical characteristics for the LEAP input data. We use
different approaches to parameterizing the effects of future climate change on thermal power plants (i.e., CFPPs and
NGPPs) and HEPPs. For TPPs, we will estimate the impacts of climate change based on historical evidence and
extrapolate the data following the projected climate change. Meanwhile, we will use WEAP for quantifying the impact
of climate change on hydropower production. WEAP is a software tool that can be used among others to simulate
water demand, supply, flow, storage, discharge, and pollution. One of the methodological considerations of WEAP is
the use of scenario analyses to answer what-if questions related to water demand and supply. Furthermore, WEAP has
a built-in capability with LEAP where the hydropower availability modeled by WEAP becomes an input for LEAP.
Hence, the use of both software packages enables a dynamic analysis of climate change implications on hydropower
production (Spalding-fecher, 2018). The WEAP methodology is described in details in Sieber (2019) and Yates et al.
(2005).
4. Conclusions
The power sector contributes to climate change and is simultaneously, affected by its adverse impacts. Therefore, it is
crucial that the development of the sector not only shifts to the low-carbon path but also improves its resilience to
climate change-related disruptions. This paper proposes a framework for an integrated analysis of electrification,
climate change mitigation and climate change adaptation in the context of the Java-Bali power system in Indonesia.
We have carried out analyses for the least-cost electrification and low-carbon paths. Our analyses reveal that the low-
carbon path has benefits in term of reducing CO2 emissions, but entails higher costs.
Furthermore, we have carried out an intensive fieldwork and identified the historical effects of severe weather and
changes in climate variables on power plants. We have also developed scenarios of future climate change impacts that
are relevant to the electricity sector. Our ongoing work attempts to parameterize the identified impacts of climate
change into the changes in technical characteristics of TPPs and HEPPs. Subsequently, our future work will integrate
those changes into analyses of long-term power system expansion to satisfy the triple objectives of electrification,
climate change mitigation and climate change adaptation.References Anugrah, P. et al. (2015) ‘Evaluating Micro Hydro Power Generation System under Climate Change Scenario in Bayang Catchment, Kabupaten Pesisir Selatan, West Sumatra’, Energy Procedia, 65, pp. 257–263. doi: https://doi.org/10.1016/j.egypro.2015.01.043. Asian Development Bank (2012) Adaptation to Climate Change - The Case of a Combined Cycle Power Plant. Available at: http://icem.com.au/wp-content/uploads/2013/07/OMon_summaary-paper.pdf,. BPS (2010) Sensus Penduduk 2010. Biro Pusat Statistik Indonesia. Available at: http://sp2010.bps.go.id/files/ebook/pop indo_kab_kota_kec_rev20101224/index.html. Government of The Republic of Indonesia (2014) ‘Government Regulation of Republic of Indonesia No. 79 Year 2014 regarding National Energy Policy’. Government of The Republic of Indonesia (2016) ‘First Nationally Determined Contribution Republic of Indonesia’. Available at: http://www4.unfccc.int/ndcregistry/PublishedDocuments/Indonesia First/First NDC Indonesia_submitted to UNFCCC Set_November 2016.pdf. Handayani, K., Krozer, Y. and Filatova, T. (2019) ‘From fossil fuels to renewables: An analysis of long-term scenarios considering technological learning’, Energy Policy. doi: 10.1016/j.enpol.2018.11.045. KESDM (2017) Statistik Ketenagalistikan 2016. Available at: https://www.esdm.go.id/assets/media/content/content- statistik-ketenagalistrikan-tahun-2016-1.pdf. de Lucena, A. F. P., Schaeffer, R. and Szklo, A. S. (2010) ‘Least-cost adaptation options for global climate change impacts on the Brazilian electric power system’, Global Environmental Change, 20(2), pp. 342–350. doi: http://dx.doi.org/10.1016/j.gloenvcha.2010.01.004. OECD/IEA (2017) World Energy Outlook - World Energy Model. Available at: http://www.worldenergyoutlook.org/weomodel/. PLN (2017) Statistik PLN 2016. Sekretaris Perusahaan PT PLN (Persero). PLN (2018) ‘Electricity Supply Bussiness Plan (RUPTL) 2018-2027’. Available at: http://www.pln.co.id/stakeholder/ruptl. PLN Yogyakarta (2015) ‘Kenapa Listrik Sering Padam Saat Hujan’. PLN Yogyakarta. Rahmat, R. et al. (2014) ‘A Regional Climate Modelling Experiment for Southeast Asia Using PRECIS Regional Climate Model and selected CMIP3 Global Climate Models’, (April), p. 128. Available at: http://www.precisrcm.com/rcct/#. Sieber, J. (2013) ‘Impacts of, and adaptation options to, extreme weather events and climate change concerning thermal power plants’, Climatic Change. Springer Netherlands, 121(1), pp. 55–66. doi: 10.1007/s10584-013-0915-0. Sieber, J. (2019) Water Evaluation And Planning (WEAP) System, Software version: 2019.0, Stockholm Environment Institute, Somerville, MA, USA. Available at: https://www.weap21.org (Accessed: 21 February 2019). Spalding-fecher, D. R. (2018) Impact of climate change and irrigation development on hydropower supply in the Zambezi River Basin , and implications for power sector development in the Southern African Power Pool. United Nations Development Programme (2018) Sustainable development goals. doi: 10.1177/0973408214538584. World Bank (2011) Vulnerability, risk reduction and adaptation to Climate change: Indonesia. Available at: http://sdwebx.worldbank.org/climateportalb/doc/GFDRRCountryProfiles/wb_gfdrr_climate_change_country_profil e_for_IDN.pdf. Yates, D. et al. (2005) ‘WEAP21—A Demand-, Priority-, and Preference-Driven Water Planning Model’, Water International. Taylor & Francis Group , 30(4), pp. 487–500. doi: 10.1080/02508060508691893.
You can also read