Hydropower Value Study - Past, Present, and Future - ABHISHEK SOMANI Energy and Environment Directorate, Electricity Infrastructure
←
→
Page content transcription
If your browser does not render page correctly, please read the page content below
Hydropower Value Study –
Past, Present, and Future
ABHISHEK SOMANI
Energy and Environment Directorate, Electricity Infrastructure

Northwest Hydroelectric Association – Annual Conference, 2019
Portland, OR

                                                                 1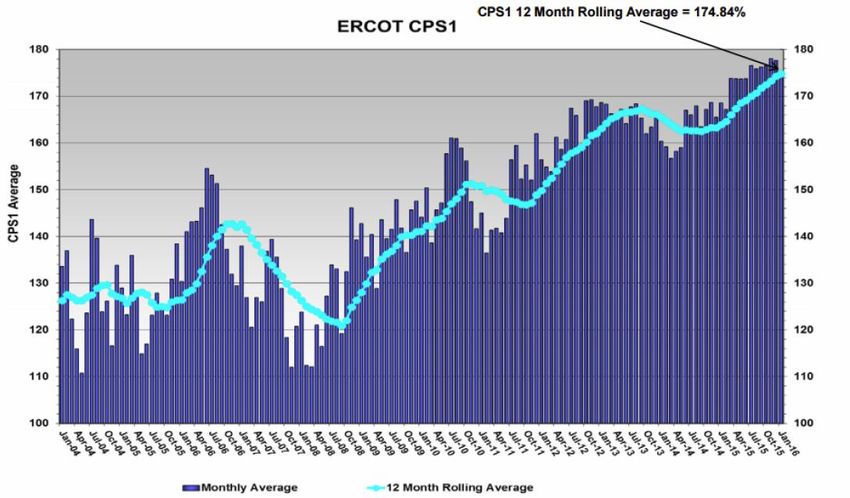
Presentation Outline

   Changes in Value Drivers for Hydropower
   Changes on the Horizon
      Policy
      Technology
      Regulatory
   Impacts on Power Markets and System Operations
   DOE’s Hydropower Research Vision
   Key Results from Hydropower Value Study

                                                    February 28, 2019   2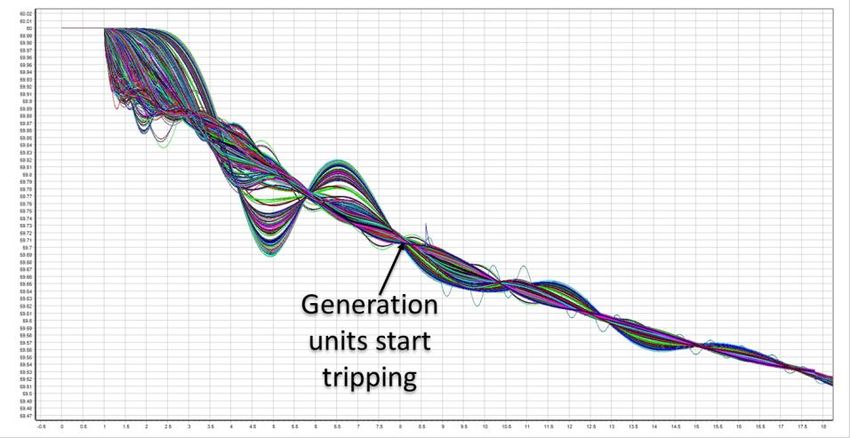
Changes on the Horizon:
More & More Variable Energy                                                          Source: CAISO 2013

Summary of renewable portfolio
standards (RPS) goals for several
high-target states
State     Goal         Year
HI        100%         2045
CA        100%         2045
VT         75%         2032
NY         50%         2030
ME         40%         2022
CO         30%         2020
CT         27%         2020
NV         25%         2025
                                    Hydropower generators, due to their fast response, can provide
IL         25%         2026         ramping resources to avoid load shedding and variable energy
OH         25%         2024         curtailment and may be called upon to correct imperfect net-load
                                    forecast errors during intra-day and real-time operations to
DE         25%         2026         counteract variability and uncertainty.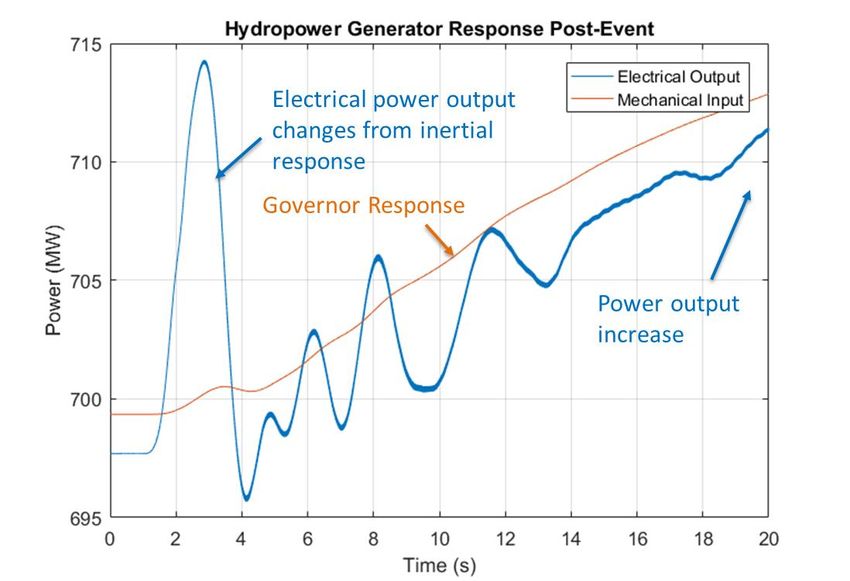
Changes on the Horizon:
          CAISO Net Load and Renewables Supply
                       Renewables Supply – October 2, 2018                             Load vs Net Load – October 2, 2018
  8000                                                                    35000
  7000
                                                                          33000
  6000
                                                                          31000
  5000
                                                                          29000
  4000
                                                                          27000
  3000
                                                                          25000
  2000
  1000                                                                    23000
                  0                                                       21000
                       0:00
                       0:55
                       1:50
                       2:45
                       3:40
                       4:35
                       5:30
                       6:25
                       7:20
                       8:15
                       9:10
                      10:05
                      11:00
                      11:55
                      12:50
                      13:45
                      14:40
                      15:35
                      16:30
                      17:25
                      18:20
                      19:15
                      20:10
                      21:05
                      22:00
                      22:55
                      23:50
-1000                                                                     19000

                                                                                   0:00
                                                                                   0:55
                                                                                   1:50
                                                                                   2:45
                                                                                   3:40
                                                                                   4:35
                                                                                   5:30
                                                                                   6:25
                                                                                   7:20
                                                                                   8:15
                                                                                   9:10
                                                                                  10:05
                                                                                  11:00
                                                                                  11:55
                                                                                  12:50
                                                                                  13:45
                                                                                  14:40
                                                                                  15:35
                                                                                  16:30
                                                                                  17:25
                                                                                  18:20
                                                                                  19:15
                                                                                  20:10
                                                                                  21:05
                                                                                  22:00
                                                                                  22:55
                                                                                  23:50
                      Solar        Wind          Geothermal    Biomass
                                                                                  Hour ahead forecast   Demand (5 min. avg.)   Net demand
                      Biogas       Small hydro   Batteries

                               Max Load served by Renewables                  CAISO estimates that by 2024 there will be
                                                                              times during certain days when 100% energy
                                                                              will come from variable energy resources
% of Total Load

                                                                              Systems will require increasing amounts of
                                                                              operational flexibility
                                                                              Systems with an excess of must-run
                                                                              resources will experience negative pricing,
                                                                              forced curtailment, or export.
                                                                              Energy production shifting from conventional
                                                                              resources to Variable EnergyFebruary
                                                                                                             Resources
                                                                                                                   28, 2019 4
                                                                         Source: CAISO
Flattening Supply and Low Prices dues to
Increasing Renewables – PJM Example

                                                                           Increasing renewable
                                                                           penetration – mostly
                                                                           wind

 Load growth has stayed
 relatively flat over the years
 Supply curve has shifted
 right causing decrease in
 energy prices

                                                                                   February 28, 2019   5

                                  Source: PJM State of the Market Report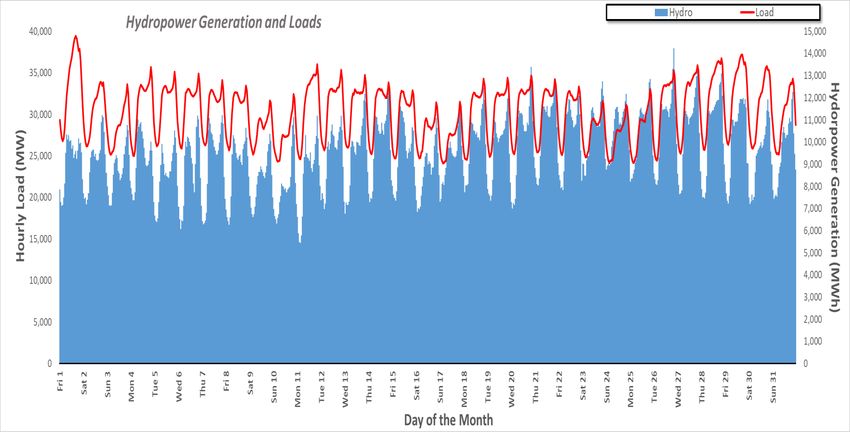
Changes on the Horizon:
Technology – Energy Storage

                                                              ERCOT and PJM
                                                              installations are geared
                                                              for frequency regulation
                                                              and hence, tend to be
                                                              power-oriented

 Source: US EIA Form EIA-860

   CAISO – predominantly
   reliability oriented
   requiring at least 4
   hours of energy
   capacity to fulfill CPUC
   requirements
                               Source: US EIA Form EIA-860M
                                                                          February 28, 2019   6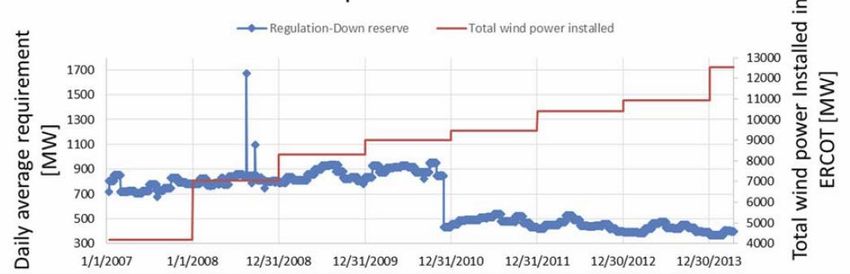
Current Power Market Trends

  Low energy prices, because of high penetration of zero-production
  cost renewables, and low natural gas prices. There are low prices in
  day-ahead and real-time markets, and hence, even with the inherent
  volatility is causing some of that shift along with growing comfort of
  participants to rely on markets to meet their needs.
  Flat demand even in a growing economy. Electricity demand is flat.
  Greater demand-side efficiency reduces overall loads but may make
  them “peakier.” Investment strategies and planning paradigms need to
  shift to ensure adequate levels of flexibility exist.
  Decreasing ancillary services needs and prices. This is a trend seen
  in all ISOs with the exception of CAISO, and is due to increased
  sophistication in renewables forecasting methods and integration as well
  as a growing comfort of system operators with given reserve margins.

                                                                         7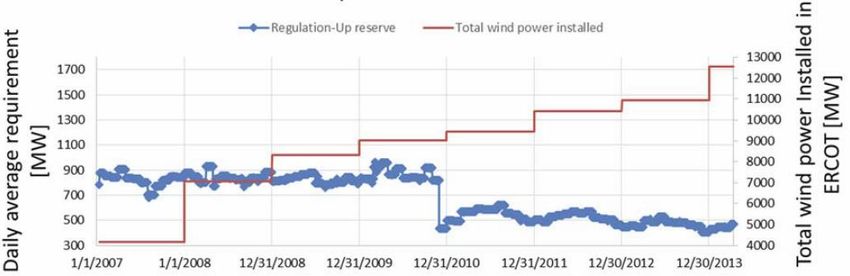
Current Power Market Trends:
All-in Prices Across Markets

     https://www.potomaceconomics.com/wp-content/uploads/2018/05/2017-State-of-the-Market-Report.pdf

     Prices have stayed the same over the years across markets

                                                                                                February 28, 2019   8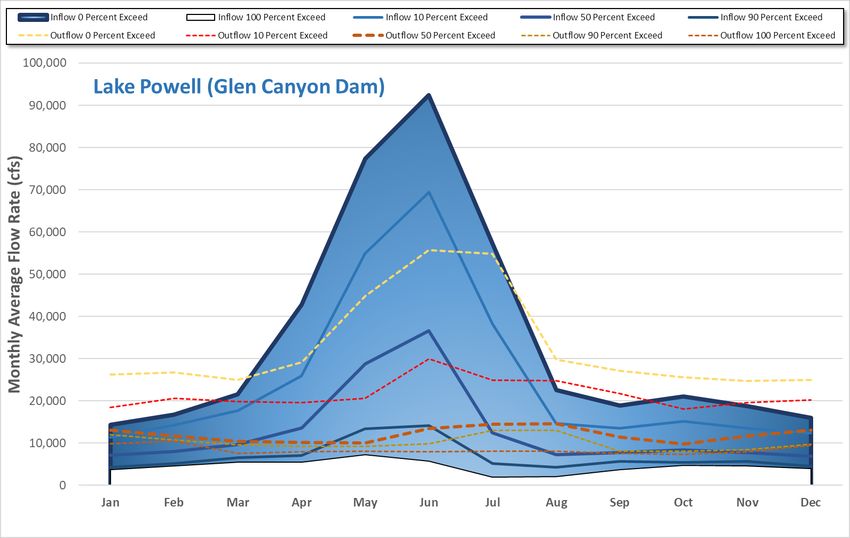
Regulation Reserve Requirements –
ERCOT Example

             Regulation Up                                                               Regulation
                                                                                         requirement in
                                                                                         ERCOT market has
                                                                                         decreased due to
                                                                                         improvements in
                                                                                         forecasting, and
                                                                                         other operating
                                                                                         procedures
              Regulation Down
                                                                                         Trends in other
                                                                                         markets are mixed:
                                                                                         CAISO increased
                                                                                         its requirement
                                                                                         from 400 to 800
 Source: http://sites.utexas.edu/energyinstitute/files/2016/12/UTAustin_FCe_Ancillary-
                                                                                         MW in early 2016
 Services_2016.pdf
                                                                                                February 28, 2019   9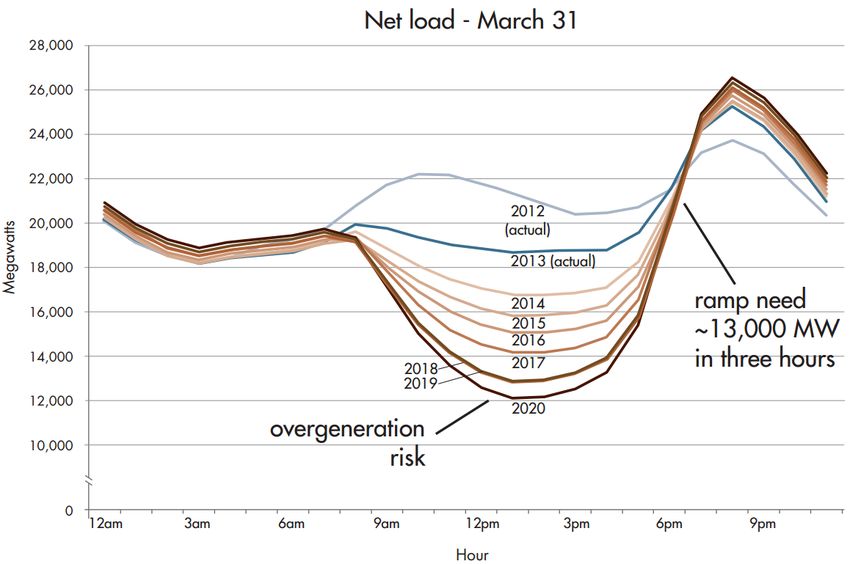
Reliability Impacts:
NERC CPS1 Score – ERCOT Example

           Source: http://sites.utexas.edu/energyinstitute/files/2016/12/UTAustin_FCe_Ancillary-Services_2016.pdf

 Reliability, as measured by NERC CPS1 score has increased over time
                                                                                                                    February 28, 2019   10
Changing Paradigm of Renewable
Operations and Contract Structures
Flexible operations of VERs being proposed
Hawaiian Electric Co. signed contracts for
dispatchable renewables
Question: What are the implications for
hydropower fleet and operations?
Plant nameplate capacity:
300 MW
Power output curtailed
during these operating hours
to maintain headroom for
inertia and primary
frequency response
February 28, 2019 11Changes on the Horizon:
Power Market Changes
New market products to meet
increasing flexibility requirements:
Ramping/flexible capacity
Product expansion, increasingly
granular products
Intra-hour scheduling, dispatch, and
settlement
Western market convergence
CAISO administered Energy Imbalance
Market (EIM) footprint growing
More and more balancing authorities
participating in the EIM
Discussions ongoing regarding
consolidation of western BAs under a
single ISO/RTO
12Greenhouse Gas Compliance in the
Energy Imbalance Market – 2017
Almost 65% of the compliance obligations were assigned to hydro
GHG emissions prices were less than CEC established compliance costs
February 28, 2019 13
for an efficient gas resourceChanges on the Horizon:
Market Design Changes in other parts
PJM considering a change to the existing price formation process by
allowing inflexible units to set market prices
Pros: Avoids out-of-market settlements;
Cons: Unintended consequences not well known, presently
ERCOT considered redefining ancillary services products but the
initiative failed after a lengthy stakeholder process
Some of the ideas are in the process of being implemented, such as fast
frequency response reserves
CAISO presently engaged in design and analysis of a day-ahead
ramping reserve product
CAISO has added a new category of requirements to the Resource
Adequacy (RA) program called Flexible Resource Adequacy
February 28, 2019 14Changes on the Horizon:
Ramping Resource Adequacy in CAISO
Category 1 – Category 2 – Category 3 –
Base Ramping Peak Ramping SuperPeak Ramping
5 hour block 5 hour block
Economic Bid – Must
5:00AM – 10:00PM 12 PM to 5 PM for May – September
offer Obligation
3 PM- 8 PM for January- April and October-December
Minimum 6hrs at Effective Minimum 3hrs at Effective Minimum 3hrs at Effective
Energy Requirement Flexible Capacity (EFC) Flexible Capacity (EFC) Flexible Capacity (EFC)
Daily Availability 7 days a week 7 days a week Non-Holiday Weekdays
Set monthly based on Set based on the difference Maximum of 5% per month
Maximum quantity of
largest secondary net load between 100% of the of the total requirement per
capacity allowed ramp requirement and category 1 month
Minimum of 2 starts per day
or the # of starts allowed by
Daily start-up capability operational limits as At least 1 start per day At least 1 start per day
determined by min up and
down time
No limitations that translate No limitations that translate Must be capable of
Other limitations to less than the daily to less than the daily responding to at least 5
requirements requirements dispatches per month
Conventional gas fired Use-limited conventional Short discharge battery
Examples of types of resources, wind, hydro, gas fired generation, solar, resource providing
resources storage with long discharge conventional gas fired regulation and demand
capabilities peaking resources February
response 28, 2019
resources 15DOE-WPTO Hydropower Value
Research
February 28, 2019 16Hydropower Value Study
Study funded by Department of Energy’s (DOE’s)
Water Power Technologies Office (WPTO)
Project Team:
Argonne National Laboratory (Argonne)
Idaho National Laboratory (INL)
National Renewable Energy Laboratory (NREL)
Oak Ridge National Laboratory (ORNL)
Pacific Northwest National Laboratory (PNNL) – Project Lead
Timeline
Start date: March 2018
End date: March 2019Project Overview
Motivating questions:
How is hydropower currently contributing to grid services?
What services/capabilities will be needed by the grid in the future?
Can hydropower provide the services based on technical capability and cost?
Project intent:
Foundational work to understand present hydropower operations trends,
future expected changes, and hydropower capabilities analysis
Project design:
Will involve extensive data collection and analysis on market participation
trends, operational practices, and technological capabilities
Will not involve design of new market rules, hydro operations models/tools
Expected outcomes:
Comprehensive understanding of hydropower’s evolving value proposition
Understanding of high-impact future research needs – research roadmapAnalysis of Hydropower
Operations in the US
TOM VESELKA – ARGONNE NATIONAL LABORATORY
NATHALIE VOISIN – PACIFIC NORTHWEST NATIONAL LABORATORY
RUI SHAN – OAK RIDGE NATIONAL LABORATORY
February 28, 2019 19WECC: Hydropower Production Is Dispatchable Following
Loads More Effectively than other Renewable Resources
Combined Loads & Generation for the CISO & BPAT BAs
Shifting operations from load following to maximizing value based on
market prices would change hydropower economics
20CAISO: Hourly averaged correlations
between solar and small hydro
By Power Output By Percent of Generating Mix
Small hydro’s increase in generation Small hydro’s proportional increase
during both the morning and especially during the morning peak, but
afternoon peak periods when solar also across all the hours of the day
PV increases, on a daily basis. when solar PV increases.
Analysis by: Rui ShanISO-NE: Ancillary Services Participation
200
600 180
160
500
140
400 120
$/kW
100
$/kW
300
80
200 60
40
100
20
0 0
2008 2009 2010 2011 2012 2013 2014 2015 2016 2017 2008 2009 2010 2011 2012 2013 2014 2015 2016 2017
Energy Others Capacity Payment Blackstart Regulation Spinnning
Supplemental Voltage support Uplift
Capacity payments represent majority of non-energy revenue
Spinning Reserve and Black Start provide more revenue than Regulation, Supplemental
Reserve and Voltage Support
February 28, 2019 22MISO: Patterns of Pumped Storage Hydro
Generation and Pumping
Generation: PSH plants generate
most of the times during high price
periods, as expected
Pumping: PSH plants operate in
pumping most of the times during
low price periods, as expectedChelan PUD – Impact of Water Availability
on Hydropower Operations
Water availability, and resultant water management issues impact operations
February 28, 2019 24Significant hydropower services, which
may or may not be effectively monetized
Rotating mass / Inertia
This property has been historically abundant in the system
Inertia can be synthetically produced, but failure to have enough will cause
system frequency (60 hZ) to deviate
Primary Frequency Response. Hydropower is considered a fast and
accurate responding market participant. But the speed of signal matters:
California ISO notes that hydropower’s provision of primary frequency response (less
than a minute) is “predictable,” but its performance is relatively sluggish and inaccurate
due to older hydropower plants using mechanical controls as a proxy for power signals
Flexibility. Hydropower can contribute many services. Resources are
compensated on a competitive basis for each service that they provide,
but not for their ability to provide multiple services depending on the
need.
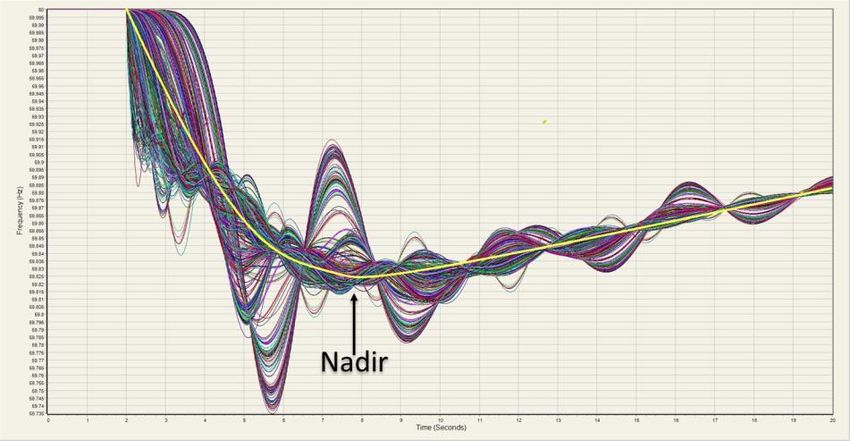
25Inertial and Governor Response: Resource-level Responses Hydro resources are typically programmed to provide governor response, along with the autonomous inertial response
Inertial and Governor Response:
System Response

               System recovers because of both
               inertial and governor response    System blackout because
                                                 of lack of governor
                                                 response

   Basis for CAISO’s Transferred Frequency
       Response Obligation Construct
Changes on the Horizon:
Market-based Mitigation Measures
Planned mitigation measures are shown in blue, while already existing mitigation
February 28, 2019 28
measures are shown in black; Source: ERCOTFuture Grid States: Implications to Hydropower Operations and Value MICHAEL INGRAM – NATIONAL RENEWABLE ENERGY LABORATORY
Hydropower Value Drivers in Future Grid
    Report the inferred value of hydropower based on the impacts and requirements
    identified in literature review and the NREL Interconnections Seam Study.

Power Systems Metrics              Flexibility
                                   • “Duck” Curve

   Stability
                                                               Reliability
   • Frequency Response
                                                               • Black Start
   • Transient Stability
                                                               • Reactive Power Support

   Economics
                                                               Ancillary Service
   • Operational Costs
                                                               • Operating Reserves
   • Value
                                                                                      30
Examples: Model vs. Actual
Glen Canyon Dam and Blue Mesa
31Gaps and Challenges in Hydroelectric
Representation in Power System Models
Comparison of
Long-Term Planning
Decision-Making Processes
Hydropower
Short-Term Planning
Real-Time Scheduling
Operations
Automated Controls
Timescales and
Power System Time
Equipment & Use Variability Water Demand & Competing Use Variability
Scales (courtesy of ORNL)
Power System Dynamics
Turbine, Gate, and Flow Dynamics
Ecological Variability
Community Response
Population Response & Growth
Individual Organism Response & Growth
Hydrologic Variability Landscape & Riverscape Adj.
Hydropower in
Temperature and Water Quality Variability
Pool (Elevation) Variability
power system
Precipitation, Runoff, and Unregulated Flow Variability operations
• Spatial, temporal, unit and computational complexity creates seams
issues between water management and grid models
• Hydropower representation presently does not depict the
complexity, diversity, and changed operational paradigm of the fleet
Hydropower represented as a
monthly potential at the
balancing authority scaleKey Takeaways
Power grids and markets are evolving, and conventional value streams
may no longer be the most valuable
Some evidence of changes in operations – Helms (PG&E)
More system-wide work is needed to asses flexibility characteristics
Further economic analysis is needed to assess the cost vs. benefit of
operating resources more flexibly
System stability and reliability needs with increased renewables will
impact hydropower operations – more analysis needs to be performed
February 28, 2019 33HVS Project Core Tasks
Landscape analysis
More granular exploration of how hydropower is used, and how it is valued
Contribution to reliability services presently not monetized:
Inertia and primary frequency response
Future value drivers
Possible evolution of the power system, and
Implications on demands that could be placed on hydropower resources
Capabilities and Constraints
Technical and water management drivers of flexibility
What does it cost to be flexible?Key Takeaways
Power grids and markets are evolving, Flexible Operations:
and conventional value streams may no
longer be the most valuable Some evidence of changes in
dispatch of small hydro (CAISO)
600 Hydropower in ISO-NE due increasing PV penetration
500
Hydro resources presently provide
400
10% of CAISO-wide Flexible
$/kW
300 Resources Adequacy requirement
200
100 Flexibility is resource specific, and depends on
0
water availability and environmental requirements
2008 2009 2010 2011 2012 2013 2014 2015 2016 2017
Energy Others
System Reliability: More than
100% increase in uplift service
by hydro in ISO-NE from 2015
to 2016; indicates fast-start
capability hydro units
February 28, 2019 35Challenges Facing Hydropower Valuation
Valuation methodologies and mechanisms. As presently defined,
market products and services will not adequately justify investments in
capital intensive projects and technologies. Value drivers such as
resilience, reliability, and flexibility are not explicitly priced. For example,
with flexibility, a resource may be compensated for a specified service,
but not its ability to perform any one of several services at a given
moment.
Complex interface between markets and operational parameters,
including water constraints. System-driven optimization (like PJM) of
hydropower may not present the entire suite of value streams to the
resource.
36Changes on the Horizon:
Regulatory Shift
FERC decisions adjusted market requirements to accommodate
energy storage.
Order 841 (February 2018), FERC issued Order No. 841 requiring system
operators to remove barriers to the participation of electric storage resources
in the capacity, energy, and ancillary services markets. Each ISO/RTO must
revise its tariff to include market rules that recognize the physical and
operational characteristics of electric storage resources.
Order 842 (February 2018),
37Changes on the Horizon:
Technology – Electric Cars
Grid Impacts:
Significant increase in energy consumption
Change in load shapes, not presently known
Potential significant increase in instantaneous power requirement
February 28, 2019 38Reservoir Water Storage Reduces Variability and
Significantly Adds to Hydropower’s Value
Gen is highest
during peak
load month
Generation (MWh)
Monthly inflow
variability is much
greater than
outflow variability
The ability to reduce variability and shift water releases/generation
to high value months is a function of storage capacity 39Changes on the Horizon:
Technology – Energy Storage
State mandates:
California – 1325 MW (AB 2514, 2013) + 500 MW (AB 2868, 2017)
Massachusetts – 200 MWh by 2020
New York – 1.5 GW by 2025
State incentives:
Nevada – Allows energy storage systems to be included in RPS
Maryland – 30% ITC on residential and commercial systems
Some states require IOUs to include energy storage in IRPs
PG&E’s 500MW/2270 MWh storage procurement:
Three projects from third-party owners, totaling 385.5 MW, 1,540 MWh, and
One 182.5 MW, 730 MWh project the utility would own
February 28, 2019 40You can also read