Retailer Margins in Victoria's Electricity Market - Discussion Paper May 2013
←
→
Page content transcription
If your browser does not render page correctly, please read the page content below
Retailer Margins in Victoria’s
Electricity Market
Discussion Paper

May 2013
An appropriate citation for this paper is: Essential Services Commission 2013, Retailer Margins in Victoria’s Electricity Market — Discussion Paper, May ESSENTIAL SERVICES COMMISSION. THIS PUBLICATION IS COPYRIGHT. NO PART MAY BE REPRODUCED BY ANY PROCESS EXCEPT IN ACCORDANCE WITH THE PROVISIONS OF THE COPYRIGHT ACT 1968 AND THE PERMISSION OF THE ESSENTIAL SERVICES COMMISSION.
RETAILER MARGINS IN
VICTORIA’S ELECTRICITY
MARKET
Discussion Paper

May 2013
Chairperson’s Preface

In 2009, the last vestiges of price regulation of Victorian energy markets were removed.
Retail prices for electricity and gas since that time have been determined by service
providers competing for customers and without any involvement of the Victorian
Government or the Essential Services Commission. While each retailer must publish its
standing offers for each distribution zone in the Government gazette, the tariffs in these
‘default’ contracts are determined solely by the retailer. The only obligation relating to the
tariffs retailers choose to make available in their market offers pertains to the requirement to
provide the Commission with at least one widely available market offer for publication on the
Commission’s yourchoice comparator website.

For a number of years, the Commission has used this data to publish annual pricing reports
seeking to summarise the range of standing and market offers made available by retailers,
and identify year-on-year price movements. In the main, these reports have provided a
‘snapshot’ of the retail market rather than a detailed analysis of the reasons for the observed
movements in prices. By some estimates, retail electricity prices have increased in Victoria
by approximately 80 per cent over the five years to 2011-12.

To gain greater insights into the factors driving higher retail electricity prices in Victoria, the
                                                                                                 1
Commission engaged SKM-MMA to model retailers’ costs (including non-retail inputs and
retailers’ own operating costs). By deducting these costs from observed prices, SKM-MMA
estimated movements in retailer margins between 2006 and 2012 (that is, prior to the
introduction of carbon pricing). The modelling results are summarised in this discussion
paper and SKM-MMA’s full report is available on our website. While we urge readers of
these reports not to attribute a false degree of precision to the results as reported, we
believe the results are indicative, interesting and relevant.

Because there is no single representative Victorian electricity price, the model estimates
gross and net retailer margins for the numerous offer types available across each of the five
distribution zones. While findings vary, the overall picture is one of decreasing retailer

1
    Modelled non-retail input costs include: wholesale energy costs, regulated network costs the costs
    associated with various State and Federal schemes.
margins in the last few years prior to full deregulation and increasing margins since then; particularly in 2011-12. Importantly, the model has no predictive power about future trends in retail margins. In the times ahead, the Commission will seek feedback on the model and its results in order to identify the most valued options for future assessments of the state of retailer competition in the Victorian electricity market. Similarly, we will consult with interested parties on how the regulatory framework (non-pricing) that we administer can be improved in support of more competitive outcomes. Dr Ron Ben-David Chairperson
TABLE OF CONTENTS
CHAIRMAN’S PREFACE                                        1

1     INTRODUCTION                                        4
1.1 CONTEXT                                                4

1.2 PURPOSE OF THE RESEARCH                                5

2     MAIN FINDINGS                                       6
2.1 COSTS                                                  6

2.2 GROSS MARGINS                                          8

2.3 NET MARGINS                                           12

2.4 INTERPRETING THE FINDINGS                             14

3     NEXT STEPS                                          16

REFERENCES                                                17

ESSENTIAL SERVICES COMMISSION VICTORIA   [REPORT TITLE]    3
1 Introduction

The Essential Services Commission (ESC) has a broad monitoring role in relation to the
energy retail market in Victoria, and each year produces monitoring reports on comparative
pricing and customer service standards. The ESC is currently conducting additional
research into the Victorian electricity retail market. The main part of the research to-date is a
study of electricity retailer costs of supply and profit margins. The ESC commissioned
Sinclair Knight Mertz-MMA (SKM-MMA) to undertake the detailed analysis. Its report titled:
“Analysis of Electricity Retail Prices and Retail Margins 2006 – 2012” is available on the
ESC’s website. The ESC has also released a short background paper summarising previous
studies of the effectiveness of competition in the Victorian electricity retailing market and
summary data relating to some key features of the market.

This paper discusses the ESC’s purposes in commissioning the SKM-MMA study,
summarizes the main findings of that study, and draws out the implications for further
research and regulatory activity.

1.1       Context

In February 2008, the Australian Energy Markets Commission (AEMC) completed an inquiry
into the effectiveness of competition in the Victorian energy retail market, finding that the
market was effectively competitive, and leading to the removal of all retail price controls from
1 January 2009. There has been no ex post review of how competition has progressed since
the AEMC study and since retail price deregulation.

In its November 2011 study of possible electricity retail price movements, the AEMC
provided a breakdown of electricity retail prices in each State and Territory by cost
component. The retailer gross margin in Victoria (that is, the retailer’s net revenue after all
external costs have been taken into account) was estimated to be 34.4 per cent, compared
to 7.3 per cent in New South Wales (NSW); 9.5 per cent in Queensland; and 1.7 per cent in
South Australia (AEMC 2011, 5). These margins were calculated on the basis of standing

ESSENTIAL SERVICES COMMISSION VICTORIA   [REPORT TITLE]                              4
2
offer prices rather than market offers, which the majority of Victorian customers pay. The
AEMC emphasised that the estimates need to be treated with caution given overall lack of
data. In other jurisdictions, some costs may have been estimated using regulator-allowed
costs, and may include an additional retailer margin (AEMC 2011, 5). For these reasons, the
AEMC estimates of retailer gross margins in Victoria need to be viewed with some caution.

Recent substantial increases in retail prices are known to be influenced by regulated
network prices, but there have also been claims that retail margins in Victoria have also
been increasing (Gibson 2012). St Vincent de Paul has observed that meaningful product
differentiation has emerged in the Victorian market since deregulation (Dufty and Mauseth
2012, 9), but also suggested that retailers, being squeezed by retail price regulation in other
states, may be seeking to recover additional margins in Victoria.

1.2         Purpose of the Research

While numerous reports have been released about overall price movements in Victoria in
recent years, there has been no systematic analysis of the drivers of these price
movements. Various explanations have been proffered (e.g. Energy Retailers Association of
Australia 2012). These include: network costs, wholesale electricity costs and the cost
imposed by government policies (State and Federal). The analysis commissioned by the
ESC examines the component elements of costs and prices in the Victorian electricity
market in order to shed light on the question: Why did electricity prices increase by
                                                                                3
approximately 80 per cent in Victoria over the five years to 2011-12?

The analysis of retailer costs and margins is not intended to answer definitively questions
about the progress of electricity retail competition in the post-deregulation period or to
evaluate the claims that competition has been ineffective in constraining retail margins. Its
purpose is limited to providing information and analysis to shed light on the sources of
electricity retail price movements in Victoria in recent years. Nonetheless, we would expect
the analysis to inform discussions about the effectiveness and extent of competition in the
Victorian retail electricity market.

2
    Standing offer prices are the prices that each retailer publishes in the Victoria Government Gazette in
    accordance with s 35 of the Electricity Industry Act 2000, and are available to all consumers. Market
    offer prices are the prices offered to customers by retailers and are usually lower than the standing
    offer contracts, and may include incentives to pay on time or via direct debit etc.
3
    Average of four quarterly index numbers to June 2012 divided by the same to June 2007. Source:
    Australian Bureau of Statistics, 6401.0 - Consumer Price Index, Australia, March Quarter 2013, Sub-
    Groups-Electricity-Melbourne.

ESSENTIAL SERVICES COMMISSION VICTORIA    [REPORT TITLE]                                     5
2 Main Findings
SKM-MMA is a specialised consulting centre within Sinclair Knight Merz (SKM) which was
formed after the acquisition of McLennan Magasanik Associates (MMA) by SKM in 2010.
SKM-MMA was selected by the ESC to undertake the electricity retailer margins study
because of their extensive expertise in Australian energy markets.
SKM-MMA’s study is a ‘bottom-up’ analysis of retailer supply costs for typical customers.
These costs are then compared to the estimated revenue for typical customers supplied
under different types of tariffs, to obtain estimates of retailer gross margins and net margins.
The period of analysis covers seven years from 2005-06 to 2011-12. This period precedes
the introduction of the Commonwealth Government’s carbon pricing regime which came into
effect on 1 July 2012. The analysis identifies trends in costs and retail margins over the
period.
2.1 Costs
The two main types of retailer costs recognised in the study are the ‘wholesale supply cost
to retailers’ and retailer operating costs. The wholesale supply costs to retailers comprise:
purchased energy costs; adjustment for line losses; network charges; “green” scheme costs;
and market operation fees. Total wholesale supply costs increased substantially from
approximately 13.2 cents per kilowatt-hour (c/kWh) in the period 2005-06 to 2006-07, to
around 19.9 c/kWh in the period 2010-11 to 2011-12, an increase of over 50 per cent (see
4
Table 2.1).
Network costs accounted for a significant part of that increase, driven by both investment in
the distribution network and new metering service costs. Network costs accounted for
approximately 48 per cent of the increase in wholesale supply costs to retailers over the
period. Electricity purchase and risk management costs also made an important contribution
to the overall increase in the wholesale supply cost to retailers, accounting for 38 per cent of
4
Based on the Powercor distribution zone and a customer consuming 4000 kWh per year.
ESSENTIAL SERVICES COMMISSION VICTORIA [REPORT TITLE] 6the wholesale supply cost increase over the same period. Other additional costs were the
State and Federal “green” schemes such as the renewable energy target schemes, feed-in
tariffs and energy efficiency schemes. These were an insignificant cost item at the beginning
of the period studied, but by 2011-12 they represented 7 per cent of total wholesale costs to
retailers. These costs accounted for 14 per cent of the increase in wholesale supply costs
over the period.
Table 2.1: Wholesale supply cost components, weighted average all distribution zones (c/kWh)
Year ending June
2006 2007 2008 2009 2010 2011 2012
Network costs 6.7 6.6 6.9 7.0 8.1 9.5 10.3
Wholesale electricity costs 5.1 5.2 5.9 6.8 7.2 7.1 6.4
Wholesale risk costs 1.2 1.1 1.2 1.7 2.6 2.4 1.7
Green & white certificate costs 0.1 0.1 0.1 0.3 0.5 0.8 1.3
Market charges 0.1 0.1 0.1 0.1 0.1 0.1 0.1
Total 13.3 13.1 14.2 15.9 18.5 20.0 19.8
Sources: SKM-MMA Appendix E; AER ‘State of the Energy Market’ (various issues).
Table 2.2 shows the total wholesale supply cost per distribution zone. In the Citipower zone,
these costs were lower than for most other zones, but increased at a similar rate to those in
the United Energy and Jemena zones. Wholesale supply costs in the SP AustNet zone
increased comparatively rapidly, from having the lowest cost in 2006 to having the highest in
2012. Wholesale supply costs in the Powercor zone increased more moderately than in
other zones.
Table 2.2: Total wholesale supply cost by distribution zone (c/kWh)
Year ending June
2006 2007 2008 2009 2010 2011 2012
Powercor 13.8 13.5 14.5 16.0 18.0 19.7 19.5
SP AusNet 12.2 12.4 13.6 15.5 18.2 19.7 20.5
United Energy n.a. 13.7 14.7 16.8 19.7 20.4 20.0
Citipower 12.6 12.5 13.4 15.0 17.3 18.9 17.9
Jemena 13.2 12.7 13.8 15.1 18.4 21.0 20.1
Source: SKM-MMA Appendix E.
ESSENTIAL SERVICES COMMISSION VICTORIA [REPORT TITLE] 72.2 Gross Margins
The gross retail margin refers to the difference between the retailer’s price and its wholesale
supply cost (in c/kWh), divided by retailer’s wholesale supply cost. Under this definition, a
gross retailer margin of 30 per cent implies that for every dollar of a retailer’s wholesale
supply costs, the retailer adds a retail margin of 30 cents to cover its own costs and provide
a profit. Alternatively stated, 77 per cent of the final price faced by customers goes to cover
the wholesale supply costs and 23 per cent is retained by the retailer.
There are several different kinds of prices for which gross margins can be calculated. At the
broadest level there is a distinction between the standing offer which a retailer is obliged to
publish in the Government Gazette and the market offers the retailer makes available
through its sales channels. The latter are usually discounted relative to standing offers.
Among the standing offers, those of the host retailers are of most interest because it is
assumed that most customers that remain on standing offer tariffs are with the host retailer
5
for their area. According to the AEMC, approximately 25 per cent of Victorian residential
electricity customers are on standing offer tariffs (AEMC 2013, 61).
There is also a distinction between several tariff classes. The classifications used in the
SKM-MMA study are: (a) the single rate, which has either a single variable rate, or a
6
multipart variable rate, but has no off-peak component; (b) the dual rate, which has an off-
peak component that is metered through a dedicated circuit (referred to as the “controlled
load”); and (c) the time-of-use tariff, which includes any combination single or multi-part
peak charge with an off-peak rate, metered via an interval meter. The estimated average
price in c/kWh received by the retailer under these different tariff types is dependent on
assumptions made about the consumption level and time-profile of the typical household on
7
each tariff type.
Retailers’ prices also vary between each of the five distribution zones. Hence there are at
least (2 × 3 × 5 =) 30 different tariffs per retailer for which gross margins can be calculated.
This highlights the difficulty in identifying a single representative price. An average price
cannot generally be calculated due to the unknown proportions of customers on each tariff
type, and the unknown relative mix of each retailer’s customers by distribution zone and
tariff type. Moreover, the pricing data provided to the ESC by the retailers only refers to
5
‘Host retailer’ refers to a retailer (or its successor) that previously held a retailing franchise prior to the
introduction of full retail competition.
6
All of these tariff types also have a supply charge.
7
The SKM-MMA study assumes that the average annual consumption of customers on fixed-rate tariffs
is 4000 kWh, for those on dual rate tariffs it is 6500 kWh and for those on time-of-use tariffs it is 9000
kWh.
ESSENTIAL SERVICES COMMISSION VICTORIA [REPORT TITLE] 8“open” market offers, that is, market offers currently available in the marketplace. Once a
market offer is closed, no information is published by the retailers about the tariffs faced by
customers still on these “closed” plans.
SKM-MMA reports gross margins for three tiers of retailers. “Tier 1” represents the three
major retailers, AGL, Energy Australia and Origin Energy. “Tier 2” represents larger entrants
including Australian Power & Gas, Lumo Energy, Red Energy and Simply Energy. “Tier 3”
represents all other retailers, including Neighbourhood Energy, Momentum, Dodo and
others. In each case they are also separately reported for different types of tariffs, namely:
single rate; dual rate; and time-of-use tariffs.
2.2.1 Gross Margins — Standing Offer Tariffs
8
Before the deregulation of host retailer standing offer prices in January 2009, SKM-MMA
found that the gross margins within those standing offer prices remained around 30 per cent
for customers on single tariff rates (see Table 2.3). This remained the case for the first year
or so after deregulation, but beginning in 2010-11 there was a substantial increase, and by
2011-12 the gross margins within host retailer standing offer prices reached over 45 per cent
(single tariff rate).
Table 2.3: Gross margins – Host retailer standing offer price, simple average of all
distribution zones (%)
Year ending June
2006 2007 2008 2009 2010 2011 2012
Single rate 30.9 29.0 35.9 31.9 30.5 34.9 46.2
Dual rate 14.2 16.1 23.1 17.3 16.8 21.4 32.3
Time-of-Use 22.5 22.3 29.4 26.4 22.6 23.7 35.4
Source: SKM-MMA (see Figures 4-1, 4-14 & 4-16).
The estimated gross margins in the dual and time-of-use standing offer tariff rates were
much lower. In 2012, the gross margin for the dual rate standing offer was 14 percentage
points below the single rate, and for the time-of-use standing offer it was 11 percentage
points lower than the single rate. SKM-MMA suggested that retailers face greater risk under
the single rate tariff structure. By 2012, gross margins in dual rate standing offers and time-
of-use standing offers were up to 15 percentage points higher than earlier in the period.
8
Host retailer standing offer prices were deregulated on 1 January 2009.
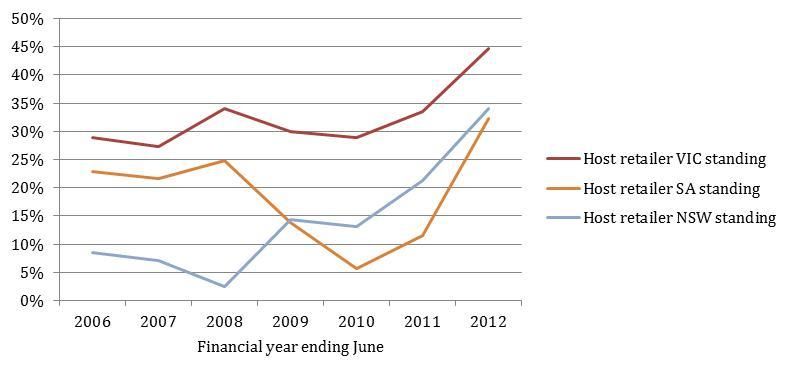
ESSENTIAL SERVICES COMMISSION VICTORIA [REPORT TITLE] 9SKM-MMA also compared the gross margins in standing offer prices in Victoria with those in
New South Wales (NSW) and South Australia (SA), where standing offer prices remain
regulated. Gross margins were higher in Victoria when compared to NSW and SA, both
before and after the deregulation of price controls in Victoria. The trends in gross margins in
Victoria, under standing offer prices, were similar to those in other states, which all showed
an increase toward the end of the period (see Figure 3.1).
Figure 2.1: Interstate comparison of electricity retailer gross margins – Standing offer
contracts with single rate tariffs, 2006 to 2012 (%)
Source: SKM-MMA (Figure 4-12).
2.2.1 Gross Margins — Market Offer Tariffs
The majority of customers in Victoria are on market offer contracts — according to the
AEMC, approximately 75 per cent of residential customers (AEMC 2013, 61). The market
offer prices included in SKM-MMA’s analysis are net of the discounts offered by retailers but
do not take into account any other financial or non-financial gifts (e.g., one-off joining-up
rebates or magazine subscriptions respectively).
SKM-MMA found that the gross margins within the market offer tariffs of Tier 1 retailers
declined between 2007-08 and 2009-10, but have since increased to earlier levels. They
have generally been greater than those of smaller retailers, but this gap diminished over the
period. The spread between standing offers and market offers of Tier 1 retailers has
increased over time.
Table 2.4 shows that in 2005-06, the discounted market offer gross margins of Tier 1
retailers (for single rate tariffs) were around 30 per cent, declining to around 20 per cent in
2009-10, but returning to 30 per cent in 2011-12. The gross margins of Tier 1 market offers
ESSENTIAL SERVICES COMMISSION VICTORIA [REPORT TITLE] 10in 2005-06 were similar to those of host retailer standing offer prices in the same year
(shown in Table 2.2), but by 2011-12 they were approximately 16 percentage points lower
than gross margins on standing offers, largely due to the very large increase in host retailer
standing offer prices.
The gross margins in market contracts of Tier 2 and Tier 3 retailers (single rate tariff) varied
widely in the range between 11 per cent and 28 per cent over the period from 2005-06 and
2010-11, and on average was 22 per cent for Tier 2 and 19 per cent for Tier 3 retailers
(compared to 26 per cent for Tier 1 retailers). The gross margins of Tier 2 and Tier 3
retailers increased to 27-28 per cent in 2011-12. Although the gap between the gross
margins of Tier 1 and smaller retailers was around 9-10 percentage points in 2005-06, it
declined to just a few percentage points in 2011-12 as Tier 2 and Tier 3 retailer gross
margins converged to those of Tier 1 retailers.
Table 2.4: Gross margins – Discounted Market offer prices, simple average of all
distribution zones (%)
Year ending June
2006 2007 2008 2009 2010 2011 2012
Single rate
1st tier retailer 31.1 26.7 29.5 24.2 21.0 23.0 29.9
2nd tier retailer 21.3 22.0 27.4 17.4 20.1 21.8 28.1
3rd tier retailer 22.1 13.5 25.1 23.9 16.4 11.3 26.5
Dual rate
1st tier retailer 9.0 19.4 22.2 10.4 7.2 12.6 18.9
2nd tier retailer -1.6 12.1 15.2 5.3 5.3 11.5 16.5
3rd tier retailer 5.1 5.6 21.9 11.2 3.4 -0.6 16.3
Time-of-Use
1st tier retailer n.a. n.a. n.a. 18.1 14.8 13.2 21.1
2nd tier retailer n.a. n.a. n.a. 12.0 10.5 9.2 18.0
3rd tier retailer n.a. n.a. n.a. 15.9 8.7 0.2 15.3
Source: SKM-MMA (see Figures 4-1, 4-14 & 4-16).
The foregoing discussion relates only to customers on single rate tariffs. Retailer gross
margins from customers on dual rate or time-of-use tariffs, whether standing or market
offers, are generally lower than those from single rate tariffs. SKM-MMA suggested there is
more risk typically factored into single rate tariffs to cover uncertainty in peak and off-peak
energy usage (SKM-MMA 2013, 28–29). For example, the gross margins within the single
rate market offers of Tier 2 retailers over the period 2005-06 to 2011-12 averaged 23 per
cent, compared to gross margins of 9 per cent in the same retailers’ dual rate market offers,
and 12 per cent for these retailers’ time-of-use market offers. Thus, the gross retail margin in
Tier 2 retailers’ dual rate market offers was 13 percentage points lower than for single rate
offers on average, and gross margins in time-of-use market offers were on average
ESSENTIAL SERVICES COMMISSION VICTORIA [REPORT TITLE] 11estimated to be 10 percentage points lower than for single tariffs. A similar pattern is found
with Tier 1 and Tier 3 retailers. As with single rate tariffs, gross margins on dual rate and
time-of-use tariff market offers increased notably after 2009.
2.3 Net Margins
Net retailer margin refers to the difference between retailer revenue and total retailer costs
(including both the wholesale supply cost and retailer operating costs) divided by total
retailer costs. For example, a net retail margin of 25 per cent implies that the retailer collects
25 cents on top of every dollar it spends on covering its wholesale supply costs and its own
operating costs. However, net margins should not be confused with net profits because, for
example, there may be costs to the retailer associated with carrying working capital needed
to manage the risk and variability of cash flows, and depreciation of physical assets (SKM-
MMA 2013, 31).
The difference between net margin and gross margin relates to retailer operating costs, and
these were estimated by SKM-MMA based on previous decisions made by the Independent
Pricing and Regulatory Tribunal (IPART) in NSW.
2.3.1 Net Margins — Standing Offer Tariffs
Table 2.5 shows the SKM-MMA estimates for net retailer margins for host retailers under
their standing offer prices. Over the period 2005-06 to 2009-10 the average net margins in
retailer standing offer prices were around: (i) 13 per cent for single rate tariffs; (ii) 6 per cent
for dual rate tariffs; (iii) 15 per cent for time-of-use tariffs. In 2010-11 and 2011-12, the net
margins of host retailer standing offers increased strongly to: (i) 27 per cent for single rate
tariffs; (ii) 19 per cent for dual rate tariffs; (iii) 26 per cent for time-of-use tariffs.
Table 2.5: Net margins – Host retailer standing offer price, simple average of all
distribution zones (%)
Year ending June
2006 2007 2008 2009 2010 2011 2012
Single rate 15.0 12.9 13.9 11.9 12.8 18.2 27.1
Dual rate 4.3 5.5 8.3 4.3 5.3 10.4 19.3
Time-of-Use 14.6 14.1 17.9 16.0 13.5 15.6 25.8
Source: SKM-MMA (see Figures 6-1, 6-3 & 6-5).
ESSENTIAL SERVICES COMMISSION VICTORIA [REPORT TITLE] 122.3.2 Net Margins — Market Offer Tariffs
In regard to market offer prices, SKM-MMA found that over the period to 2009-10, the
average net retail margins of Tier 1 retailers were higher than those of Tier 2 retailers, which
were again higher than those of Tier 3 retailers. With regard to single rate tariffs, the
average net margin of Tier 1 retailers over this period averaged approximately 9 per cent,
compared to 5 per cent for Tier 2 retailers and 3 per cent for Tier 3 retailers. For the most
part, the net retail margins of retailers under dual rate and time-of-use tariffs were lower than
for single rate tariffs.
In 2010-11 and 2011-12, net margins of retailers of all three tiers increased significantly. By
2011-12, they ranged from around 13 per cent for the single rate tariffs of Tier 1 retailers to
around 11 per cent for Tier 2 retailers, and 10 per cent for Tier 3 retailers. Again, in most
cases the net margins of retailers under dual rate and time-of-use tariffs remained lower
than for single rate tariffs. Across all tariff types and the three tiers of retailing, the findings
reported in Table 2.6 suggest that net margins have increased, indicatively, by around 7
percentage points since 2009. This is lower than the comparable increase in standing offer
net margins discussed in the previous section.
The net margins of larger and smaller retailers have also tended to converge over the
period. For example, the gap between the average net retail margin of Tier 1 retailers and
those of Tier 2 retailers was 6.1 percentage points between 2005-06 and 2006-07, but this
reduced to 1.3 percentage points between 2010-11 and 2011-12 (single rate tariff).
Table 2.6: Net margins – Discounted Market offer prices, simple average of all distribution
zones (%)
Year ending June
2006 2007 2008 2009 2010 2011 2012
Single rate
1st tier retailer 15.2 10.3 8.5 5.3 4.6 7.7 12.8
2nd tier retailer 6.5 6.6 6.8 -1.1 3.8 6.7 11.3
3rd tier retailer 7.3 -0.6 4.8 5.1 0.6 -2.5 9.9
Dual rate
1st tier retailer -0.5 8.5 7.6 -1.9 -3.4 2.3 7.2
2nd tier retailer -9.7 1.7 1.4 -6.8 -5.1 1.3 5.1
3rd tier retailer -4.0 -4.1 7.3 -1.2 -6.8 -9.7 4.8
Time-of-Use
1st tier retailer n.a. n.a. n.a. 8.4 6.3 5.8 12.5
2nd tier retailer n.a. n.a. n.a. 2.7 2.4 2.1 9.6
3rd tier retailer n.a. n.a. n.a. 6.4 0.7 -6.3 7.2
Source: SKM-MMA (see Figures 6-1, 6-3 & 6-5).
ESSENTIAL SERVICES COMMISSION VICTORIA [REPORT TITLE] 132.4 Interpreting the Findings The Victorian retail energy market is marked by dozens of different pricing plans operating at any point in time. Standing offers vary by region and meter (or tariff) type, and market contracts additionally vary according to the discounts and other inducements they offer. Moreover, at any point in time, there will be a significant number of customers on ‘closed’ contracts for which there is no publicly available pricing information. Against this context, the analysis undertaken by SKM-MMA seeks to identify broad trends in retailer margins over the period 2006 to 2012. Any other interpretation would suggest a false degree of precision. Since the electricity standing offer prices of the Victorian ‘host retailers’ were deregulated in January 2009, the net margins built into those tariffs appear to have increased considerably. This will be particularly relevant to customers that have never taken up a market offer or who have defaulted back to a standing offer (whether with a host retailer or other) at the expiry of a market offer. The rapid increase in standing offer margins may reflect a view among retailers that these customers are “sticky” insofar as they do not seem to respond to higher prices by switching to discounted contracts or other retailers. It remains unknown to what extent this ‘stickiness’ reflects customer complacency as opposed to a more fundamental inability by certain classes of customers to interact with the competitive market. The analysis undertaken by SKM-MMA also suggests that in the last years of the period examined, and especially 2011-12, there also appears to have been an increase in retailer gross and net margins included in market offer prices. While prices differ across regions and tariff types, it appears that the extent of price differentiation across differently sized retailers’ market offers is generally diminishing. By construct, the model shows the spread of retail margins narrowing between the different of retailers in line with the observed convergence in retail prices. This, of course, assumes that all retailers incur the same cost structure (on a per customer basis) irrespective of their scale of operations. Whether this, and other, assumptions produces any systematic biases in the findings towards an under or over- statement of retailer margins cannot be known at this time. Most notably, there is a lack of verifiable data for retailer operating costs. Moreover, the extent to which competition has driven efficiencies in retailers’ operating costs remains unknown. SKM-MMA has not assumed an ‘efficiency dividend’ reflecting the competitiveness of the Victorian market in its modelling of retailer operating costs. The SKM-MMA analysis suggests that host retailer standing offer prices (single rate) typically increased by more than 70 per cent between 2006-07 and 2011-12. However, the increases in market offer prices (single rate) were lower, typically between 55 and 60 per cent over the same period. Many customers will have switched from standing offer contracts to lower market offer rates during this period, and realised savings in this way. ESSENTIAL SERVICES COMMISSION VICTORIA [REPORT TITLE] 14
SKM-MMA's estimates of wholesale electricity supply costs, summarised in Table 2.1,
suggest an increase of approximately 41 per cent between 2006-07 and 2011-12. In other
words, an increase in retailers' gross margins over that period appears to account for
between 20 and 30 per cent of the price increases observed in market and standing offers,
respectively.

Alternatively stated, while gross retailer margins have increased by between 20 per cent
(market offers) and 60 per cent (standing offers) in the five years to 2011-12, this increase
accounts for between 20 and 30 per cent of the higher prices observed in market and
standing offers. The rest of the increase is explained by higher wholesale, network and
'green scheme' costs.

Without more observations over several years, caution must be exercised in interpreting
these findings and before making inferences about the degree of competitive pressure in the
Victorian retail electricity market. While a sustained upward trend in retailer margins may
signal diminishing competitive tension in the market, it remains to be seen whether recent
increases persist.

ESSENTIAL SERVICES COMMISSION VICTORIA   [REPORT TITLE]                           15
3 Next Steps

The SKM-MMA analysis raises a number of important questions and it provides a
methodology for estimating retail margins. At this stage, it also highlights the lack of relevant
information concerning certain key features of the Victorian retail electricity market, such as
the proportions of customers on each kind of tariffs, the typical consumption patterns of
customers on each type of tariff, and the effects of changes in retailer margins on customer
switching between tariffs or between retailers, among other things. Moreover, little is known
about how retailers alter tariffs once customers have entered into market contracts and
those market plans are withdrawn (or ‘closed’) by retailers. Further, inherent difficulties
remain in estimating retailer costs

Despite these limitations, the SKM-MMA analysis provides useful insights into the Victorian
retail electricity market for small customers. As this is the first attempt of its kind, the ESC
will continue to review and consult on its approach and how it might be improved to best
inform the community about the state of the Victorian market. As a first step, we intend
updating the analysis after another year’s data becomes available. Also, late in 2013-14 the
ESC intends to publish on its website its database of standing and market offers for the
period 2008-09 to 2012-13.

In addition, the ESC will seek to gather greater insights to customers’ interactions with the
competitive market. As a first step, we are commissioning a survey to gauge the recent
experiences of electricity retail customers. This will update the information gathered when
we last surveyed customers in 2008 (prior to full deregulation). Once complete, the results of
that survey will be published on our website.

In the meantime, the ESC will continue to publish its annual pricing, customer service and
compliance reports in order to inform the community about the state of the Victorian retail
energy market. Similarly, we will continue to report on the results of our regulatory audits of
retailers (and others) as well as any enforcement actions undertaken.

We will also be consulting with interested parties about opportunities for improving the
regulatory framework in line with promoting the long-term interests of Victorian consumers
through a fairer and more competitive retail energy market.

ESSENTIAL SERVICES COMMISSION VICTORIA   [REPORT TITLE]                              16
References

AEMC. 2011. “Possible Future Retail Electricity Price Movements: 1 July 2011 to 30 June
       214, Final Report.”

———. 2013. “Possible Future Retail Electricity Price Movements: 1 July 2012 to 30 June
      2015, Electricity Price Trends Report.”

Dufty, Gavin, and May Mauseth. 2012. “The National Energy Market - in a Bit of a State?
         Observations from Vinnies’ Tariff-Tracking Project.”

Energy Retailers Association of Australia. 2012. “Global Report Shows Australian Energy
        Markets Are Leading the World.” http://eraa.com.au/wp-content/uploads/Australian-
        energy-markets-leading-the-world.pdf.

Gibson, Joel. 2012. “Why Victoria’s Better ... for Electricity Customers Anyhow.” One Big
         Switch News. https://www.onebigswitch.com.au/news/2012/11/why-victorias-better-
         for-electricity-customers-anyhow/#.UPijoh2yBjQ.

Roy Morgan. 2013. “Survey of Residential Customers of Electricity and Natural Gas in New
       South Wales: Effectiveness of Retail Competition.”

SKM-MMA. 2013. “Analysis of Electricity Retail Prices and Retail Margins 2006-2012.”

ESSENTIAL SERVICES COMMISSION VICTORIA   [REPORT TITLE]                      17
You can also read