Data Analytics Insights to Date - Not for Circulation November 2020

Page created by Gilbert Mccoy
 
CONTINUE READING
Data Analytics Insights to Date - Not for Circulation November 2020
Data Analytics Insights to Date

Not for Circulation

November 2020
Data Analytics Insights to Date - Not for Circulation November 2020
Update – Week 6

      Agenda

                               Introduction

                               County Specific Analysis

                               Restrictions Impact Analysis

                               International Analysis

                  Data analytics briefing - 25 November 2020 - DRAFT - Not for circulation
Data Analytics Insights to Date - Not for Circulation November 2020
Providing data analysis to support Government decision making

        EY Data Analytics team was engaged to analyse certain aggregated data available to the State as part of the State’s Covid 19 management strategy.
        EY’s role was to analyse the available data and to present it back to Government officials to consider as part of its on-going deliberations and
        decision making with regard to Covid 19 restrictions. The focus is situating disease incidence rates in the context of other data (e.g. restriction
        changes) to produce insights, rather than performing epidemiology.

                                                                                Where and how is the
                                                                                disease spreading?

                                                                                                                      More likely to come from
                                                                              More likely to come

                                                                                                                           other sources
                                                                                 from Health
             What impact are the                                                                                                                 What restrictions are in
             restrictions having?                                                                                                                       place?

                                                                             Are people complying?

Focus of this work                                           Data analytics briefing - 25 November 2020 - DRAFT - Not for circulation
Data Analytics Insights to Date - Not for Circulation November 2020
Summary of initial findings

                •          Extending county analysis to Local Electoral Areas (LEA) helps provide a more specific understanding of what is happening in each county. These profiles can broadly be
                           categorised as follows:
                             1.     Significant known outbreak event(s)
                             2.     Proximity to the border
                             3.     Following the national profile
                             4.     Proximity to and scale of Dublin
                •          We now have a far more expansive testing criteria. This means that it is difficult to directly compare Wave 1 and Wave 2. While accepting that, it is worth noting the shift in
                           recorded outbreaks from being led by Nursing Homes in Wave 1 to Private Households in Wave 2. This contributes to a reduction of 15 years in the median age of identified cases
                           from Wave 1 to Wave 2 (Source: CSO)
                •          Social gatherings, citizen congregations and specific local events all appeared to have contributed to Wave 2 outbreaks
                •          The introduction of Level 3 nationally did not reduce the 14 day incidence rate per 100k for majority of counties. The introduction of further household restrictions (Level 3 Max)
                           from mid-October drove a reduction across most counties
                •          Wet pubs opened in all counties except Dublin in late September. This also coincided with universities opening together with specific sporting events. The 14 day disease
                           incidence rate per 100k started to increase ten days later in every county. This increase was not seen to the same extent in Dublin
                •          The LEAs containing University College Cork (UCC) and National University of Ireland Galway (NUIG) both saw higher increases than the rest of their county when the universities
                           opened. This difference was reduced when the universities went online. Wet pubs also opened in both cities on the same week that universities opened
                •          The northern counties, and especially LEAs on the border, do appear to be impacted by proximity to the border. Donegal is not seeing significant reductions with Level 4 that was
                           seen in other border counties
                •          The reopening of construction, non-essential retail and the wider Phase 3 changes during the summer do not appear to have had a material impact on the 14 day disease
                           incidence rate per 100k nationally or in larger counties. It should however be noted that the disease rate was low at this time

                                                                                                                                                    Data analytics briefing - 25 November 2020 - DRAFT - Not for circulation
Source: Median Age June 5th: 48 (CSO COVID-19 Deaths and Cases Series 4) - https://www.cso.ie/en/releasesandpublications/br/b-cdc/covid-19deathsandcasesseries4/
Median Age for week ending 30th October: 33 (CSO COVID-19 Deaths and Cases Series 15) - https://www.cso.ie/en/releasesandpublications/br/b-cdc/covid-19deathsandcasesseries15/
Data Analytics Insights to Date - Not for Circulation November 2020
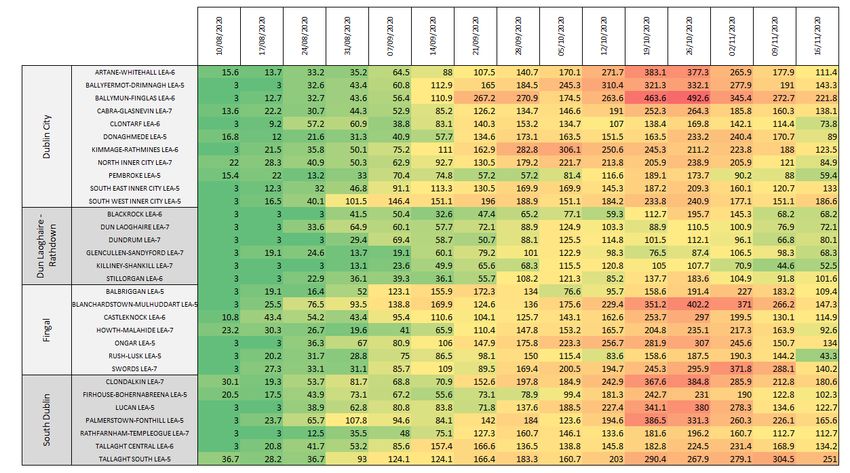
County specific analysis
County Analysis Summary

                                                                                                                                Dublin and         Following national
                                       County                     Border county               Known outbreaks                                                                      Wave One – main outbreak sources        Wave Two – main outbreak sources   14 day incidence rate per 100k (26/07 – 17/11)
                                                                                                                             surrounding area       restrictions trend

Source: Outbreak sources – CIDR, Incidence rate –based on daily cumulative case data published on GeoHive to 17 November 2020.
This data is published daily. Note: Wave one defined as 03/03-25/07; Wave 2 is 26/07-20/11
*Carlow-Kilkenny, Laois-Offaly, Longford-Westmeath and Sligo-Leitrim are combined in CIDR                                                       Data analytics briefing - 25 November 2020 - DRAFT - Not for circulation
**Due to Kildare outbreak data including West-Wicklow, any outbreak cases in that area have been included with Kildare, not Wicklow
Summary of county-level 14 day incidence rate per 100k

              The heatmap below shows the 14 day incidence rate per 100k population for each county over the last two months. The overall reduction in cases
              has levelled to 17/11, with some county incidence rates increasing.

Source: Based on daily cumulative case data published on GeoHive to 22 November 2020. This data is published daily; Population: Census 2016, CSO

                                                                                                                                                   Data analytics briefing - 25 November 2020 - DRAFT - Not for circulation
Overview of Restriction Analysis Methodology

                                  It is not easy to quantify the value of restrictions. There have been relatively few changes in restrictions, which generally combine more than one change at a time,
                                  therefore hiding the unit value per restriction. There is also a time lag between a restriction change and the impact being seen, and the incidence rate can clearly be
                                  impacted by significant outbreaks. We have used the below methodology to initially quantify the impact of changes in restrictions. This calculation has been applied
                                  across counties. The outputs should be seen as directionally useful, rather than precise statistical outputs. A sensitivity analysis has also been completed looking at a
                                  reduced 7 day and rolling average incidence rate over 3 days per 100k especially for periods where there were more frequent restriction changes.
                                  It should be noted that this does not measure compliance or behavioural aspects related to restrictions.
                                  They are also presented alongside international academic research to provide a broad view to support decision-making. Further analysis has commenced to enhance the
                                  measurement of correlation between restrictions and their impact.

                                                      10 days later          Start to count impact of                                                                                         10 days later
Change in Restriction                                                                                                                                            Change in Restriction (new                   Stop counting impact of
         X                                                                         Restriction X                                                                    or turn off previous)                          Restriction X

                                                                                                                                                                                                                                   Estimated value
                                                                                                                                                                                                                                         of
                                                                                                                                                                                                                                    Restriction X
 14 day Incidence rate per 100k

                                                                                                                                                                                                                                    Use average
                                                                                                                                                                                                                                   daily change in
                                                                                                                                                                                                                                       14 day
                                                                                                                                                                                                                                   incidence rate

                                   DAYS                                                           Data analytics briefing - 25 November 2020 - DRAFT - Not for circulation
Summary of Restriction Impact

          The below heatmap shows the average daily change in 14 day incidence rate per 100k per restriction. The impact is calculated using the approach
          described in Slide 8.
  Restriction Effective Date     29/02/2020    12/03/2020    15/03/2020    24/03/2020    27/03/2020    01/05/2020    15/05/2020    28/05/2020   08/06/2020     29/06/2020   13/07/2020    21/07/2020    08/08/2020    19/08/2020     21/08/2020    31/08/2020    19/09/2020    21/09/2020    26/09/2020    07/10/2020                16/10/2020         22/10/2020

Restriction Estimated Start of
                                 10/03/2020    22/03/2020    25/03/2020    03/04/2020    06/04/2020    11/05/2020    25/05/2020    07/06/2020   18/06/2020     09/07/2020   23/07/2020    31/07/2020    18/08/2020    29/08/2020     31/08/2020    10/09/2020    29/09/2020    01/10/2020    06/10/2020    17/10/2020                26/10/2020         01/11/2020
            Impact

                                      Childcare
                                                               Retail,    Stay at
                                                                                     Stay at
                                                                                                                                     Face masks             Lockdown
                                                                                                                                                                                     Lockdown
                                                                                                                                                                                      lifted for Schools +
                                                                                                                                                                                                                                                                               Wet Bars *                       **              **
                                                                                                                                                                                                                                                                                                                                Level 4
                                                                                                                                                                                                                                                                                                                                          Level 5
                                                                                                                                                                                                                                                                                                                                                           **
Avg daily change in 14 day   No        closed,                                        home Constructio Mandatory Phase 2    Phase 3                                      Face masks                                                                               Level 3      Opened         Level 3      Level 3 Level 3 Max Donegal,
                                                Bars closed restaurants home order                                                    on public Green List Laois, Offaly            Laois, Offaly, childcare                                                                                                                            National (to
 incidence rate per 100k restrictions School                                       increased n Opened    PLF     reopening reopening                                      in shops                                                                                Dublin        except        Donegal      National National    Cavan,               Note:
                                                             etc closed   (2km)                                                       transport              Kildare                extended for opened                                                                                                                                  22 Nov)
                                       Closed                                        to 5km                                                                                                                                                                                     Dublin                                         Monaghan                  The outputs should be seen as
                                                                                                                                                                                        Kildare
          Carlow                     0             0            1             -2            2              -5            1            -2            -1            0             0             2                           -4                           1                           5                          17               -7                           -9
                                                                                                                                                                                                                                                                                                                                                                         directionally useful, rather than
                                                                                                                                                                                                                                                                                                                                                                         precise statistical outputs
          Cavan                      0             0            8             18            0              -6            -3           -3            0             0             0             0                           0                            3                           43                         17                                  -62      -21
           Clare                     1             4            3              0            1              -4            2            -4            0             0             2             0                           0                            2                           15                         -5               -4                           -6           The reopening of wet bars
           Cork                      2             2            3             -3            -1             1             -2           -1            0             0             0             0                           0                            4                           10                          7               -5                           -9           coincided with universities
         Donegal                     0             0            5              5            -2             -1            0            0             0             0             0             1                           0                            9                           12            1                                                0         -4       *   opening together with specific
          Dublin                     3             6            11             1            -2             -4            -3           -1            0             0             0             1                           2                            4             4                                                          -6                          -5           sporting events
         Galway                      1             1             2            -2            0              0             -1           -1            0             0             0             0                           1                            3                           11                         12               -15                         -10          Care required when interpreting
           Kerry                     1             5             3             4            -1             0             0            0             0             0             0             0                           1                            0                           11                          9               -10                          -6          restriction changes in quick
          Kildare                    1             2             5             3            0              -4            -1           0             0             0             3             9             -7            -5            -2             1                            8                          7                -9                          -7          succession. Specifically. the
         Kilkenny                    1             1             4            -3            -1             0             -3           0             0             0             0             1                           0                            0                            6                          3                -7                          -2       ** more recent restriction changes
           Laois                     1             0             1             0            0              -2            0            0             0             0             2             2             -2            -2             0             1                            7                          8                -7                          -7          (Level 3, Level 3 Max and Level
          Leitrim                    1             0             3             2            0              -1            -1           0             1             -1            0             0                           4                            -1                          12                          0               -17                          -1          5) happened within a 15 day
         Limerick                    1             1             5            -1            -1             -2            -1           0             0             0             1             1                           2                            -1                          12                          7                -5                          -3          period
        Longford                     1             1             3             4            7             -20            -1           -1            0             0             0             0                           2                            2                            6                          5                -8                          -6           The absolute number of weekly
           Louth                     1             1             3             1            0              -3            0            -1            0             0             0             1                           1                            2                            7                         12                -2                          -4           tests has significantly
           Mayo                      0             1             4            10            -1             -2            -2           0             0             0             0             0                           0                            1                            7                         12                -3                          -7           increased since Wave 1
          Meath                      1             2             3             8            0              -3            -1           0             0             0             0             0                           1                            2                           24                         19               -34                         -15
                                                                                                                                                                                                                                                                                                                                                                         This analysis does not also
        Monaghan                     0             0             3            17            0              -2            -2           -3            0             0             0             1                           1                            7                           11                         -3                                  -12       -7
                                                                                                                                                                                                                                                                                                                                                                         consider potential behavioural
          Offaly                     1             1             6            -2            2              2            -12           0             0             0             0             7             -9            -1             2             1                            6                          2               -10                          -2
                                                                                                                                                                                                                                                                                                                                                                         changes beyond the
       Roscommon                     0             1             1             2            6             -14            0            -2            0             0             0             1                           0                            5                            4                          4               -10                          -3           restrictions
            Sligo                    1             0             3            -4            0              -2            0            0             2             -2            0             0                           0                            1                           17                         16               -14                         -12
        Tipperary                    1             1             5            -1            1              -5            0            -1            0             0             0             3                           -4                           0                            4                          3                0                           -2
        Waterford                    1             3             2            -3            -1             0             0            0             0             0             0             1                           1                            1                            6                          9                -4                          -2
       Westmeath                     2             3             7             2            3             -13            -1           -1            0             0             0             0                           1                            1                           12                         18               -15                         -13
         Wexford                     0             0             1            -1            0              -1            0            0             0             0             0             1                           0                            0                           13                          3               -16                          -6
         Wicklow                     1             5             5             3            -1             -3            -1           0             0             0             -1            1                           1                            1                            2                          3                -5                          -1
          Source: Based on daily cumulative case data published on GeoHive to 17 November 2020. Measures the average daily change in the 14 day incidence rate per 100k for the period of time that the restriction was in place for that county. Does not measure compliance with restrictions or other behavioural aspects

                                                                                                                                                         Data analytics briefing - 25 November 2020 - DRAFT - Not for circulation
The introduction of Level 3 Max and Level 5 both coincide with a reduction incidence rates

      The introduction of Level 3 saw the 14 day incidence rate per 100k decrease in four counties only. However, incidence did start to reduce in all
      counties with the introduction of further household restrictions (Level 3 Max) and then Level 5. These three restriction changes happened within a
      15 day period, with Level 3 Max only active for 6 days.
      For completeness, this analysis has also been repeated for a 7 day and a daily incidence rate average over three days. All three are shown below and
      follow a not identical, but very similar pattern.

               Average Daily Change in 14 Day Incidence Rate for                                                   Average Daily Change in 7 Day Incidence Rate for                                            Average Daily Change in Daily Incidence Rate (3
                     Restriction Impact Period - National                                                                Restriction Impact Period - National                                                  day avg) for Restriction Impact Period - National
 10                                                                                                                                                                                                      0
  8                                                                                               0
  6                                                                                                                                                                                                    -0.2
                                                                                                 -1
  4
  2                                                                                              -2                                                                                                    -0.4
  0                                                                                              -3
 -2                                                                                                                                                                                                    -0.6
 -4                                                                                              -4
                                                                                                                                                                                                       -0.8
 -6                                                                                              -5
 -8                                                                                                                                                                                                     -1
-10                                                                                              -6
-12                                                                                              -7                                                                                                    -1.2
            Level 3 National          Level 3 Max National            Level 5 National                    Level 3 National                 Level 3 Max National                     Level 5 National          Level 3 National       Level 3 Max National            Level 5 National
              07/10/2020                  16/10/2020                    22/10/2020                          07/10/2020                         16/10/2020                             22/10/2020                07/10/2020               16/10/2020                    22/10/2020
              17/10/2020                  26/10/2020                    01/11/2020                          17/10/2020                         26/10/2020                             01/11/2020                17/10/2020               26/10/2020                    01/11/2020

                       Restriction, Effective Date, Estimated Start of Impact                                             Restriction, Effective Date, Estimated Start of Impact                                    Restriction, Effective Date, Estimated Start of Impact

Note:
•     Care required when interpreting restriction changes in quick succession. This analysis does not also consider potential behavioural changes beyond the restrictions
•     Each measure in the above three graphs quantify the impact over a different time period; 14 days, 7 days and 1 day respective. Hence, it is expected that the size of their impact is different. That is also why they are shown to different scales on the y axis
•     National measure excludes Dublin, Donegal, Cavan and Monaghan as they were under different restriction changes
•     The Level 5 reductions should be seen as additive to the reduction in Level 3 Max

                                                                                                         Data analytics briefing - 25 November 2020 - DRAFT - Not for circulation
Cavan’s three LEAs follow a different path. One is being driven by outbreaks, one impacted by the
  border and one more aligned with the national trend
CavanSummary
      profile: findings:
• Cavan has experienced a higher 14 day disease incidence rate per 100k during the second wave than the
  national average
• Part of Cavan borders with NI where different restrictions are in place
Summary analysis:
• Cavan-Belturbet LEA is the only part of Cavan with a NI border. This LEA is experiencing a higher disease
  incidence than the national average
• Ballyjamesduff LEA had the highest incidence rate throughout October. The timing of the acceleration of
  growth rate in this LEA appears to correlate with the GAA county final (winners are in this LEA)
• Travel along the N03 between Belturbet and George Mitchell Bridge at the NI Border fell 33% during
  October (Source TII Road Travel data)
Restriction impact:
• The timing of the growth of cases appears to correlate with the events listed above and changes to
  restrictions in wet pubs                                                                                                   Source: Based on daily cumulative case data published on GeoHive to 17 November 2020. This data is published daily.

• Level 4 restrictions imposed for the border counties appears to have desired impact of reducing
  incidence level in Cavan
• Level 5 restrictions continue to drive incidence level further
Employment Summary:
• Cavan had c.47% of its workforce on PUP or TWSS (c.15k) at the peak in early May (EY 2019 employment
  estimates). There are currently 4.7k on PUP (17 Nov) which is down from 9.7k in May (CSO, DSP)
Notes
The restriction impact is based on disease incidence combined with the dates the restrictions are imposed.
It is not a measure of compliance or does not take behavioural aspects into consideration

                                                                                                                             Source: Based on weekly OpenHive data to 16 November 2020, Government Open Data initiative. This data is published weekly.

                                                                                        Data analytics briefing - 25 November 2020 - DRAFT - Not for circulation
Meath is seeing a higher incidence rate than the national average. This is influenced by proximity to
Dublin and specific outbreak events
Meath profile:
   Summary findings:
• Meath has experienced a higher 14 day disease incidence rate per 100k during second wave than the
  national average
• Dublin borders including a significant commuter population
Summary analysis:
• Ratoath LEA has the highest incidence rate. The timing of this acceleration of growth rate appears to
  correlate with GAA county final win (Source: GAA.ie)

Restriction impact:
• The timing of the growth of cases appears to correlate with the events listed above and the changes to
  restrictions in wet pubs
• Incidence level continued to rise post initial Level 3 restrictions imposed nationally
• Level 3 (max) restrictions imposed nationally appear to have desired impact of reducing incidence levels
• Level 5 restrictions continue to drive incidence level down further                                                          Source: Based on daily cumulative case data published on GeoHive to 17 November 2020. This data is published daily.

Employment summary:
• Meath had c.42% of its workforce on PUP or TWSS ( c.40k) at the peak in early May (EY
  2019 employment estimates). The numbers currently on PUP (17 Nov) remain lower than peak (13k
  versus 25k) levels (CSO, DSP)
Notes
The restriction impact is based on disease incidence combined with the dates the restrictions are imposed.
It is not a measure of compliance or does not take behavioural aspects into consideration

                                                                                                                             Source: Based on weekly OpenHive data to 16 November 2020, Government Open Data initiative. This data is published weekly.

                                                                                       Data analytics briefing - 25 November 2020 - DRAFT - Not for circulation
The border is contributing to Donegal’s higher rate of cases. Donegal is not seeing the benefit of
    recent Level 4 increases seen in other border counties
Donegal profile:
         Summary findings:
•       Donegal has experienced a higher 14 day disease incidence rate per 100k
        during second wave than the national average
•       Disease incidence higher and earlier versus national average, and
        reducing at a slower rate
•       Eastern Donegal borders with NI where different restrictions are in place
Summary analysis:
•       Lifford and Stranolar LEA close to the NI border with Derry, experienced an
        earlier and higher disease incidence
•       Other eastern parts of Donegal (Buncrana, Letterkenny and Carndonagh)
        have the next highest incidence rates
•       A large hospital outbreak in Letterkenny resulted in 99 cases in November
        alone (Source: Donegal Daily)
•       Private Household attributable to 67% of outbreaks in the county from
        September to October, but only 30% in November
Restriction impact:
•       Disease incidence continued to rise after level 3 Donegal announcement                                                  Source: Based on daily cumulative case data published on GeoHive to 17 November 2020. This data is published daily.

•       Specific restrictions in NI (1/10) on pubs and restaurants appeared to
        have helped reduce rate in Donegal
•       Despite level 3 max and level 5 being effective in other counties, cases in
        Donegal fell at a lower rate compared to national levels
•       Similarly, Level 4 reduced the cases in Monaghan and Cavan, but not                                                                                                                                                                                                                            10.00
        Donegal. Mask compliance in Donegal also reduced (against national and
        previous Donegal trend) with Level 4 restrictions (Facebook survey data)                                                                                                                                                                                                                           -
Employment summary:                                                                                                                                                                                                                                                                                              Monaghan Level 4   Cavan Level 4   Donegal Level 4

                                                                                                                                                                                                                                                      Daily Change in 14 day Incidence rate per 100k
                                                                                                                                                                                                                                                                                                       (10.00)
•       Donegal had c.49% of its workforce on PUP or TWSS ( c.30k) at the peak in
        early May (EY 2019 employment estimates). The numbers currently on                                                                                                                                                                                                                             (20.00)
        PUP (17 Nov) remain lower than peak (12k versus 23k) (CSO, DSP)
Notes                                                                                                                                                                                                                                                                                                  (30.00)
The restriction impact is based on disease incidence combined with the dates the restrictions are
imposed. It is not a measure of compliance or does not take behavioural aspects into consideration                                                                                                                                                                                                     (40.00)
The Facebook survey is a voluntary survey, managed by the University of Maryland. The mask
question reads “In the last 7 days, how often did you wear a mask in public?”.                                                                                                                                                                                                                         (50.00)

                                                                                                                                                                                                                                                                                                       (60.00)

                                                                                                                                                                                                                                                                                                       (70.00)
                                                                                                     Source: Based on weekly OpenHive data to 16 November 2020, Government Open Data initiative. This data is published weekly.

                                                                                                                                          Data analytics briefing - 25 November 2020 - DRAFT - Not for circulation
Cork is broadly aligned with the national trend. Cork City is driving up the incidence rates across
  the county
Cork profile:
     Summary findings:
• Cork is broadly aligned with the national average for the 14 day disease incidence rate per 100k during second wave
Summary analysis:
• Cork City is the most impacted area, with the rest of the county following with a reduced incident rate
• Cases in Cork City South Central, the LEA containing UCC (started returning on 21 Sept), were twice as high as other
  LEAs in Cork city during mid October. This gap declines in November as the universities went online
Restriction impact:
• Cases in Cork city rose as wet pubs reopened (21 Sept). Cases around the rest of the county followed shortly after
• There were a number of GAA games in early October, which coincides with rate increases. No matches occurred after
  this, with level 3 restrictions being applied around this time (6 Oct). Cases throughout Cork began to fall 10 days later
Employment summary:
• At peak, c.39% of Cork’s workforce were on PUP or TWSS (c.96k) (EY 2019 employment estimates). Current PUP                                  Source: Based on daily cumulative case data published on GeoHive to 17 November 2020. This data is published daily.
  levels (17 Nov) are lower than the previous peak (35k versus 62k in May) (CSO, DSP)

Notes
The restriction impact is based on disease incidence combined with the dates the restrictions are imposed. It is not a
measure of compliance or does not take behavioural aspects into consideration

                                                                                                                                              Source: Based on weekly OpenHive data to 16 November 2020, Government Open Data initiative. This data is published weekly.

                                                                                          Data analytics briefing - 25 November 2020 - DRAFT - Not for circulation
Galway rose above the national average during the second wave, driven by Galway City Central and
    Connemara South LEAs
Galway profile:
     Summary findings:
•   Galway experienced a higher 14 day disease incidence rate per 100k during second wave than the national
    average
•   It has now come back down below national average levels since early November
Summary analysis:
•   Galway City Central, Connemara South and Galway City East have had the highest 14-day incidence rates
    throughout October
•   GAA senior championship football semi-finals and finals also occurred in the last week of September and first
    week of October. Connemara South rates increased 10 days later
Restriction impact:
•   Cases begin to decline ten days after the national level 3 lockdown came into effect (17/10), falling below
    national levels in November
•   An exception to this is Gort-Kinvara, which saw cases continue to rise into early November
Employment summary:                                                                                                                   Source: Based on daily cumulative case data published on GeoHive to 17 November 2020. This data is published daily.
•   Galway had c.39% of its workforce on PUP or TWSS (c.49k) at the peak in early May (EY 2019
    employment estimates). There are currently 19.5k on PUP (17 Nov) which is down from 32.5k in May (CSO,
    DSP)
Notes
The restriction impact is based on disease incidence combined with the dates the restrictions are imposed. It is
not a measure of compliance or does not take behavioural aspects into consideration

                                                                                                                                    Source: Based on weekly OpenHive data to 16 November 2020, Government Open Data initiative. This data is published weekly.

                                                                                         Data analytics briefing - 25 November 2020 - DRAFT - Not for circulation
Dublin LEA Analysis

The below heatmap shows the Dublin LEA 14 day incidence rate per 100k population since early August. Some areas are seeing higher incidence
rates.

 There appears to be a correlation between areas hit hard in Wave 1 and Wave 2 (acknowledging differences in testing criteria), with areas hit hard across both waves including areas such as Blanchardstown-Mulhuddart, Ongar, Lucan, Clondalkin and Artane-Whitehall.

 Source: Based on weekly OpenHive data to 16 November 2020, Government Open Data initiative. This data is published weekly.
                                                                                                                              Data analytics briefing - 25 November 2020 - DRAFT - Not for circulation
Dublin includes over a quarter of Ireland’s population. It therefore includes many stories and
  strongly aligns with national case levels
Dublin profile:
     Summary findings:
• Not surprisingly, Dublin’s 14 day disease incidence rate per 100k during second wave is in line with the national
  average
• Significant differences exists within each of the four county council areas of Dublin with Dún Laoghaire–
  Rathdown seeing lower overall incidence
Summary analysis:
• Highest incidence rates in areas such as Lucan, Ballymun and Swords. Largest outbreaks also focused in the
  corresponding CCAs; Dublin North, Dublin North West, Dublin North Central
• Tallaght South is the only LEA within Dublin where cases have continued to climb in November
Restriction analysis:
• Cases in Dublin took longer to decline after Level 3, indicating Level 5 was needed here to control cases
• Not opening the wet pubs does appear to have helped Dublin with the subsequent increase in cases being slower
                                                                                                                                           Source: Based on daily cumulative case data published on GeoHive to 17 November 2020. This data is published daily.
  than the national average
Employment summary:
• At peak, Dublin had c.40% of workers on either PUP or TWSS (c. 270k) (EY 2019 employment estimates). Current
  PUP levels are at 114k (17 Nov) , compared to a peak of 176k in May (CSO, DSP)
Notes
The restriction impact is based on disease incidence combined with the dates the restrictions are imposed. It is not a
measure of compliance or does not take behavioural aspects into consideration

                                                                                                                                          Source: Based on weekly OpenHive data to 16 November 2020, Government Open Data initiative. This data is published weekly.

                                                                                         Data analytics briefing - 25 November 2020 - DRAFT - Not for circulation
Cases in Limerick during Sept and Oct were driven by very large extended family and community
  outbreaks
Limerick profile:
     Summary findings:
• Limerick has experienced a higher 14 day disease incidence rate per 100k during second wave than the national
  average.
• This is a result of the cases in Limerick not declining to the same extend in the rest of the country
Summary analysis:
• Two southernmost LEAs were hardest hit at different points; Adare-Rathkeale during October, then Newcastle West
  in November.
• Limerick City East was the worst performing area within Limerick City, and within the county on 2nd November
• No region performs notably better than others – the remaining LEAs each exceed an incidence rate of 200 cases
  per 100k population
Employment summary:
• Limerick had c.43% of its workforce on PUP or TWSS (c.34k) at the peak in early
                                                                                                                                           Source: Based on daily cumulative case data published on GeoHive to 17 November 2020. This data is published daily.
  May (EY 2019 employment estimates). There are currently 14k on PUP (17 Nov) which is down from 22k in May
  (CSO, DSP)

Notes
The restriction impact is based on disease incidence combined with the dates the restrictions are imposed. It is not a
measure of compliance or does not take behavioural aspects into consideration

                                                                                                                                          Source: Based on weekly OpenHive data to 16 November 2020, Government Open Data initiative. This data is published weekly.

                                                                                            Data analytics briefing - 25 November 2020 - DRAFT - Not for circulation
Kerry is seeing lower cases than the national average, with Listowel bordering Limerick having the
  highest number of recent cases
Kerry profile:
     Summary findings:
• Kerry has experienced a similar 14 day disease incidence rate per 100k during second wave to the national
  average. However, Listowel LEA has seen a sharp increase in its rate since early October
Summary analysis:
• North Kerry (Listowel) is most severely affected. This coincides with increased rates in southern parts of
  Limerick such as Newcastle West and Adare-Rathkeale, as well as Limerick city
• Killarney and Tralee LEAs are both next in terms of severity of impact, containing two major Kerry towns
• The remainder of the county (further south, smaller towns) is generally less affected
• Listowel's incidence levels were three times higher than the next worst-afflicted LEA. Note the small population
  of ~29,000 people meant 182 cases over a 2-week period prior to 26 Oct created a very high incidence rate
Restriction impact:
• The number of cases in Kerry started to grow around the time level 3 was introduced – two weeks later, this high
  growth rate had largely ceased
• Improvements have levelled off somewhat across LEAs such as Tralee, Killarney and Listowel                                       Source: Based on daily cumulative case data published on GeoHive to 17 November 2020. This data is published daily.
Employment summary:
• Kerry had c.49% of its workforce on PUP or TWSS (c.32k) at the peak in early May (EY
  2019 employment estimates). There are currently 14k on PUP (17 Nov) which is down from 22k in May (CSO,
  DSP)

Notes
The restriction impact is based on disease incidence combined with the dates the restrictions are imposed. It is not
a measure of compliance or does not take behavioural aspects into consideration

                                                                                                                                        Source: Based on weekly OpenHive data to 16 November 2020, Government Open Data initiative. This data is published weekly.

                                                                                          Data analytics briefing - 25 November 2020 - DRAFT - Not for circulation
Restrictions impact
analysis
We have been looking to quantify restrictions in three ways

               Ireland restriction analysis
               A detailed analysis of restriction measures and impacts on incidence rates across the 26 counties – highlighting the most and least effective restrictions
               based on changes to incidence rates over an extended period. Expanded to include university opening and NI restrictions for border counties and presented
               today

               International restriction analysis
               A detailed analysis of restriction measures and impacts across EU peer countries to quantify the impact of restrictions post-implementation. Currently
               completing detailed analysis for initial 10 EU countries

               International desktop research
               Desktop research was undertaken looking at the impacts of restrictions across the world, leveraging peer research to understand risk of certain settings and
               restrictions. Key points summarized in regular COVID-19 insights publication and with new research included today

                                                       Data analytics briefing - 25 November 2020 - DRAFT - Not for circulation
Ireland – restrictions analysis

                                  Data analytics briefing - 25 November 2020 - DRAFT - Not for circulation
Wet Pubs opened across the country, but not Dublin, on 21 September. The increase in Dublin’s incidence rate was
                         then lower than the national average and for larger counties
                         Wet pubs opened in all counties except Dublin in late September. This coincided with universities opening together with specific sporting events.
                         The 14 day disease incidence rate per 100k started to increase ten days later in every county. The subsequent incidence rate growth in Dublin was
                         33% lower than the national average and 79% to 82% lower than other counties with larger cities. Wicklow was the only county that performed
                         better than Dublin, with a 10% lower growth rate than Dublin.

                                        14

                                        12
Daily Change in 14 day Incidence rate

 (Impact measured from 1 to 16 Oct)
  per 100k after Wet Pubs Opening

                                        10

                                        8

                                        6

                                        4

                                        2

                                        0
                                             National           Cork                      Galway                                  Limerick                Dublin   Wicklow
                                                                               Data analytics briefing - 25 November 2020 - DRAFT - Not for circulation
The incidence rate did not materially increase after the three phases of re-opening during late May
 to early July
 The reopening of construction, non-essential retail and the wider Phase 3 openings did not appear to have a material impact on the cases nationally
 or in larger counties. Note that disease incidence rates were low at this time
             Restriction Effective Date     29/02/2020   12/03/2020   15/03/2020   24/03/2020   27/03/2020   01/05/2020   15/05/2020   28/05/2020   08/06/2020   29/06/2020   13/07/2020   21/07/2020   08/08/2020   19/08/2020   21/08/2020   31/08/2020   19/09/2020   21/09/2020   26/09/2020   07/10/2020         16/10/2020         22/10/2020

           Restriction Estimated Start of
                                            10/03/2020   22/03/2020   25/03/2020   03/04/2020   06/04/2020   11/05/2020   25/05/2020   07/06/2020   18/06/2020   09/07/2020   23/07/2020   31/07/2020   18/08/2020   29/08/2020   31/08/2020   10/09/2020   29/09/2020   01/10/2020   06/10/2020   17/10/2020         26/10/2020         01/11/2020
                       Impact
                                                                                                                                                                                               Lockdown
                                                Childcare                                      Stay at                                                                                                                                                                   Wet Bars                                       Level 4
                                                                         Retail,    Stay at                                                    Face masks             Lockdown                  lifted for Schools +                                                                                                              Level 5
          Avg daily change in 14 day   No        closed,                                        home Constructio Mandatory Phase 2    Phase 3                                      Face masks                                                                Level 3     Opened       Level 3      Level 3 Level 3 Max Donegal,
                                                          Bars closed restaurants home order                                                    on public Green List Laois, Offaly            Laois, Offaly, childcare                                                                                                          National (to
           incidence rate per 100k restrictions School                                       increased n Opened    PLF     reopening reopening                                      in shops                                                                 Dublin       except      Donegal      National National    Cavan,
                                                                       etc closed   (2km)                                                       transport              Kildare                extended for opened                                                                                                                22 Nov)
                                                 Closed                                        to 5km                                                                                                                                                                     Dublin                                       Monaghan
                                                                                                                                                                                                 Kildare
                     Carlow                     0            0            1           -2            2            -5            1          -2           -1            0           0             2                        -4                         1                         5                        17        -7                           -9
                     Cavan                      0            0            8           18            0            -6           -3          -3           0             0           0             0                         0                         3                        43                        17                           -62      -21
                      Clare                     1            4            3            0            1            -4            2          -4           0             0           2             0                         0                         2                        15                        -5        -4                           -6
                       Cork                     2            2            3           -3           -1             1           -2          -1           0             0           0             0                         0                         4                        10                        7         -5                           -9
                    Donegal                     0            0            5            5           -2            -1            0           0           0             0           0             1                         0                         9                        12            1                                        0         -4
                     Dublin                     3            6           11            1           -2            -4           -3          -1           0             0           0             1                         2                        4             4                                                -6                          -5
                     Galway                     1            1           2            -2            0             0           -1          -1           0             0           0             0                         1                        3                         11                        12        -15                         -10
                      Kerry                     1            5           3             4           -1             0            0           0           0             0           0             0                         1                        0                         11                         9        -10                          -6
                     Kildare                    1            2           5             3           0             -4           -1           0           0             0           3             9           -7           -5           -2           1                          8                         7         -9                          -7
                    Kilkenny                    1            1           4            -3           -1             0           -3           0           0             0           0             1                         0                        0                          6                         3         -7                          -2
                      Laois                     1            0           1             0           0             -2           0            0           0             0           2             2           -2           -2            0           1                          7                         8         -7                          -7
                     Leitrim                    1            0           3             2           0             -1           -1          0            1            -1           0             0                        4                         -1                        12                         0        -17                          -1
                    Limerick                    1            1           5            -1           -1            -2           -1          0            0            0            1             1                        2                         -1                        12                         7         -5                          -3
                   Longford                     1            1           3             4           7            -20           -1          -1           0            0            0             0                        2                         2                          6                         5         -8                          -6
                      Louth                     1            1           3             1           0             -3           0           -1           0            0            0             1                        1                         2                          7                        12         -2                          -4
                      Mayo                      0            1           4            10           -1            -2           -2          0            0            0            0             0                        0                         1                          7                        12         -3                          -7
                     Meath                      1            2           3             8           0             -3           -1          0            0            0            0             0                        1                         2                         24                        19        -34                         -15
                   Monaghan                     0            0           3            17           0             -2           -2          -3           0            0            0             1                        1                         7                         11                        -3                           -12       -7
                     Offaly                     1            1           6            -2           2             2           -12          0            0            0            0             7           -9           -1            2           1                         6                         2         -10                          -2
                  Roscommon                     0            1           1            2            6            -14           0           -2           0            0            0             1                        0                         5                         4                         4         -10                          -3
                      Sligo                     1            0           3            -4           0             -2           0           0            2            -2           0             0                        0                         1                         17                        16        -14                         -12
                   Tipperary                    1            1            5           -1            1            -5            0          -1           0             0           0             3                        -4                         0                         4                         3         0                           -2
                   Waterford                    1            3            2           -3           -1             0            0           0           0             0           0             1                         1                         1                         6                         9         -4                          -2
                  Westmeath                     2            3            7            2            3           -13           -1          -1           0             0           0             0                         1                         1                        12                        18        -15                         -13
                    Wexford                     0            0            1           -1            0            -1            0           0           0             0           0             1                         0                         0                        13                         3        -16                          -6
                    Wicklow                     1            5            5            3           -1            -3           -1           0           0             0           -1            1                         1                         1                         2                         3         -5                          -1
* Phase 3 re-opening included places of worship, gyms, cinemas, theatres, leisure facilities, personal services, sports, public transport 50% capacity & face coverings), mass gatherings (50 indoors, 200 outdoors),
adult education and community facilities, health and well being related services, restaurants and cafes (on site food service), hotels and other accommodation facilities, driving schools and tests
                                                                                                                                        Data analytics briefing - 25 November 2020 - DRAFT - Not for circulation
Select International Desktop
 Research

Data analytics briefing - 25 November 2020 - DRAFT - Not for circulation
Canadian Thanksgiving: Testing & Tracing data and case numbers show an increase in confirmed
cases post Canadian Thanksgiving on 12 October

Background                                                                                                                                                        Key findings:
Canadian Thanksgiving took place on 12 October 2020. While Prime Minister Justin Trudeau                                                                          •     Canada saw an increase in COVID-19 cases in the days and weeks that followed
made an informal request for Canadians to cancel gatherings to focus on ‘having a shot at                                                                               Thanksgiving, the highest rates since the first wave in the spring
Christmas’, post Thanksgiving saw an increase in cases with the highest rates since the first
wave in Spring.                                                                                                                                                   •     On October 12, the day Canada celebrated Thanksgiving, the country had recorded almost
                                                                                                                                                                        183k total cases, according to data from the Canadian Government

                                                                                                                                                                  •     The number of total cases, which was already increasing, continued to climb; 4,109 new
                                                                                                                                                                        daily cases were recorded exactly two weeks later on 26 October. At this point, Canada's
                                                                                                                                                                        total number of cases had risen to around 220k

                                                                                                              10 days later
                                                                                       Thanksgiving 12 Oct
                                                                       10 days later

                                                                                                                                                                        Canadian Testing and Tracing records show that Thanksgiving gatherings directly resulted in
                                                   Labour Day 7 Sept

                                                                                                                                                                  •
                                                                                                                                                                        the increase in incidence rates

                                                                                                                                                                  •     "Cases were indeed increasing already, but we definitely saw an increase in the rate of
                                                                                                                                                                        transmission after Thanksgiving.” The percentage increase in cases increased after
                                                                                                                                                                        Thanksgiving, with a 14% increase in positive cases between 12 and 22 October

                                                                                                                                                                  •     Total number of positive cases has doubled from 155,000 on 28 September to over
                                                                                                                                                                        310,000 on 18th November

                                                                                                                                                                  •     A similar increase is noticed on 17th September, 10 days after Canadian Labour day was
                                                                                                                                                                        celebrated

   Source: https://health-infobase.canada.ca/covid-19/
   https://www.thestar.com/news/canada/2020/09/23/wont-be-gathering-for-                                     Data analytics briefing - 25 November 2020 - DRAFT - Not for circulation
   thanksgiving-trudeau-says-covid-19-second-wave-underway.html
US research: Full-service restaurants, fitness centres and religious organisations generating
     highest risk of infection
       Approach                                                                                                                                                                                      Key findings
                                                                                                                                                                                                     •   The model calculates the additional cases that would occur if each location is opened,
       Stanford University analysis of potential spread of C-19 in the 10 largest US metropolitan areas, using
                                                                                                                                                                                                         using the COVID_19 Mobility Modelling Simulation over time (between 1st March and
       hourly mobility data across different points of interest (restaurants, gyms, stores etc.)
                                                                                                                                                                                                         10th May) and the associated positivity rate of the population who visit the location.
       Calculates potential visits and infections over two months generated by the
       re-opening of certain locations.                                                                                                                                                              •   Small fraction of POIs accounted for majority of infections at POIs, e.g. 10% of POIs in
                                                                                                                                                                                                         Chicago accounted for 85% of infections at POIs and almost 60% of all cases. These
                                                                                                                                                                                                         riskier places come from multiple categories, but tend to have higher densities of
                                                                                                                                                                                                         visitors, and visitors who stay longer. Model predicts POIs are 70% of all infections.
     POI categories ranked in decreasing order of associated additional infections that would
     occur if the location is opened                                                                                                                                                                 •   Restricting maximum occupancy at certain locations can be an effective alternative to
                                                                                                                                                                                                         closure
                          Full-service restaurants                     Results
                                                                       •       The Stanford Mobility Network Model Simulation concluded                                                              •   Higher infection rates among disadvantaged racial and socioeconomic groups solely
                                Fitness centres                                                                                                                                                          from differences in mobility. This aligns to Irish data where a higher proportion of C-19
                                                                               that on average across metro areas, reopening full-service
                                                                               restaurants, fitness centres and religious organisations                                                                  cases have been attributed to disadvantaged areas (40% of cases versus 37% of
                          Religious organisations                                                                                                                                                        population) (CSO, cases to 30/10).
                                                                               produces the largest predicted increase in infections.
                            Take-out restaurants                                                                                                                                                     •   As seen in the Mobility Model, religious organisations led to high levels of cases in the
                                                                       •       Take-out restaurants, grocery stores, department stores and
                                                                               pharmacies resulted in low positivity rates.                                                                              US cities studied. However, it is important to note that the median church in the U.S.
                                 Grocery stores                                                                                                                                                          has 75 regular participants in worship on Sunday mornings. All but five states have
                                                                       •       This pattern was seen in the 3 US cities studied.                                                                         congregations with more than 2,000 people in attendance on a Sunday morning. As of
                              Department stores                                                                                                                                                          2012, there were roughly 1,600 Protestant churches in the United States with a
                                                                                                                                                                                                         weekly attendance of 2,000 people or more.
                                   Pharmacies

Source: Mobility network models of COVID-19 explain inequities and inform reopening, Published November 2020, Stanford University: COVID-19 Mobility Network Modeling,
http://covid-mobility.stanford.edu/
http://hirr.hartsem.edu/research/fastfacts/fast_facts.html

                                                                                                                          Data analytics briefing - 25 November 2020 - DRAFT - Not for circulation
Disclaimer

  •   In carrying out our work and preparing our presentation, we have worked solely on the instructions of The Department of An Taoiseach and for The Department of An Taoiseach
      purposes. It should not be provided to any third party without our prior written consent. Our presentation may not have considered issues relevant to any third parties, any use such third
      parties may choose to make of our presentation is entirely at their own risk and we shall have no responsibility whatsoever in relation to any such use

  •   You have asked us to report to you in a presentation format, which is inevitably briefer than a full written report. Consequently, there will be some information which may have been of
      interest to you which will not be provided to you, and you accept that we will be using our judgement when determining the content of the presentation

  •   The information in this presentation pack will have been supplemented by matters arising from any oral presentation by us, and should be considered in the light of this additional
      information

                                                                  Data analytics briefing - 25 November 2020 - DRAFT - Not for circulation
EY | Assurance | Tax | Strategy and Transactions |
Consulting
About EY
EY is a global leader in assurance, tax, strategy, transaction and consulting services.
The insights and quality services we deliver help build trust and confidence in the
capital markets and in economies the world over. We develop outstanding leaders who
team to deliver on our promises to all of our stakeholders. In so doing, we play a critical
role in building a better working world for our people, for our clients and for our
communities.
EY refers to the global organization, and may refer to one or more, of the member firms
of Ernst & Young Global Limited, each of which is a separate legal entity. Ernst & Young
Global Limited, a UK company limited by guarantee, does not provide services to
clients. Information about how EY collects and uses personal data and a description of
the rights individuals have under data protection legislation are available via
ey.com/privacy. For more information about our organization, please visit ey.com.
© 2020 Ernst & Young. Published in Ireland. All Rights Reserved.
The Irish firm Ernst & Young is a member practice of Ernst & Young Global Limited. It is
authorised by the Institute of Chartered Accountants in Ireland to carry on investment
business in the Republic of Ireland.
Ernst & Young, Harcourt Centre, Harcourt Street, Dublin 2, Ireland.
Information in this publication is intended to provide only a general outline of the
subjects covered. It should neither be regarded as comprehensive nor sufficient for
making decisions, nor should it be used in place of professional advice. Ernst & Young
accepts no responsibility for any loss arising from any action taken or not taken by
anyone using this material.

ey.com
You can also read