Assessment of the Impact of Media Coverage on COVID-19-Related Google Trends Data: Infodemiology Study
←
→
Page content transcription
If your browser does not render page correctly, please read the page content below
JOURNAL OF MEDICAL INTERNET RESEARCH                                                                                                 Sousa-Pinto et al

     Original Paper

     Assessment of the Impact of Media Coverage on
     COVID-19–Related Google Trends Data: Infodemiology Study

     Bernardo Sousa-Pinto1,2, MD, PhD; Aram Anto3, MSc; Wienia Czarlewski3,4, MD, PhD; Josep M Anto5,6,7, MD, PhD;
     João Almeida Fonseca1,2, MD, PhD; Jean Bousquet8,9,10, MD, PhD
     1
      Department of Community Medicine, Information and Health Decision Sciences, Faculty of Medicine, University of Porto, Porto, Portugal
     2
      Center for Health Technology and Services Research, University of Porto, Porto, Portugal
     3
      MASK-air, Montpellier, France
     4
      Medical Consulting Czarlewski, Levallois, France
     5
      Centre for Research in Environmental Epidemiology, Barcelona Institute for Global Health, Barcelona, Spain
     6
      Universitat Pompeu Fabra, Barcelona, Spain
     7
      CIBER Epidemiología y Salud Pública, Barcelona, Spain
     8
      Charité, Universitätsmedizin Berlin, Humboldt-Universität zu Berlin, Berlin, Germany
     9
      Comprehensive Allergy Center, Department of Dermatology and Allergy, Berlin Institute of Health, Berlin, Germany
     10
          MACVIA-France, Montpellier, France

     Corresponding Author:
     Bernardo Sousa-Pinto, MD, PhD
     Department of Community Medicine, Information and Health Decision Sciences
     Faculty of Medicine
     University of Porto
     Rua Plácido Costa s/n
     Porto, 4400
     Portugal
     Phone: 351 912362153
     Email: bernardosousapinto@protonmail.com

     Abstract
     Background: The influence of media coverage on web-based searches may hinder the role of Google Trends (GT) in monitoring
     coronavirus disease (COVID-19).
     Objective: The aim of this study was to assess whether COVID-19–related GT data, particularly those related to ageusia and
     anosmia, were primarily related to media coverage or to epidemic trends.
     Methods: We retrieved GT query data for searches on coronavirus, cough, anosmia, and ageusia and plotted them over a period
     of 5 years. In addition, we analyzed the trends of those queries for 17 countries throughout the year 2020 with a particular focus
     on the rises and peaks of the searches. For anosmia and ageusia, we assessed whether the respective GT data correlated with
     COVID-19 cases and deaths both throughout 2020 and specifically before March 16, 2020 (ie, the date when the media started
     reporting that these symptoms can be associated with COVID-19).
     Results: Over the last five years, peaks for coronavirus searches in GT were only observed during the winter of 2020. Rises
     and peaks in coronavirus searches appeared at similar times in the 17 different assessed countries irrespective of their epidemic
     situations. In 15 of these countries, rises in anosmia and ageusia searches occurred in the same week or 1 week after they were
     identified in the media as symptoms of COVID-19. When data prior to March 16, 2020 were analyzed, anosmia and ageusia GT
     data were found to have variable correlations with COVID-19 cases and deaths in the different countries.
     Conclusions: Our results indicate that COVID-19–related GT data are more closely related to media coverage than to epidemic
     trends.

     (J Med Internet Res 2020;22(8):e19611) doi: 10.2196/19611

     https://www.jmir.org/2020/8/e19611                                                                   J Med Internet Res 2020 | vol. 22 | iss. 8 | e19611 | p. 1
                                                                                                                        (page number not for citation purposes)
XSL• FO
RenderX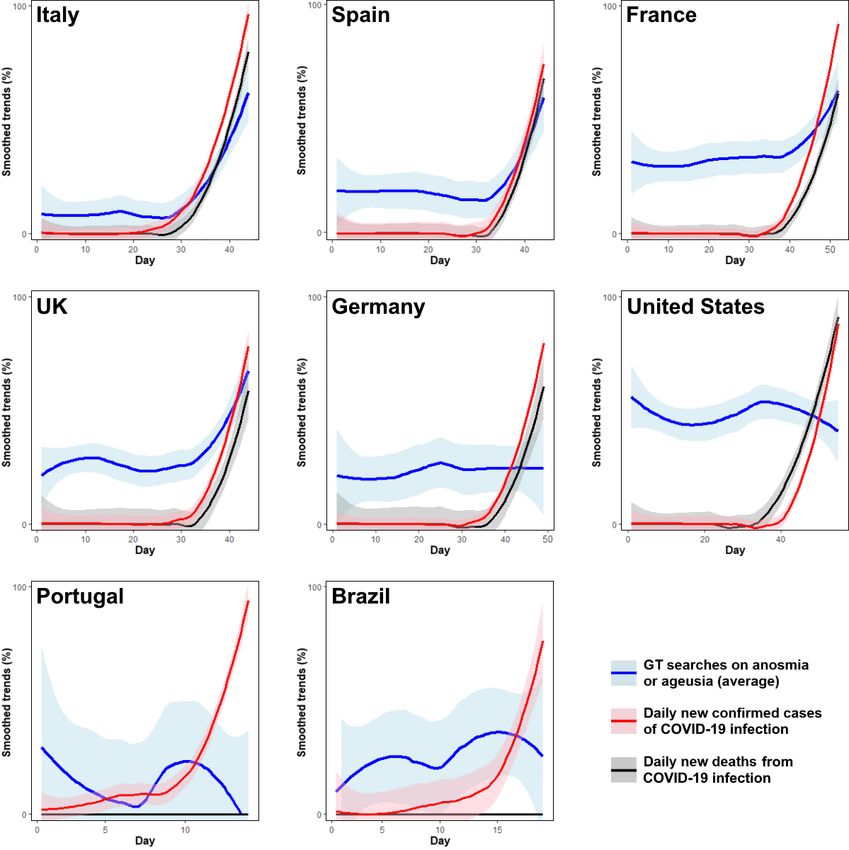
JOURNAL OF MEDICAL INTERNET RESEARCH                                                                                          Sousa-Pinto et al

     KEYWORDS
     COVID-19; infodemiology; infodemic; Google Trends; media coverage; media; coronavirus; symptom; monitoring; trend;
     pandemic

                                                                           countries [15], the role of media coverage in motivating
     Introduction                                                          smell-related searches cannot be disregarded.
     Infodemiology is defined as “the science of distribution and          Therefore, we aimed to assess whether searches for the terms
     determinants of information in an electronic medium,                  anosmia and ageusia were primarily related to media releases
     specifically the Internet, or in a population, with the ultimate      or to COVID-19 epidemic trends.
     aim to inform public health and public policy” [1,2]. This field
     comprises both “supply-based” and “demand-based”                      Methods
     infodemiology, with the latter assessing individuals’
     health-seeking behavior (eg, through online searches) [2]. Over       This is a GT-based infodemiology study that complies with the
     the years, infodemiological studies have become increasingly          methodological framework described by Mavragani and Ochoa
     popular, focusing on different fields such as chronic diseases,       [16].
     risk behaviors, and infectious diseases [3,4]. Regarding the
     latter, the use of search query data to predict or monitor
                                                                           Keyword Selection
     infectious outbreaks can be traced to back to the 2002 severe         In this study, we retrieved GT data on the keywords coronavirus
     acute respiratory syndrome (SARS) epidemic [5]. Subsequent            (as a virus and search term), cough (as a topic), anosmia (as a
     studies have been conducted on influenza and other infectious         disease), and ageusia (as a topic).
     diseases. Google Trends (GT) is one of the most commonly              With the exception of coronavirus, no other nontopic or
     used data sources, albeit with mixed results. In fact, despite the    nondisease search terms were used. In fact, we tested the search
     initial optimism regarding the use of GT for influenza prediction     terms loss of smell, hyposmia, olfaction, dysgeusia, and loss of
     (Google Flu Trends) [6] and despite the strong correlation of         taste [8] using translations of the terms into native languages
     data with influenza-related emergency department visits [7],          of the studied countries (using double quotation marks when
     the unsatisfactory performance of Google Flu Trends led to its        searching for keywords containing more than one word);
     discontinuation [8].                                                  however, the data retrieved with these queries were not
     In the context of the coronavirus disease (COVID-19) pandemic,        consistent or of sufficient quality.
     there has been interest in GT (or other data on web-based
                                                                           Region and Period Selection
     activity), particularly concerning the potential role of these data
     in defining the proper timing and location for practicing             We obtained country-level GT data for all analyses except for
     appropriate risk communication strategies to affected                 the worldwide analysis of the last five years. We retrieved GT
     populations [9]. In Europe, significant correlations were             data for the following time periods:
     observed between COVID-19 cases and deaths and online                 •   A time frame of the last five years (up to the week of April
     interest on this topic [10]. In addition, GT data were found to           5 to 11, 2020): This time frame allowed us to assess
     predict COVID-19 incidence in Iran [11]. In contrast, as the              worldwide search spikes of selected keywords over a
     number of COVID-19 cases increased, interest in telehealth and            long-term period.
     telemedicine among the US population did not correlate with           •   A time frame comprising the year 2020 (ie, the period
     the proportion of hospitals providing telehealth services [12].           ranging from the week of January 5 to 11 to the week of
     Using GT to obtain information regarding COVID-19, presents               April 5 to 11, 2020): This time frame allowed us to identify
     two difficulties. One is that information demand may be                   the search trends for selected keywords throughout the year
     disproportionate to the epidemiologic on account of media                 2020 in 17 Western countries (where search data for
     coverage (as described in other contexts [5]), and the other is           anosmia were sufficient to perform an analysis). These GT
     the low specificity of the main COVID-19 symptoms. However,               data were plotted (without performing formal correlations)
     regarding the latter, while cough, fever and dyspnea can also             alongside data on COVID-19 cases in different countries.
     occur in several other diseases, some more specific                       Note that for this time frame, we retrieved data starting on
     manifestations of COVID-19 have been described. Two                       January 5 (and not on the date that the first COVID-19 case
     symptoms that appear to be more specific are anosmia and                  was registered in each country), not only to allow
     ageusia [13]. This was not widely known to the general public             between-country comparison but also because in the
     before the publication of an interview with Hendrik Streeck in            Western World, news coverage on SARS-CoV-2 infection
     the German newspaper Frankfurter Allgemeine Zeitung on                    started before the first confirmed cases were identified, and
     March 16, 2020 [14], which was then cited by media worldwide.             also because it is possible that there were COVID-19 cases
     The identification of these more specific symptoms raised                 in the Western World prior to the first identified cases
     interest in whether GT data for these manifestations could better         (which may have been reflected in symptom web searches).
     correlate with COVID-19 incidence and deaths than data for            •   A time frame ranging from the date of the first confirmed
     less specific symptoms. While strong correlations between                 COVID-19 case in each country until March 15: This time
     searches for smell-related information and the number of                  frame allowed a closer analysis of search trends before the
     COVID-19 cases and deaths have been described in several                  media started reporting that anosmia and ageusia can be

     https://www.jmir.org/2020/8/e19611                                                            J Med Internet Res 2020 | vol. 22 | iss. 8 | e19611 | p. 2
                                                                                                                 (page number not for citation purposes)
XSL• FO
RenderX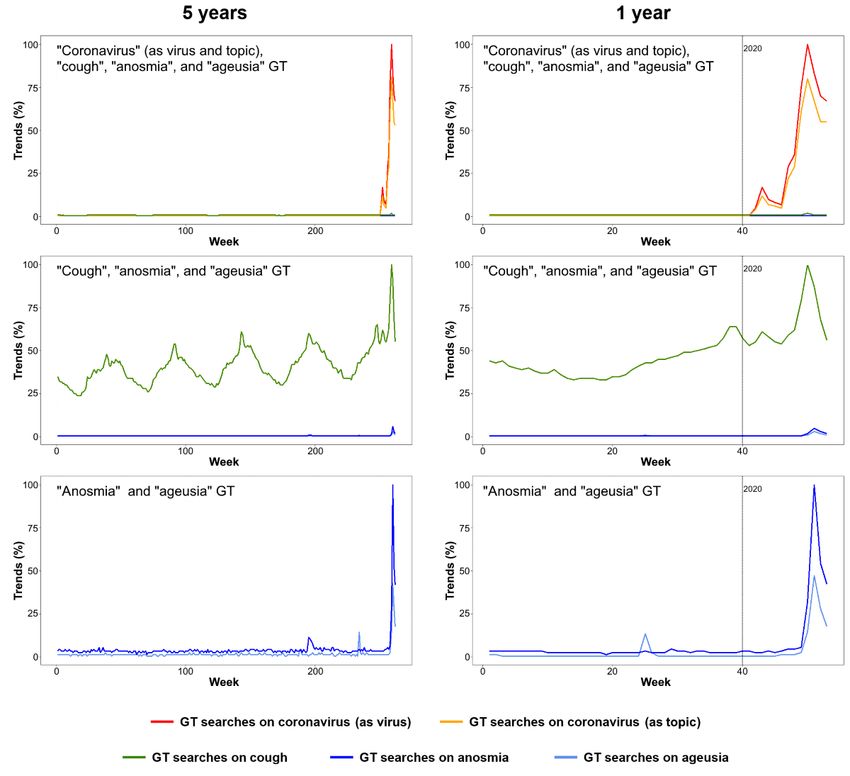
JOURNAL OF MEDICAL INTERNET RESEARCH                                                                                           Sousa-Pinto et al

          symptoms of COVID-19. To assess the impact of this media         average of GT for anosmia and ageusia (herein reported as
          coverage, we analyzed 8 different countries and correlated       anosmia/ageusia) and daily data on new COVID-19 cases.
          web searches with the respective data on COVID-19 cases          Similar analyses were performed for new COVID-19 deaths (in
          for that period. Correlations with the daily number of deaths    the time frame from the date of the first COVID-19 death to
          were also performed (in this case, using a time frame            March 15, 2020).
          ranging from the date of the first death in each country until
                                                                           To facilitate plot reading, we plotted normalized weekly data
          March 15, 2020).
                                                                           on COVID-19 cases and deaths. That is, we plotted the total
     Search Categories                                                     number of new COVID-19 cases and deaths as percentages of
     Categories and subcategories were not selected when searching         the respective maximum weekly values observed during the
     for keywords.                                                         defined time period.

     Data Analysis                                                         Results
     After plotting worldwide GT data on the selected keywords for
     the last five years, we retrieved GT data for the year 2020 and       On a worldwide scale, the GT data for different countries
     assessed the trends of those queries in the 17 countries where        showed peaks appearing at similar times, with higher peaks for
     searches for anosmia were sufficient to perform an analysis.          coronavirus than for other searches (Figure 1). Throughout five
                                                                           years, these peaks were only found in the winter of 2020.
     To further assess the impact of media coverage on                     Queries for coronavirus as a virus and as a search term peaked
     COVID-19–related GT data, and to assess whether the GT data           at the same time. The second highest peaks were for cough,
     correlated with COVID-19 cases, we focused on 8 countries in          with two peaks coinciding with those of coronavirus. Anosmia
     different stages of the COVID-19 pandemic: France, Germany,           and ageusia had slightly delayed identical peaks that were not
     Italy, Portugal, Spain, the United Kingdom, Brazil, and the           identified when the terms cough or coronavirus were searched.
     United States. For each country, we plotted the weekly GT data
     for selected keywords together with weekly data on new                We analyzed search trends in 17 countries where the anosmia
     COVID-19 cases (numbers retrieved from official sources).             peak was clearly identifiable (in 2 of these countries, ageusia
                                                                           did not show any peak, and in 2 others, no peak was observed
     Subsequently, we performed an analysis restricted to the time         for cough). In particular, we started by observing the week when
     period prior to March 16, 2020, the date that the media started       searches for each topic started to rise (Table 1). The first rise
     reporting that anosmia and ageusia can be symptoms of                 in coronavirus searches started in late January 2020, while the
     COVID-19. In fact, from that date onward, GT data could               second peak of coronavirus searches appeared between February
     largely reflect interest in media coverage rather than searches       16 and 22 in one country (Italy) and between February 23 and
     for symptoms that patients were experiencing. Therefore, for          29 in the remaining countries. Cough queries started in the same
     each country, between the date of the first confirmed COVID-19        week in 3 countries, 1 week later in 4 countries, 2 weeks later
     case and March 15, 2020, we assessed the correlation (by means        in 2 countries, and more than 2 weeks later in 6 countries.
     of the Pearson correlation coefficient, r) between the daily

     https://www.jmir.org/2020/8/e19611                                                             J Med Internet Res 2020 | vol. 22 | iss. 8 | e19611 | p. 3
                                                                                                                  (page number not for citation purposes)
XSL• FO
RenderX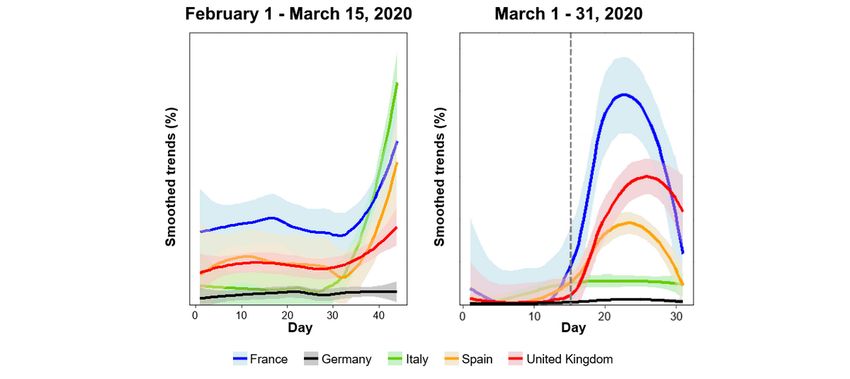
JOURNAL OF MEDICAL INTERNET RESEARCH                                                                                              Sousa-Pinto et al

     Figure 1. Global GT data on coronavirus, cough, anosmia, and ageusia. Data are presented as a percentage of the maximum value and on a weekly
     basis for periods of 5 years and 1 year up to the week of April 5 to 11, 2020. GT: Google Trends.

     https://www.jmir.org/2020/8/e19611                                                                J Med Internet Res 2020 | vol. 22 | iss. 8 | e19611 | p. 4
                                                                                                                     (page number not for citation purposes)
XSL• FO
RenderX
JOURNAL OF MEDICAL INTERNET RESEARCH Sousa-Pinto et al
Table 1. Weeks of onset of Google Trends peaks for search terms related to COVID-19 in 2020 in 17 countries.
Country GTa peak onset for coronavirus (as a virus)b GT peak onset for GT peak onset for GT peak onset for
anosmia (as a disease) ageusia (as a topic) cough (as a topic)
Peak 1 Peak 2
Argentina January 19 to 25 February 23 to 29 March 22 to 28c N/Ad March 8 to 14
Australia January 19 to 25 February 23 to 29 March 22 to 28e March 15 to 21e February 16 to 22
Belgium January 19 to 25 February 23 to 29 March 15 to 21e March 15 to 21e February 16 to 22
Brazil January 19 to 25 February 23 to 29 March 15 to 21e March 15 to 21e February 16 to 22
Canada January 19 to 25 February 23 to 29 March 15 to 21e March 22 to 28e March 8 to 14
Chile January 19 to 25 February 23 to 29 March 22 to 28c March 22 to 28e February 23 to 29
France January 19 to 25 February 23 to 29 March 15 to 21e March 15 to 21e March 1 to 7
Germany January 19 to 25 February 23 to 29 March 15 to 21e March 15 to 21e February 23 to 29
Italy January 19 to 25 February 16 to 22 March 1 to 7e March 8 to 14e February 23 to 29
Portugal January 19 to 25 February 23 to 29 March 15 to 21e March 15 to 21e March 8 to 14
Russia January 19 to 25 February 23 to 29 March 22 to 28e N/A N/A
Spain January 19 to 25 February 23 to 29 March 15 to 21e March 8 to 14e March 8 to 14
Sweden January 19 to 25 February 23 to 29 March 15 to 21e March 22 to 28e N/A
Switzerland January 19 to 25 February 23 to 29 March 8 to 14e March 15 to 21e March 1 to 7
The Netherlands January 19 to 25 February 23 to 29 March 15 to 21e March 22 to 28e February 23 to 29
United Kingdom January 19 to 25 February 23 to 29 March 15 to 21e March 15 to 21e March 8 to 14
United States January 19 to 25 February 23 to 29 March 22 to 28e March 15 to 21e March 8 to 14
a
GT: Google Trends.
b
Two GT peaks consistently appeared for coronavirus. Peak 1 is a minor peak that appeared by late January 2020, and Peak 2 is the largest Google
Trends peak.
c
GT data peaked in the week of April 5 to 11.
d
Not applicable.
e
GT data peaked in the week of March 15 to 21.
We observed that the onset of anosmia queries occurred from 2020, for all countries except Argentina and Chile (one week
March 15 to 21 in 10 countries (corresponding to the week of after the Streeck interview).
the Hendrik Streeck interview in Frankfurter Allgemeine
Subsequently, we analyzed 8 countries by plotting the average
Zeitung) and from March 22 to 28 in 5 other countries (in Italy
GT data for anosmia and ageusia with the number of COVID-19
and Switzerland, the queries started before the week of March
cases. We observed that the GT peak coincided with the
15 to 21). The weeks of onset for ageusia and anosmia queries
maximum weekly number of new COVID-19 cases in Italy but
were the same in 7/15 countries (47%). The GT peaks for
not in the other countries (Figure 2). For all countries (except
anosmia and ageusia were first observed from March 22 to 28,
Italy and Germany), the GT peaks were followed by sharp
decreases.
https://www.jmir.org/2020/8/e19611 J Med Internet Res 2020 | vol. 22 | iss. 8 | e19611 | p. 5
(page number not for citation purposes)
XSL• FO
RenderXJOURNAL OF MEDICAL INTERNET RESEARCH Sousa-Pinto et al
Figure 2. GT data for coronavirus, cough, anosmia, and ageusia and relative frequency of new COVID-19 infections. Data are presented as a percentage
of the maximum value on a weekly basis, from the week of January 5 to 11, 2020, to the week of April 5 to 11, 2020. *First confirmed COVID-19 case.
**First confirmed death due to COVID-19. ***Hendrik Streeck interview to Frankfurter Allgemeine Zeitung reporting that anosmia and ageusia can
be COVID-19 symptoms. COVID-19: coronavirus disease. GT: Google Trends.
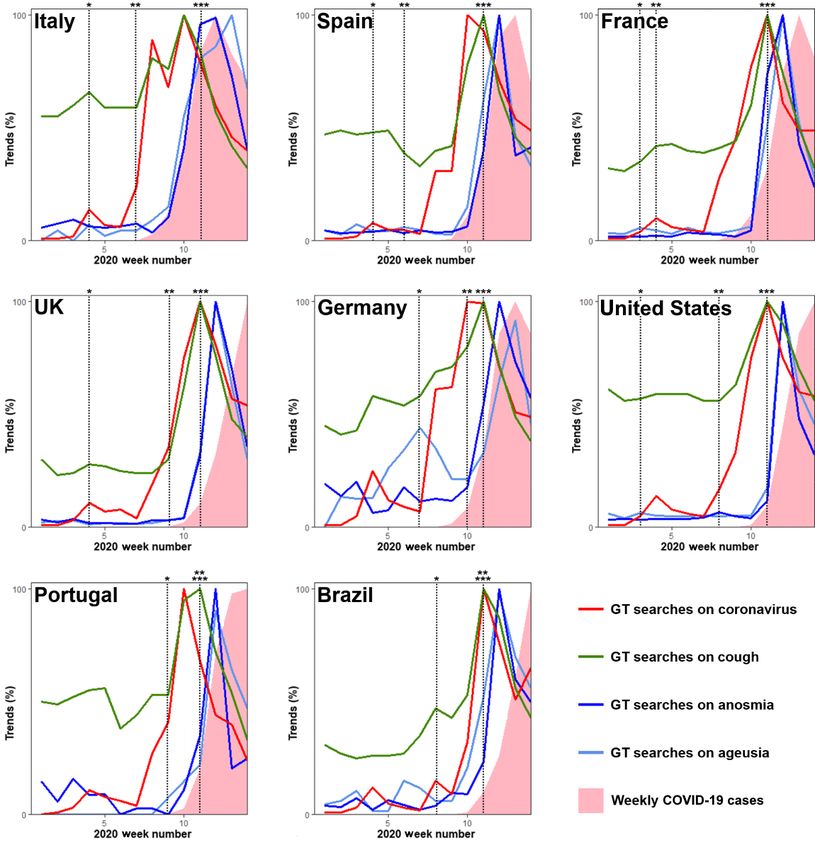
Analyzing the data from the date of first confirmed case of on anosmia/ageusia and new COVID-19 cases (r=0.739) and
COVID-19 until March 16, we observed that in countries with deaths (r=0.668) despite the low COVID-19 infection and death
higher COVID-19 infection or death rates, there were moderate rates (0.3 deaths per million inhabitants).
to good correlations between Google Trends for
These results are supported by between-countries comparisons
anosmia/ageusia and new COVID-19 cases or deaths (Table 2,
(Figure 4). Prior to March 16, Italy was the country with the
Table 3, and Figure 3). By contrast, poor correlations were
largest volume of searches for anosmia/ageusia; however, it
observed in countries with lower COVID-19 rates by March
was surpassed by France, the United Kingdom, and Spain
15. The only exception was the United Kingdom, in which we
following extensive media coverage of those symptoms.
observed strong correlations between Google Trends searches
https://www.jmir.org/2020/8/e19611 J Med Internet Res 2020 | vol. 22 | iss. 8 | e19611 | p. 6
(page number not for citation purposes)
XSL• FO
RenderXJOURNAL OF MEDICAL INTERNET RESEARCH Sousa-Pinto et al
Table 2. Frequency of new COVID-19 cases and deaths in the countries examined in the study. The analysis time frame for new COVID-19 cases was
from the date of the first confirmed COVID-19 case in the respective country until March 15, 2020. The analysis time frame for COVID-19 deaths was
from the date of the first confirmed COVID-19 death in the respective country until March 15, 2020.
Country COVID-19a cases per million inhabitants as of March 15, COVID-19 deaths per million inhabitants as of March 15,
2020 2020
Italy 411.1 30.0
Spain 169.6 6.24
France 80.8 1.89
United Kingdom 20.9 0.32
Germany 58.2 0.14
United States 10.6 0.19
Portugal 23.8 0
Brazil 0.95 0
a
COVID-19: coronavirus disease.
Table 3. Pearson correlation coefficients between Google Trends data on anosmia/ageusia and the frequency of new COVID-19 cases and deaths in
Table 2.
Country Correlations with average GTa searches for Correlations with GT searches for anosmia Correlations with GT searches for ageusia
anosmia (as a disease)/ageusia (as a topic) (as a disease) (as a topic)
COVID- P value COVID-19 P value COVID- P value COVID- P value COVID- P value COVID- P value
19b cases, deaths, r 19 cases, 19 19 cases, 19
r r deaths, r r deaths, r
Italy 0.796JOURNAL OF MEDICAL INTERNET RESEARCH Sousa-Pinto et al
Figure 3. Average GT data for anosmia and ageusia and relative frequency of new COVID-19 infections and deaths. Data are presented as Loess-smoothed
percentages of the maximum value (smoothed trends) on a daily basis from February 1 to March 15, 2020 (before the media publicized that anosmia
and ageusia can be symptoms of COVID-19). Lines were smoothed to display trends more clearly. COVID-19: coronavirus disease. GT: Google Trends.
https://www.jmir.org/2020/8/e19611 J Med Internet Res 2020 | vol. 22 | iss. 8 | e19611 | p. 8
(page number not for citation purposes)
XSL• FO
RenderXJOURNAL OF MEDICAL INTERNET RESEARCH Sousa-Pinto et al
Figure 4. Average GT data for anosmia and ageusia before the media publicized that these terms can be symptoms of COVID-19 (February 1 to March
15, 2020) and in the 2 weeks before and after this media release (marked with a grey dashed line) (March 1 to 31, 2020). Data are presented on a daily
basis as Loess-smoothed percentages of the maximum value and are adjusted for the population.
detected for all years but which also showed a peak coincident
Discussion with the coronavirus peak.
Principal Findings We then assessed countries with an identifiable anosmia peak
The results of this study suggest that COVID-19–related GT in 2020 in the northern and southern hemispheres. Surprisingly,
queries do not necessarily follow the evolution of the epidemic in all countries, peaks for coronavirus, cough, and
and, in particular for anosmia and ageusia, are more closely anosmia/ageusia all occurred simultaneously, irrespective of
related to media coverage. the pandemic stage. A simple interpretation is that this is
unlikely to be associated with COVID-19 incidence. However,
Using a stepwise approach based on 1- and 5-year perspectives, the time of onset differed for coronavirus or cough versus
we showed that search peaks not only for coronavirus but also anosmia or ageusia; the latter coincided with the timing with
for anosmia/ageusia appeared for the first time in 2020; also, which media news covered information on these symptoms
there may be a relationship between the two peaks. This is (Table 4).
different from the cough search term, for which searches were
Table 4. Media coverage on the identification of anosmia and ageusia as COVID-19 symptoms.
Language Date Title of index media news Source
German March 16, 2020 Virologe Hendrik Streeck : “Wir haben neue Symptome entdeckt” Frankfurt Allgemeine
Zeitung [14]
Italian March 17, 2020 Coronavirus, tra i sintomi frequenti la perdita totale di gusto e Corriere de la Serra [17]
olfatto
English (United Kingdom) March 17, 2020 Coronavirus symptoms shock: Scientists discover NEW symptoms Daily Express [18]
including lack of taste
English (United States) March 13, 2020 Coronavirus is most contagious before and during the first week Science News [19]
of symptoms
French March 17, 2020 Coronavirus : toux, fièvre, fatigue... quels sont les symptômes du Le Parisien [20]
Covid-19 ?
Spanish March 18, 2020 El coronavirus neutraliza los sentidos del olfato y el gusto ABC [21]
Portuguese (Brazil) March 18, 2020 Virologista alemão revela novos sintomas do coronavírus Sputnik News [22]
We subsequently studied the peaks for coronavirus, cough, and pollen peaks were observed during the grass pollen season [25].
anosmia/ageusia. The peak for anosmia/ageusia is delayed In fact, one important limitation of demand-based
compared to that for cough, which is a major symptom of infodemiological studies is the difficulty of distinguishing the
COVID-19. The peaks were usually short (1 week), confirming effects of a true biological epidemic from what generates interest
that most of the queries were driven by media coverage. Prior or apprehension in internet users [2,5]. In that sense,
studies have also pointed out that GT data are highly influenced complementing search data with click data has been suggested
by media [23,24]; due to media coverage, aberrant ragweed as a partial solution to overcome this limitation [2].
https://www.jmir.org/2020/8/e19611 J Med Internet Res 2020 | vol. 22 | iss. 8 | e19611 | p. 9
(page number not for citation purposes)
XSL• FO
RenderXJOURNAL OF MEDICAL INTERNET RESEARCH Sousa-Pinto et al
The correlation between anosmia/ageusia and deaths or new COVID-19 was still low in most Western countries; with the
cases of COVID-19 varied substantially among countries. exception of Italy and Spain, the remaining Western countries
Depending on the country, there was a high correlation or no had fewer than 100 confirmed COVID-19 cases per million
correlation at all. Prior to March 16, in countries with higher inhabitants. The possibility of assessing a larger number of
COVID-19 infection or death rates, there were moderate to good countries with higher numbers of COVID-19 cases would have
correlations between queries on anosmia/ageusia and new allowed us to more confidently assess anosmia and ageusia
COVID-19 cases or deaths. This suggests that in the absence search patterns (and their association with COVID-19
of substantial changes in media coverage and in the presence epidemiology) before and after media coverage on those
of a sufficiently high COVID-19 incidence, GT data mostly symptoms.
reflect searches for symptoms patients are experiencing. Thus,
Another important GT limitation concerns the representativeness
the strong correlations found by Walker et al [15] may reflect
of internet users [26]. Internet use is lowest among older
the facts that they analyzed GT data for anosmia/ageusia only
persons, who constitute the age group with the highest
up to March 25, 2020 (ie, up to the week before searches for
COVID-19 morbidity. Finally, GT provides relative rather than
anosmia/ageusia started to decrease); that their analyses on the
absolute numbers, which may limit across-country comparisons.
associations between COVID-19 cases/deaths and premediatic
However, as expected, similar correlation coefficients were
coverage of anosmia GT data were restricted to three countries
obtained when comparing GT data with relative or absolute
(the United Kingdom, Spain, and Italy); and that this premediatic
numbers of COVID-19 cases/deaths.
coverage was considered by the authors to have occurred up to
March 20, 2020 (ie, searches between March 16 and 19 were Conclusions
misclassified because they had already occurred under the At least in the initial stages of the SARS-CoV-2 pandemic,
potential influence of media coverage). COVID-19–related web searches may more closely reflect media
Limitations coverage (and subsequent users’ interest or apprehension) than
epidemiological trends. The use of Google Trends has increased
Our study has some potentially relevant limitations. We used
dramatically in the last decade; whereas in the past, the focus
data at national levels, which may have not captured
had been on surveillance and monitoring, the focus of research
within-country heterogeneity on COVID-19 incidence or GT
has now shifted to forecasting changes [27]. It appears to be
data; different results may have been obtained if the data were
important to link GT with other sources of data to overcome
assessed at a more granulated level. Another relevant limitation
the limitations of using search information alone.
concerns the fact that by March 16, 2020, the incidence of
Conflicts of Interest
None declared.
References
1. Eysenbach G. Infodemiology: The epidemiology of (mis)information. Am J Med 2002 Dec 15;113(9):763-765. [doi:
10.1016/s0002-9343(02)01473-0] [Medline: 12517369]
2. Eysenbach G. Infodemiology and infoveillance: framework for an emerging set of public health informatics methods to
analyze search, communication and publication behavior on the Internet. J Med Internet Res 2009 Mar 27;11(1):e11 [FREE
Full text] [doi: 10.2196/jmir.1157] [Medline: 19329408]
3. Bernardo T, Rajic A, Young I, Robiadek K, Pham M, Funk J. Scoping review on search queries and social media for disease
surveillance: a chronology of innovation. J Med Internet Res 2013 Jul 18;15(7):e147 [FREE Full text] [doi: 10.2196/jmir.2740]
[Medline: 23896182]
4. Mavragani A. Infodemiology and Infoveillancecoping Review. J Med Internet Res; 2020 ;22(4):e16206.
5. Eysenbach G. SARS and population health technology. J Med Internet Res 2003 Jun 30;5(2):e14 [FREE Full text] [doi:
10.2196/jmir.5.2.e14] [Medline: 12857670]
6. Ginsberg J, Mohebbi MH, Patel RS, Brammer L, Smolinski MS, Brilliant L. Detecting influenza epidemics using search
engine query data. Nature 2009 Feb 19;457(7232):1012-1014. [doi: 10.1038/nature07634] [Medline: 19020500]
7. Klembczyk JJ, Jalalpour M, Levin S, Washington RE, Pines JM, Rothman RE. Google Flu Trends Spatial Variability
Validated Against Emergency Department Influenza-Related Visits. J Med Internet Res 2016;18(6):e175. [Medline:
27354313]
8. Butler D. When Google got flu wrong. Nature 2013;494(7436):155-156.
9. Husnayain A, Fuad A, Su E. Applications of Google Search Trends for risk communication in infectious disease management:
A case study of the COVID-19 outbreak in Taiwan. Int J Infect Dis 2020 Mar 12;95:221-223 [FREE Full text] [doi:
10.1016/j.ijid.2020.03.021] [Medline: 32173572]
10. Mavragani A. Tracking COVID-19 in Europe: Infodemiology Approach. JMIR Public Health Surveill 2020 Apr
20;6(2):e18941 [FREE Full text] [doi: 10.2196/18941] [Medline: 32250957]
https://www.jmir.org/2020/8/e19611 J Med Internet Res 2020 | vol. 22 | iss. 8 | e19611 | p. 10
(page number not for citation purposes)
XSL• FO
RenderXJOURNAL OF MEDICAL INTERNET RESEARCH Sousa-Pinto et al
11. Ayyoubzadeh S, Ayyoubzadeh S, Zahedi H, Ahmadi M, R Niakan Kalhori S. Predicting COVID-19 Incidence Through
Analysis of Google Trends Data in Iran: Data Mining and Deep Learning Pilot Study. JMIR Public Health Surveill 2020
Apr 14;6(2):e18828 [FREE Full text] [doi: 10.2196/18828] [Medline: 32234709]
12. Hong Y, Lawrence J, Williams DJ, Mainous IA. Population-Level Interest and Telehealth Capacity of US Hospitals in
Response to COVID-19: Cross-Sectional Analysis of Google Search and National Hospital Survey Data. JMIR Public
Health Surveill 2020 Apr 07;6(2):e18961 [FREE Full text] [doi: 10.2196/18961] [Medline: 32250963]
13. Lechien JR, Chiesa-Estomba CM, De Siati DR, Horoi M, Le Bon SD, Rodriguez A, et al. Olfactory and gustatory dysfunctions
as a clinical presentation of mild-to-moderate forms of the coronavirus disease (COVID-19): a multicenter European study.
Eur Arch Otorhinolaryngol 2020 Apr 06:1-11 [FREE Full text] [doi: 10.1007/s00405-020-05965-1] [Medline: 32253535]
14. Schmitt P. Frankfurter Allgemeine Zeitung. 2020 Mar 16. „Wir haben neue Symptome entdeckt“ URL: https://www.faz.net/
aktuell/gesellschaft/gesundheit/coronavirus/neue-corona-symptome-entdeckt-virologe-hendrik-streeck-zum-virus-16681450/
hendrik-streeck-leitet-das-16681500.html [accessed 2020-06-12]
15. Walker A, Hopkins C, Surda P. The use of google trends to investigate the loss of smell related searches during COVID-19
outbreak. Int Forum Allergy Rhinol 2020 Apr 11:Preprint [FREE Full text] [doi: 10.1002/alr.22580] [Medline: 32279437]
16. Mavragani A, Ochoa G. Google Trends in Infodemiology and Infoveillance: Methodology Framework. JMIR Public Health
Surveill 2019 May 29;5(2):e13439 [FREE Full text] [doi: 10.2196/13439] [Medline: 31144671]
17. Cuppini L, Orlando S. Corriere de la Serra. 2020 Mar 17. Coronavirus, tra i sintomi frequenti la perdita totale di gusto e
olfatto URL: https://www.corriere.it/salute/malattie_infettive/20_marzo_17/
coronavirus-sintomi-frequenti-perdita-gusto-olfatto-6d3b0932-6836-11ea-9725-c592292e4a85.shtml?refresh_ce-cp [accessed
2020-06-12]
18. Mowat L. Daily Express. 2020 Mar 17. Coronavirus symptoms shock: Scientists discover NEW symptoms including lack
of taste URL: https://www.express.co.uk/news/world/1256433/
coronavirus-symptoms-latest-uk-covid-19-coronavirus-taste-smell [accessed 2020-06-12]
19. Saey TH. Science News. 2020 Mar 13. Coronavirus is most contagious before and during the first week of symptoms URL:
https://www.sciencenews.org/article/coronavirus-most-contagious-before-during-first-week-symptoms [accessed 2020-06-12]
20. Gallet L. Le Parisien. 2020 Mar 17. Coronavirus : toux, fièvre, fatigue... quels sont les symptômes du Covid-19 ? URL:
https://www.leparisien.fr/societe/coronavirus-quels-sont-les-symptomes-du-covid-19-17-03-2020-8282199.php [accessed
2020-06-12]
21. Sánchez R. ABC. 2020 Mar 18. El coronavirus neutraliza los sentidos del olfato y el gusto URL: https://www.abc.es/
sociedad/abci-coronavirus-neutraliza-sentidos-olfato-y-gusto-202003180214_noticia.html [accessed 2020-03-12]
22. Sputnik News. 2020 Mar 18. Virologista alemão revela novos sintomas do coronavírus URL: https://br.sputniknews.com/
ciencia_tecnologia/2020031815343670-virologista-alemao-revela-novos-sintomas-do-coronavirus/ [accessed 2020-06-12]
23. Hamaoui-Laguel L, Vautard R, Liu L, Solmon F, Viovy N, Khvorostyanov D, et al. Effects of climate change and seed
dispersal on airborne ragweed pollen loads in Europe. Nature Clim Change 2015 May 25;5(8):766-771. [doi:
10.1038/nclimate2652]
24. Pandey A, Abdullah K, Drazner MH. Impact of Vice President Cheney on public interest in left ventricular assist devices
and heart transplantation. Am J Cardiol 2014 May 01;113(9):1529-1531. [doi: 10.1016/j.amjcard.2014.02.007] [Medline:
24630787]
25. Bousquet J, Agache I, Berger U, Bergmann K, Besancenot J, Bousquet P, et al. Differences in Reporting the Ragweed
Pollen Season Using Google Trends across 15 Countries. Int Arch Allergy Immunol 2018 May 9;176(3-4):181-188 [FREE
Full text] [doi: 10.1159/000488391] [Medline: 29742519]
26. Eysenbach G. Infodemiology and infoveillance tracking online health information and cyberbehavior for public health.
Am J Prev Med 2011 May;40(5 Suppl 2):S154-S158. [doi: 10.1016/j.amepre.2011.02.006] [Medline: 21521589]
27. Jun S, Yoo HS, Choi S. Ten years of research change using Google Trends: From the perspective of big data utilizations
and applications. Technol Forecast Soc Change 2018 May;130:69-87. [doi: 10.1016/j.techfore.2017.11.009]
Abbreviations
COVID-19: coronavirus disease
GT: Google Trends
SARS: severe acute respiratory syndrome
SARS-CoV-2: severe acute respiratory syndrome coronavirus 2
https://www.jmir.org/2020/8/e19611 J Med Internet Res 2020 | vol. 22 | iss. 8 | e19611 | p. 11
(page number not for citation purposes)
XSL• FO
RenderXJOURNAL OF MEDICAL INTERNET RESEARCH Sousa-Pinto et al
Edited by G Eysenbach; submitted 24.04.20; peer-reviewed by H Mehdizadeh, A Mavragani; comments to author 23.05.20; revised
version received 29.05.20; accepted 11.06.20; published 10.08.20
Please cite as:
Sousa-Pinto B, Anto A, Czarlewski W, Anto JM, Fonseca JA, Bousquet J
Assessment of the Impact of Media Coverage on COVID-19–Related Google Trends Data: Infodemiology Study
J Med Internet Res 2020;22(8):e19611
URL: https://www.jmir.org/2020/8/e19611
doi: 10.2196/19611
PMID:
©Bernardo Sousa-Pinto, Aram Anto, Wienia Czarlewski, Josep M Anto, João Almeida Fonseca, Jean Bousquet. Originally
published in the Journal of Medical Internet Research (http://www.jmir.org), 10.08.2020. This is an open-access article distributed
under the terms of the Creative Commons Attribution License (https://creativecommons.org/licenses/by/4.0/), which permits
unrestricted use, distribution, and reproduction in any medium, provided the original work, first published in the Journal of
Medical Internet Research, is properly cited. The complete bibliographic information, a link to the original publication on
http://www.jmir.org/, as well as this copyright and license information must be included.
https://www.jmir.org/2020/8/e19611 J Med Internet Res 2020 | vol. 22 | iss. 8 | e19611 | p. 12
(page number not for citation purposes)
XSL• FO
RenderXYou can also read