Measles Elimination: Identifying Susceptible Sub-Populations to Tailor Immunization Strategies - MDPI
←
→
Page content transcription
If your browser does not render page correctly, please read the page content below
viruses
Communication
Measles Elimination: Identifying Susceptible
Sub-Populations to Tailor Immunization Strategies
Peter Kreidl 1 , David Ammerer 2 , Reinhard Würzner 1,3 , Anita Luckner Hornischer 4 ,
Dorothee von Laer 3 and Wegene Borena 3, *
 1    Department of Hygiene, Medical Microbiology and Public Health, Medical University Innsbruck,
      6020 Innsbruck, Tyrol, Austria
 2    Department of Pneumology, Regional Hospital Hochzirl-Natters, 6161 Natters, Tirol, Austria
 3    Division of Virology, Medical University Innsbruck, 6020 Innsbruck, Tyrol, Austria
 4    Regional Public Health Authority, 6020 Innsbruck, Tyrol, Austria
 *    Correspondence: wegene.borena@i-med.ac.at; Tel.: +43-512-6003-71737

 Received: 31 July 2019; Accepted: 16 August 2019; Published: 20 August 2019

 Abstract: Measles elimination has been identified as a public health priority in Europe for a long time
 but has not yet been achieved. The World Health Organization (WHO) recommends identification
 of susceptible sub-populations to target supplementary immunization activities. We used three
 different sources of information: retrospective samples investigated for measles IgG between 1997
 and 2016, vaccine coverage data from the existing electronic registry for birth cohorts 2015 to 1999,
 and surveillance data from 2009 until 20 July 2019. We calculated susceptibility by birth cohort using
 seroprevalence data, adjusting vaccine coverage data with reported effectiveness (93% for the first
 and 97% for the second dose, respectively), and compared it with measles incidence data, aggregated
 by birth cohorts and districts. Susceptibility levels for persons 10–41 years (birth cohorts 2007–1976)
 were 10.4% and thus far above the recommended values of WHO (5%). Older birth cohorts were
 sufficiently protected. Districts with the highest susceptibility estimates corresponded with districts
 with the highest incidence rates. Birth cohorts with susceptibility levels > 10% showed a 4.7 increased
 relative risk of having had more than one measles case. We conclude that retrospective serosurveys
 are a cheap and useful approach in identifying susceptible sub-populations, especially for older birth
 cohorts whose coverage data remain scarce.

 Keywords: measles; serosurvey; vaccine coverage; surveillance

1. Introduction
      Measles elimination in the WHO Region for Europe was already planned for 2010 but has not yet
been achieved [1,2]. The number of reported measles cases in the region increased 15 times between
2016 (the year with the lowest number of cases recorded) and 2018 [3]. Several issues have contributed
to this phenomenon, one of them being vaccine hesitancy- a factor identified as one of the 10 key health
threats in 2019 [4]. WHO recommends to diagnose the determinants of insufficient vaccine uptake
and to tailor vaccination strategies [5]. Susceptibility levels below 5% in children 10 years and older,
below 10% in children age five to nine years, and below 15% in children 24 months to 4 years are
needed to eliminate measles [6].
      In Austria, mandatory reporting of suspected measles cases has been implemented in 2006 [7].
The first measles containing vaccines (MCV) were licensed in 1963 in the US [8] and, since 2001, more than
2 billion doses were administered globally [9]. Bivalent (with mumps) MCV was recommended in
1974 in Austria, and the use of two doses of trivalent (measles–mumps–rubella) vaccine (MMR) was

Viruses 2019, 11, 765; doi:10.3390/v11080765                                   www.mdpi.com/journal/viruses
Viruses 2019, 11, 765 2 of 10
recommended in 1994 [10]. Since 1985, MCV was administered free of charge for children up to 15 years
of age and since 2015 for all age groups [11].
Vaccine coverage is estimated by the administrative method in Austria. Since 2016, an agent-based
simulation model has been implemented to better assess the number of susceptible persons to
measles [12].
In Tyrol, one of Austria’s nine regions with 739,139 inhabitants in 2016 [13], the estimated
coverage of the birth cohorts 2000 to 2009 was 88.2% with one dose and 76.5% with two doses of
measles containing vaccine in 2012 [14]. Since 2000, an electronic vaccination registry has been fully
implemented in Tyrol.
As of 2014, the Tyrolean government has required proof of two doses of MCV from all health care
workers (HCW) in Tyrolean hospitals. Those who lack documented evidence of two doses of MMR are
required to undergo serological testing. The same applied to all medical students.
The WHO provides guidance to seroprevalence surveys to better identify pockets of susceptible
populations, and recommends their use if surveillance was only recently implemented and when
coverage data are less reliable for older age groups [15]. Nevertheless, serosurveys as recommended
by WHO are costly, logistically difficult to conduct, and require substantial time commitment as well as
ethical approval. The objective of our work was to assess the usefulness of retrospective seroprevalence
data and to describe the proportion of measles susceptible persons by birth cohort and district to better
understand sub-populations that are most at risk. This knowledge may help to tailor awareness raising
activities as mentioned in the national measles elimination plan [16].
2. Materials and Methods
In order to identify sub-populations that are most at risk for measles, we assessed the population
immunity using three different sources of information: The results of an analysis of the MCV coverage
data extracted from the regional electronic vaccination registry, the results from an ad-hoc retrospective
serosurvey conducted in 2017 and the most recent surveillance data from the electronic reporting
system EMS [17].
2.1. Retrospective Seroprevalence Survey
We used retrospective data of all persons who were investigated for measles IgG antibodies
between 1997 and 2016 in the Division of Virology at the Medical University of Innsbruck (Sheet S1).
This laboratory received the majority of blood samples for measles serology testing in Tyrol which
were approximately 1300 samples per year. Testing was usually requested for unspecific exanthema
with or without fever. The information available at the laboratory did neither include detailed clinical
information nor information about the vaccination status. IgM results were not considered in our
analysis because detection of recent infection was not our primary objective. Samples were classified
as positive/negative according to cut-off values described by the respective manufacturer. Borderline
values were excluded. Between 1 January 1997 and 19 November 2016 an enzyme immunoassay (ELISA;
Enzygnost® Anti-Measles Virus/IgG, Siemens, Marburg, Germany) and since then a chemoluminent
immunoassay (CLIA, LIAISON® Measles IgG, Diasorin, Saluggia, (VC), Italy) were used. A sufficient
number of parallel tests were conducted using both kits during the transition phase from ELISA to
CLIA and results were comparable between the two kits. The last available laboratory result of each
individual obtained between 1 January 1997 and 31 December 2016 was included. The exclusion
criteria included the following: (a) place of residency outside Tyrol or not available, (b) date of birth
before 1917 or not available, (c) inconclusive laboratory result, or (d) potential immunodeficiency.
Potential immunodeficiency was defined as admittance to an intensive care unit (ICU) department
or any other department, where patients were likely to be immunocompromised at the time of the
sampling, such as oncology, transplant, or hematological wards. Furthermore, we excluded all HCWs
and medical students tested for measles IgG from our analysis. Both groups who could not provideViruses 2019, 11, 765 3 of 10
documented evidence of vaccination with two doses of MCV were requested by the regional authorities
to confirm immunity by IgG testing.
The age of the participants was calculated as of 31 December 2016. Susceptibility to measles was
assumed to be unchanged since the time of the last investigation.
We defined birth cohorts with susceptibility levels higher than 10% as high risk cohorts.
Seroprevalence data were extracted from the virological laboratory software in an anonymized
way and analyzed using EpiinfoTM (Version 7.2.2.2, CDC Atlanta, GA, USA). We calculated the
susceptibility by birth cohort and district, using the mid population data between 1996 and 2016 [13].
The study was approved by the ethical committee of the Medical University of Innsbruck under
EK Nr: 1082/2017.
2.2. Susceptibility Estimates from the Electronic Vaccination Registry
We extracted the MCV coverage data from the electronic vaccination registry of Tyrol in July 2018
for all available birth cohorts (1997–2013) in an aggregated format (Sheet S3). Data from 1999 were
incomplete but were still included in the analysis. MCVs were trivalent MMR (measles–mumps–rubella)
vaccines. We used the denominator data available from Statistik Austria from 2016 [13] to calculate
coverage. We calculated the susceptibility levels using MCV coverage and assumed a vaccine
effectiveness of 93% for the first and 97% for the second dose. Susceptible persons were stratified by
number of MCV doses received and district of residency.
2.3. Reported Measles Cases in Tyrol
We used the case-based measles surveillance reports between 2003 and 2019 from Tyrol (Sheet S2)
and compared them with the susceptibility levels by birth cohort obtained from the seroprevalence
survey. We used the number of reported measles cases between 2009 and 2019 (prior to 2009 the
district of cases was not available) to calculate the mean annual incidence for the 10.6-year period by
district (number of cases per 1 million inhabitants). We compared the district specific incidence with
the susceptibility estimates from the serosurvey. We defined birth cohorts with more than one measles
case between 2009 and 2019 as high incidence birth cohorts. We calculated the relative risk and the
95% confidence interval for birth cohorts with susceptibility levels > 10% (exposure) with more than
one reported measles case during the observation period (outcome: high incidence birth cohorts).
3. Results
3.1. Retrospective Seroprevalence Survey
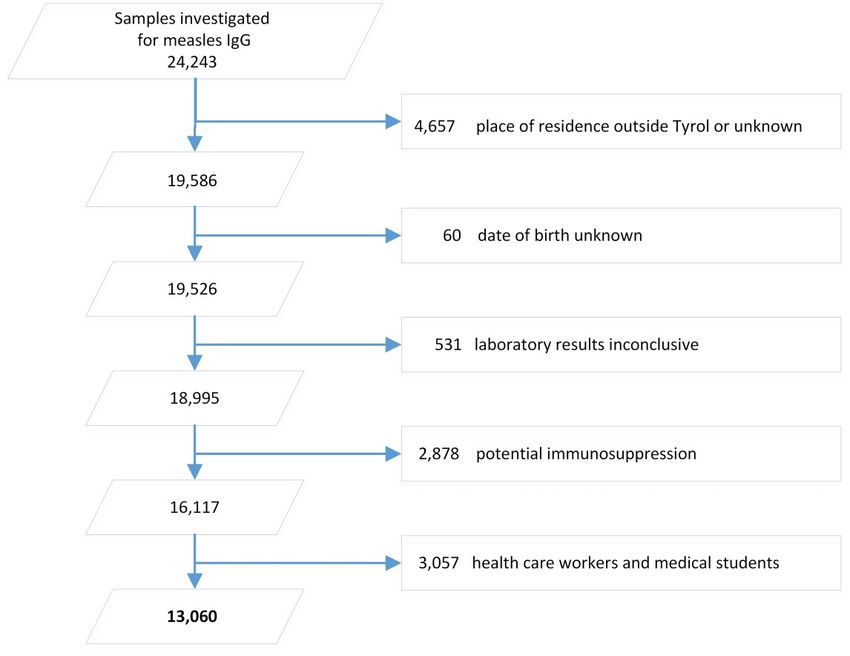
Between 1 January 1997 and 31 December 2016, 24,243 samples were investigated for measles IgG.
After application of the exclusion criteria, 13,060 individual records remained and were included in
our analysis (Figure 1).Viruses 2019, 11, 765 4 of 10
Viruses 2019, 11, x FOR PEER REVIEW 4 of 11
Figure
Figure1.1.Sample
Samplesize
size of investigated
investigatedpatient
patient samples
samples in Tyrol,
in Tyrol, 1997–2016
1997–2016 andsample
and final final sample
size for size for
analysisafter
analysis afterapplication
application of
ofinclusion
inclusionand exclusion
and criteria.
exclusion criteria.
Women
Women accounted forfor
accounted 54%
54%ofof participants(n(n==7,057);
participants 7,057); for
for 1.5% (n ==195)
1.5% (n 195)gender
genderinformation
information was
was not available. The highest number of participants was in the age group
not available. The highest number of participants was in the age group 40 to 49 years40 to 49 years (as
(as of
of 31
31 December
December 2016) (Table 1).
2016)(Table 1). Children
Children between
between24 24months
monthsofofage
ageand
and4 years were
4 years wereunderrepresented
underrepresented
(Figure 2).
(Figure 2).
Table 1. Characteristics of study participants: age (calculated as of 31 December 2016), birth cohort,
Table 1. Characteristics of study participants: age (calculated as of 31 December 2016), birth cohort,
and proportion of participants by birth cohort.
and proportion of participants by birth cohort
Birth Cohorts
Birth Cohorts Age
AgeGroups
Groups N Participants %
N Participants %
2016–2013 2016–2013 24months
24 monthstoto44years
years 45 450.3 0.3
2012–2008 2012–2008 55toto99years
years 331 3312.5 2.5
2007–2003 2007–2003 10
10toto14
14years
years 733 7335.6 5.6
2002–1993 2002–1993 15
15toto24
24years
years 1780 13.6
1780 13.6
1992–1978 1992–1978 25
25toto39
39years
years 2701 20.7
2701 20.7
1997–1958 1997–1958 40
40toto59
59years
years 4186 32.1
4186 32.1
1957–1917 60+ years 3284 25.2
1957–1917 60+ years 3284 25.2
TOTAL 13,060 100
TOTAL 13,060 100
AllAll
nine districts
nine of Tyrol
districts sent
of Tyrol samples
sent samplesto the laboratory.
to the laboratory. TheThe
mean proportion
mean of the
proportion represented
of the represented
population
populationby by
district waswas
district 1.7% ranging
1.7% from
ranging 0.8%
from to 2.6%.
0.8% to 2.6%.
Among
Among all participants 5.9% were
all participants 5.9%susceptible to measles.
were susceptible to Susceptibility levels were age
measles. Susceptibility dependent
levels were age
(Table 2). The highest
dependent susceptibility
(Table 2). The highest levels were, as expected,
susceptibility in theasmost
levels were, recent in
expected, birth
thecohorts. The age
most recent birth
dependent WHO recommended susceptibility levels needed for elimination (5–15%)
cohorts. The age dependent WHO recommended susceptibility levels needed for elimination (5–15%)[6] were achieved
by [6]
birth cohorts
were 1978,by
achieved 1979, and
birth 1976 and
cohorts older
1978, (Figure
1979, 2). Susceptibility
and 1976 levels2).
and older (Figure forSusceptibility
persons 10–41levels
yearsfor
(birth cohorts
persons 2007–1976)
10–41 were 10.4%
years (birth cohortsand2007–1976)
therefore farwere
above the values
10.4% recommended
and therefore by WHO
far above the (5%).
values
recommended by WHO (5%).2007–2003 10 to 14 years 14.9 5
2002–1993 15 to 24 years 13.0 5
1992–1978 25 to 39 years 8.8 5
1997–1958 40 to 59 years 1.9 5
1957–1917 60+ years 0.4 5
Viruses Total
2019, 11, 765 5.9 5 of 10
WHO susceptibility value needed for elimination
% susceptibles
3 year moving average of susceptibility
30%
25%
20%
% Susceptibles
15%
10%
5%
0%
2016
2011
2006
2001
1996
1991
1986
1981
1976
1971
1966
1961
1956
1951
1946
1941
1936
1931
1926
1921
Birth cohorts
Figure 2. Proportion of susceptible persons by birth cohort, 3-year moving averages and WHO
recommended
Figure susceptibility
2. Proportion values needed
of susceptible personsforby
elimination (birth
birth cohort, cohorts
3-year 1917–2016).
moving averages and WHO
recommended susceptibility values needed for elimination (birth cohorts 1917–2016).
Table 2. Measles susceptibility levels by birth cohort and age group and WHO recommended maximum
susceptibility values necessary for elimination.
Thirty-seven of 99 birth cohorts (excluding the birth 2016 cohort due to non-eligibility for
vaccination) did not achieve
Birth Cohorts the necessary immunity
Age Groups levels needed
% Susceptible Maximumfor elimination. Among them,
WHO Recommended Valuethe
mean2014–2013
difference between expected
24 months to 4 years WHO susceptibility
60.0 requirements and observed
15 susceptibility
levels2012–2008
was 17.6% (median 12.9%;
5 to 9 yearsrange: 5.3–75.0%).
23.9 The five most recent birth10cohorts (2011–2015)
showed levels of 25% or10higher
2007–2003 above the expected
to 14 years 14.9 values. Ten birth cohorts (1977,1980–1982,
5 1985,
2002–1993
1987–1988, 1990–1991, and 15 to1995)
24 years 13.0
showed susceptibility levels between 5–9%, and 5 22 birth cohorts
1992–1978 25 to 39 years 8.8 5
(1983, 1984, 1986, 1989, 1992–1994, 1996–2010) between 1% to 4% deviating from the target,
1997–1958 40 to 59 years 1.9 5
respectively.
1957–1917 60+ years 0.4 5
Less females were susceptible to measles (5.1%)
Total 5.9 compared to males (7.1%) (p < 0.0001). The mean
proportion of susceptible persons per district varied between 5.0% and 8.6%, with a mean of 6.4%
and a median of 6.0%.
Thirty-seven of 99 birth cohorts (excluding the birth 2016 cohort due to non-eligibility for
vaccination) did not achieve the necessary immunity levels needed for elimination. Among them,
3.2. Coverage Data with Two Doses of Measles Containing Vaccine from the Tyrolean Electronic Vaccine
the mean difference between expected WHO susceptibility requirements and observed susceptibility
Registry
levels was 17.6% (median 12.9%; range: 5.3–75.0%). The five most recent birth cohorts (2011–2015)
The levels
showed adjusted susceptibility
of 25% levels the
or higher above by birth cohort
expected usingTen
values. onebirth
(MCV1) or (1977,1980–1982,
cohorts two doses (MCV2) of
1985,
MCV both followed the pattern of the 3-year moving average seroprevalence susceptibility
1987–1988, 1990–1991, and 1995) showed susceptibility levels between 5–9%, and 22 birth cohorts (1983, data,
especially
1984, 1986,for MCV1
1989, for birth
1992–1994, cohorts 2009
1996–2010) and older.
between 1% to The mean difference
4% deviating from thebetween seroprevalence
target, respectively.
data and
Lessfirst dosewere
females adjusted susceptibility
susceptible was(5.1%)
to measles 5% (median
compared2%,torange
males-1% (p < 0.0001).
to 22%),
(7.1%) and the The
mean for
mean
the second dose was -5% (median -5%; range, -29% to 7%), respectively. While
proportion of susceptible persons per district varied between 5.0% and 8.6%, with a mean of 6.4% and the estimated
a median of 6.0%.
3.2. Coverage Data with Two Doses of Measles Containing Vaccine from the Tyrolean Electronic Vaccine Registry
The adjusted susceptibility levels by birth cohort using one (MCV1) or two doses (MCV2) of MCV
both followed the pattern of the 3-year moving average seroprevalence susceptibility data, especially
for MCV1 for birth cohorts 2009 and older. The mean difference between seroprevalence data and first
dose adjusted susceptibility was 5% (median 2%, range −1% to 22%), and the mean for the second
dose was −5% (median −5%; range, −29% to 7%), respectively. While the estimated proportion of
susceptible population with one dose of vaccine was below the data from the seroprevalence surveyViruses 2019, 11, x FOR PEER REVIEW 6 of 11
Viruses 2019, 11, 765 6 of 10
proportion of susceptible population with one dose of vaccine was below the data from the
seroprevalence survey the estimated susceptibility with two doses of MCV was above the
the estimated susceptibility with two doses of MCV was above the seroprevalence estimates—except
seroprevalence estimates—except for the birth cohorts 2010 to 2012 (Figure 3).
for the birth cohorts 2010 to 2012 (Figure 3).
3 year moving average of % susceptibles (serosurvey)
Adjusted % of susceptibles MCV1
Adjusted % of susceptibles MCV2
90%
80%
70%
60%
% susceptible
50%
40%
30%
20%
10%
0%
2016
2015
2014
2013
2012
2011
2010
2009
2008
2007
2006
2005
2004
2003
2002
2001
2000
1999
1998
1997
1996
1995
1994
Birth cohort
Figure 3. Proportion of susceptible persons by birth cohort (1994–2014): comparison of 3-year moving
Figure
average3. susceptibility
Proportion of levels
susceptible persons by birth
of seroprevalence cohort
data, (1994–2014):
adjusted vaccine comparison of 3-year
coverage data for onemoving
or two
average susceptibility levels of seroprevalence data, adjusted vaccine coverage data for
doses of a measles containing vaccine (MCV), assuming a vaccine effectiveness of 93% for the onefirst
or two
and
doses of the
97% for a measles
second containing
dose. vaccine (MCV), assuming a vaccine effectiveness of 93% for the first
and 97% for the second dose.
3.3. Reported Cases of Measles in Tyrol
3.3. Reported
Between Cases
2003ofand
Measles in aTyrol
2019, total of 99 measles cases were reported. Since 2008, peaks with a
maximum of 16 cases in 2011 were
Between 2003 and 2019, a total observed every 3–4
of 99 measles years
cases (Table
were 3). Detailed
reported. Sincecase information
2008, was
peaks with a
only available
maximum of 16for cases
cases in since 2009. observed every 3–4 years (Table 3). Detailed case information was
2011 were
only available for cases since 2009.
Table 3. Number of reported measles cases by year of reporting (n = 97).
Table 3. Number of reported measles cases by year of reporting (n=97)
Year of Reporting Number of Cases
Year2003
of Reporting Number of 2Cases
2003
2004 2 -
2005
2004 - 2
2006
2005 2 2
2007
2006 2 2
2008
2007 2 14
2009 2
2008 14
2010 1
2009 2
2011 16
2010 1
2012 3
2011
2013 16 15
2012
2014 3 14
2013
2015 15 3
2014
2016 14 3
2017
2015 3 10
2018
2016 3 1
2019
2017 10 9
Total
2018 1 99
2019 9
Total 99Viruses 2019, 11, 765 7 of 10
Among the 77 cases reported since 2009, the mean age at the time of diagnosis was 20.5 years
(median 21 years; range 7 months to 48 years). Females accounted for 44% (n = 34) of cases.
The mean annual number of cases for 2009–2019 per district varied between 0 and 19 cases, the
mean annual incidence between 0 and 20.3 cases per 1 million inhabitants (mean 9.7, median 7.5).
The highest incidence was reported from the district with the highest proportion of susceptible
population from the seroprevalence data (Table 4)
Table 4. Population, proportion of susceptibles of the serosurvey and cumulative incidence 2009–2016
by district.
Mean Population Proportion Number of Mean Annual Incidence (2009–2019 *)
District
1996–2016 Susceptibles Cases Cases per 1,000,000 Inhabitants
Imst 56,073 5.0% 4 6.74
Innsbruck Land 164,010 5.6% 13 7.49
Innsbruck Stadt 116,202 6.0% 17 13.82
Kitzbühel 69,991 8.6% 15 20.25
Kufstein 99,433 6.9% 19 18.06
Landeck 44,092 6.9% 0 0.00
Lienz 49,783 7.2% 2 3.80
Reutte 31,729 5.4% 5 14.89
Schwaz 78,303 5.8% 2 2.32
Total 709,616 77 9.86
* = as of 20 July 2019.
Among the 100-year birth cohort band, 72 birth cohorts had susceptibility levels below 10% and
61 birth cohorts below 5%. The relative risk of having observed more than one measles case per district
between 2009 and 20 July 2019 in districts with susceptibility levels > 10% was 4.7 (95% CI: 2.52–8.52).
4. Discussion
We assessed the susceptibility levels for measles among the Tyrolean population using three
sources of information: a retrospective analysis of already available serological data for measles IgG
(serosurvey), vaccine coverage data from the electronic vaccination registry and surveillance data from
the mandatory electronic reporting system.
We found that the WHO recommended susceptibility thresholds of maximum 15% in children
24 months–4 years, 10% in persons 5–9 years, and 5% in persons >10 years were not achieved.
Susceptibility was age dependent and the threshold of less than 5% was only reached by birth cohorts
1976 (41 years of age as of 31 December 2016), 1978, and 1979 or older. Susceptibility levels for persons
10–41 years (birth cohorts 2007–1976) were twice as high as the recommended values of WHO of 5%
for these age groups.
More than one-third of the population was considered to be immune with susceptibility levels
below the requested age-dependent thresholds. The highest susceptibility levels were identified among
the most recent birth cohorts until birth cohort 2011, with susceptibility levels differing between 15–50%
from the WHO target. Ten birth cohorts revealed susceptibility levels between 5% and 9% and further
22 birth cohorts levels between 1% and 4% above the expected WHO targets. Many member states of
the European Union did not achieve the requested WHO goals and susceptible persons accumulated
over time [18]. Even a slight increase in MCV uptake was associated with significant reduction of
overall burden of disease [19].
Significantly more males were susceptible to measles compared to females. This uneven gender
distribution was also confirmed by surveillance data. Such inequities are not yet addressed through
vaccination policies [20] and studies suggest there are no major sex differences in IgG production
following vaccination [21].
We identified several limitations of our seroprevalence study: due to the very long observation
period, the likelihood of losing detectable antibody levels—especially of persons who were vaccinated
with only one dose of MCV—has to be considered and might have biased our results. This wouldViruses 2019, 11, 765 8 of 10
probably not apply for persons who had either experienced natural infection, received two doses of
MCV or were re-exposed. This may have been of less influence, as participants from nearly all birth
cohorts were investigated recently. In fact, the long time span of the serosurvey resulted in a large
sample size and thus allowed more precise estimates. Estimates also became more reliable due to
careful exclusion of ambiguous data and they were based on well validated test kits in an accredited
laboratory. Despite the fact the only few seroprevalence data of recent birth cohorts were available,
the estimation of susceptibles by the two different approaches, retrospective seroprevalence data, and
estimation of susceptibles using coverage data corresponded quite well. As expected, coverage with
one dose of MCV was constantly higher compared to coverage with two doses and thus susceptibility
was inversely correlated. The long observation period may have also resulted in an underestimation
of susceptibility in more recent birth cohorts due to very small numbers. Using coverage data from
the electronic registry has resulted in a much better estimate of susceptibles of more recent birth
cohorts. For the assessment of susceptibility with one or two doses of MCV we used the reported
vaccine effectiveness for each dose as reported by the Centre for Diseases Control (CDC), Atlanta [22].
The assumption of 93% vaccine effectiveness for the first dose and 97% of the second dose was very
conservative as higher vaccine effectiveness was reported by other authors [23,24].
Another limitation of our seroprevalence data was that despite the entire region being covered,
districts that are physically closer located to the laboratory were overrepresented and districts further
away sent fewer samples. This is important as Tyrol is known to be a region with a high prevalence of
vaccine hesitant persons [25]. This may have resulted in a greater inaccuracy from districts further
away from the capital. Nevertheless, the highest incidence districts calculated from surveillance data
were in line with the highest susceptibility levels by district from the seroprevalence data. As vaccine
coverage data were only available in aggregated format, we could not compare incidence with coverage
by district.
The differences of susceptibility by birth cohort with seroprevalence and estimated adjusted
susceptibility data from the electronic vaccination registry corresponded well in their pattern, and
the mean varied between −5% for the second dose and 5% with the first dose. Susceptibility levels of
seroprevalence data were higher in recent birth cohorts until 2009 compared to susceptibility calculated
using coverage data. The latter was probably due to the small sample sizes of recent birth cohorts in
the seroprevalence survey.
The estimates of susceptible persons from the agent-based simulation model at a national level
identified that approximately 70% of 19–30 year-old persons were protected with two doses of MCV as
of 2018. In our data the increase of susceptibility using the second dose adjusted susceptibility started
already from the birth cohort 2005 until birth cohort 1998 [12]. This may be due to regional differences.
Limitations of our coverage data were the different sources of numerator and denominator data.
Participants who moved out of the region or died were still included in the numerator but were
excluded from the denominator, in which only resident persons were reported. This might have led to
an overestimation of vaccine coverage.
Limitations of our surveillance data were that detailed information was only available since 2009.
As older age groups were more affected in recent years in many countries, this may have resulted
in underestimation of attack rates of younger individuals. If a virus is introduced to a susceptible
population, cluster cases are known to occur in similar age groups. Therefore, the short observation
period of our surveillance data may have reflected this phenomenon. Nevertheless, birth cohorts with
more than one case reported were significantly positively associated with susceptibility levels > 10%.
Targeted catch-up campaigns of the identified birth cohorts focusing on high incidence districts
would definitely be crucial to close immunization gaps and reduce the number of susceptibles but
raising awareness and social mobilization of the target groups were shown to be difficult. In our
experience, when mandatory vaccination has not been implemented and no incentives for vaccination
were provided, participation in catch-up campaigns remained unsatisfactory [25].Viruses 2019, 11, 765 9 of 10
We conclude the Tyrolean population is not sufficiently protected against measles and additional
measures such as targeted supplementary immunization activities (e.g., targeted catch-up campaigns)
are necessary to achieve elimination. This was also underlined by the fact that the majority of recently
reported measles cases corresponded well with the birth cohorts with highest susceptibility levels.
Priorities should be given to districts and birth cohorts with the lowest susceptibility, considering the
WHO recommended values.
Our seroprevalence data suggested that additional immunization activities should target birth
cohorts between 2011 and 2015 as a first priority and birth cohorts between 1998 and 2010 as a
second priority.
Furthermore, our results suggest that birth cohorts before 1976 are not target groups for
supplementary immunization activities as the majority of them are probably immune due to natural
infection. In 2019, we conducted several activities mainly during the European Immunization Week to
increase awareness and enhance uptake targeting the identified birth cohorts and districts, such as social
mobilization and information campaigns in schools and universities, including health care workers.
We conclude that using different sources of information such as vaccine coverage data, surveillance
data, and retrospective seroprevalence data is useful to identify pockets of susceptibles and retrospective
seroprevalence data could be an additional cheap and useful source of information to better identify
sub-populations, such as birth cohorts and geographical areas with increased measles susceptibility.
This will especially apply for older birth cohorts, whose coverage data are lacking.
Supplementary Materials: The following are available online at http://www.mdpi.com/1999-4915/11/8/765/s1,
Sheet S1: seroprevalence data, Sheet S2: Minimal dataset surv s, Sheet S3: MDS MCV coverage data.
Author Contributions: Conceptualization, P.K. and W.B.; Methodology, P.K., W.B.; Software, W.B., D.A., and P.K.;
Validation, W.B. and D.A.; Formal analysis, P.K., D.A., and A.L.H.; Investigation, P.K. and A.L.H.; Resources, A.L.H.,
D.A., and P.K.; Data curation, D.A., P.K., and A.L.H.; Writing—original draft preparation, P.K.; Writing—review and
editing, R.W., A.L.H., D.A., and D.v.L.; Visualization, P.K; Supervision, D.v.L. and P.K.; Project administration, P.K.
Funding: This research received no external funding.
Acknowledgments: The authors want to acknowledge Maureen Luvanda for editing the English.
Conflicts of Interest: The authors declare no conflict of interest.
References
1. Zimmerman, L.A.; Muscat, M.; Singh, S.; Ben Mamou, M.; Jankovic, D.; Datta, S.; Alexander, J.P.; Goodson, J.L.;
O’Connor, P. Progress toward measles elimination—European region, 2009–2018. MMWR. Morb. Mortal.
Wkly. Rep. 2019, 68, 396–401. [CrossRef] [PubMed]
2. WHO. Eliminating Measles and Rubella and Preventing Congenital Rubella. Who European Region Strategic
Plan 2005–2010. Available online: http://www.euro.who.int/__data/assets/pdf_file/0008/79028/E87772.pdf
(accessed on 19 May 2019).
3. WHO. Measles-European Region. Available online: https://www.who.int/csr/don/06-may-2019-measles-
euro/en/ (accessed on 24 July 2019).
4. WHO. Ten Threats to Global Health in 2019. Available online: https://www.who.int/emergencies/ten-threats-
to-global-health-in-2019 (accessed on 24 July 2019).
5. WHO, R.O.f.E. The Guide to Tailoring Immunization Strategies. Available online: http://www.euro.who.
int/__data/assets/pdf_file/0003/187347/The-Guide-to-Tailoring-Immunization-Programmes-TIP.pdf?ua=1
(accessed on 24 July 2019).
6. de Melker, H.; Pebody, R.G.; Edmunds, W.J.; Levy-Bruhl, D.; Valle, M.; Rota, M.C.; Salmaso, S.; van den
Hof, S.; Berbers, G.; Saliou, P.; et al. The seroepidemiology of measles in western europe. Epidemiol. Infect.
2001, 126, 249–259. [CrossRef] [PubMed]
7. Österreich, R. 114. Bundesgesetz: Nderung des Epidemiegesetzes von 1950. Available online: https:
//www.ris.bka.gv.at/Dokumente/Bundesnormen/NOR40185444/NOR40185444.rtf (accessed on 25 July 2019).
8. Hendriks, J.; Blume, S. Measles vaccination before the measles–mumps–rubella vaccine. Am. J. Public Health
2013, 103, 1393–1401. [CrossRef]Viruses 2019, 11, 765 10 of 10
9. UNICEF, C.W. Measles and Rubella Initiative 2018. Available online: https://s3.amazonaws.com/wp-agility2/
measles/wp-content/uploads/2018/02/2018-MRI-Factsheet.pdf (accessed on 25 July 2019).
10. Schmid, D.; Holzmann, H.; Alfery, C.; Wallenko, H.; Popow-Kraupp, T.H.; Allerberger, F. Mumps outbreak
in young adults following a festival in austria, 2006. Euro Surveill 2008, 13. [CrossRef]
11. BMASGK. Impfplan Sterreich 2019. Available online: https://www.sozialministerium.at/cms/site/attachments/
5/4/7/CH4062/CMS1546865142466/190211_impfplan_oesterreich_2019_web.pdf (accessed on 8 May 2019).
12. BMASGK. Kurzbericht Masern. Available online: https://www.sozialministerium.at/cms/site/attachments/1/
7/5/CH4062/CMS1540470756902/kurzbericht_masern_2018_version_1.1.pdf (accessed on 24 July 2019).
13. Austria, S. Bevölkerung. Available online: http://www.statistik-austria.at/web_de/statistiken/menschen_
und_gesellschaft/bevoelkerung/index.html (accessed on 8 February 2019).
14. Österreich, G. Tiroler Gesundheitsbericht 2012. Available online: https://www.tirol.gv.at/fileadmin/themen/
gesundheit-vorsorge/influenza/downloads/TLGB2012.pdf (accessed on 8 July 2019).
15. Europe, W.R.O.f. Guidance on Conducting Serosurveys in Support of Measles and Rubella Elimination
in the Who European Region. Available online: http://www.euro.who.int/__data/assets/pdf_file/0011/
236648/Guidance-on-conducting-serosurveys-in-support-of-measles-and-rubella-elimination-in-the-
WHO-European-Region.pdf (accessed on 4 December 2019).
16. BMG. Nationaler Aktionsplan Masern-/Röteln-Elimination. Available online: http://www.bmgf.gv.at/
cms/home/attachments/8/1/7/CH1472/CMS1366715694431/nap_masernroeteln_langfassung_20130522.pdf
(accessed on 8 July 2019).
17. BMGF. Häufige Fragestellung in Bezug auf das Epidemiologische Meldesystem (ems). Available online: https://
www.sozialministerium.at/cms/site/attachments/2/9/9/CH4059/CMS1491916792014/haeufigefragenems.pdf
(accessed on 24 July 2019).
18. Carrillo-Santisteve, P.; Lopalco, P.L. Measles still spreads in europe: Who is responsible for the failure to
vaccinate? Clin. Microbiol. Infect. 2012, 18 (Suppl. 5), 50–56. [CrossRef] [PubMed]
19. Colzani, E.; McDonald, S.A.; Carrillo-Santisteve, P.; Busana, M.C.; Lopalco, P.; Cassini, A. Impact of measles
national vaccination coverage on burden of measles across 29 member states of the european union and
european economic area, 2006–2011. Vaccine 2014, 32, 1814–1819. [CrossRef] [PubMed]
20. Boyce, T.; Gudorf, A.; de Kat, C.; Muscat, M.; Butler, R.; Habersaat, K.B. Towards equity in immunisation.
Euro. Surveill. 2019, 24, 1800204. [CrossRef] [PubMed]
21. Hoes, J.; Knol, M.J.; Mollema, L.; Buisman, A.; de Melker, H.E.; van der Klis, F.R.M. Comparison of antibody
response between boys and girls after infant and childhood vaccinations in the netherlands. Vaccine 2019, 37,
4504–4510. [CrossRef] [PubMed]
22. CDC. How Well does the mmr Vaccine Work. Available online: https://www.cdc.gov/vaccines/vpd/mmr/
public/index.html (accessed on 25 July 2019).
23. Moore, C.; Cottrell, S.; Hoffmann, J.; Carr, M.; Evans, H.; Dunford, L.; Lawson, H.; Brown, K.E.; Jones, R.
Self-collected buccal swabs and rapid, real-time pcr during a large measles outbreak in wales: Evidence for
the protective effect of prior mmr immunisation. J. Clin. Virol. 2015, 67, 1–7. [CrossRef] [PubMed]
24. Pillsbury, A.; Quinn, H. An assessment of measles vaccine effectiveness, australia, 2006–2012. West. Pac.
Surveill. Response J. WPSAR 2015, 6, 43–50. [CrossRef] [PubMed]
25. Kreidl, P.; de Kat, C. Utilization and impact of european immunization week to increase measles, mumps,
rubella vaccine uptake in austria in 2016. Vaccine 2017, 35, 4836–4839. [CrossRef] [PubMed]
© 2019 by the authors. Licensee MDPI, Basel, Switzerland. This article is an open access
article distributed under the terms and conditions of the Creative Commons Attribution
(CC BY) license (http://creativecommons.org/licenses/by/4.0/).You can also read