Utility-Scale Solar Data Update: 2020 Edition - eScholarship
←
→
Page content transcription
If your browser does not render page correctly, please read the page content below
Utility-Scale Solar Data Update:
                       2020 Edition

Mark Bolinger1, Joachim Seel1, Dana Robson, Cody Warner
Lawrence Berkeley National Laboratory
1 Corresponding            authors

November 2020
This work was funded by the U.S. Department of Energy’s Solar Energy Technologies Office, under Contract No. DE-AC02-05CH11231. The views
and opinions of the authors expressed herein do not necessarily state or reflect those of the United States Government or any agency thereof, or The
Regents of the University of California.

Photo source: sPower

                           E NERGY T ECHNOLOGIES AREA   E N E R G Y A N AL YS I S   AN D   E N V I R O N M E N T AL I M P AC T S D I V I S I O N   E L E C T R I C I T Y M AR K E T S & P O L I C Y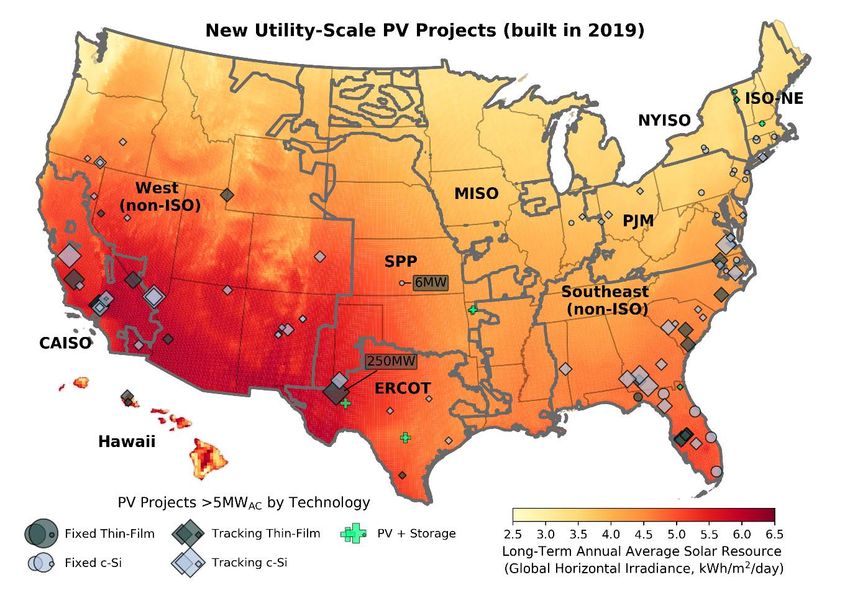
Disclaimer
                                   This document was prepared as an account of work sponsored by the United States
                                   Government. While this document is believed to contain correct information, neither the
                                   United States Government nor any agency thereof, nor The Regents of the University of
                                   California, nor any of their employees, makes any warranty, express or implied, or
                                   assumes any legal responsibility for the accuracy, completeness, or usefulness of any
                                   information, apparatus, product, or process disclosed, or represents that its use would
                                   not infringe privately owned rights. Reference herein to any specific commercial product,
                                   process, or service by its trade name, trademark, manufacturer, or otherwise, does not
                                   necessarily constitute or imply its endorsement, recommendation, or favoring by the
                                   United States Government or any agency thereof, or The Regents of the University of
                                   California. The views and opinions of authors expressed herein do not necessarily state
                                   or reflect those of the United States Government or any agency thereof, or The Regents
                                   of the University of California.

                                   Ernest Orlando Lawrence Berkeley National Laboratory is an equal opportunity employer.

                                   Copyright Notice
                                   This manuscript has been authored by an author at Lawrence Berkeley National
                                   Laboratory under Contract No. DE-AC02-05CH11231 with the U.S. Department of
                                   Energy. The U.S. Government retains, and the publisher, by accepting the article for
                                   publication, acknowledges, that the U.S. Government retains a non-exclusive, paid-up,
                                   irrevocable, worldwide license to publish or reproduce the published form of this
                                   manuscript, or allow others to do so, for U.S. Government purposes.

E NERGY T ECHNOLOGIES AREA   E N E R G Y A N AL YS I S   AN D   E N V I R O N M E N T AL I M P AC T S D I V I S I O N   E L E C T R I C I T Y M AR K E T S & P O L I C Y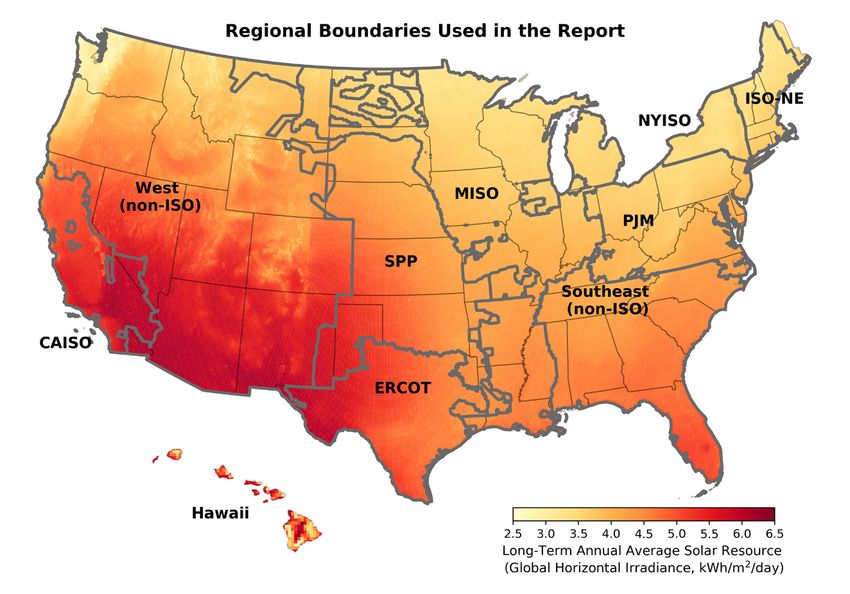
Utility-Scale Solar Data Update: 2020 Edition
Purpose and Scope:
Summarize publicly available data on key trends in U.S. utility-scale solar sector
Focus on ground-mounted projects >5 MWAC
There are separate DOE-funded data collection efforts on distributed PV
Focus on historical data, emphasizing the most-recent full calendar year
Data and Methods:
See summary at end of PowerPoint deck
Funding:
U.S. Department of Energy’s Solar Energy Technologies Office
Products and Availability:
This briefing deck is complemented by a data file and visualizations
All products available at: utilityscalesolar.lbl.gov
3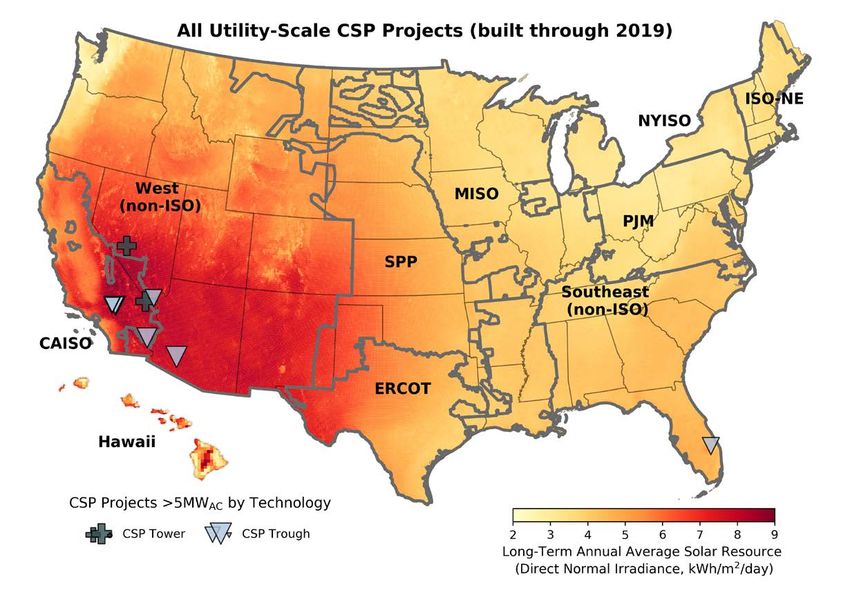
Presentation Contents

Deployment and Technology Trends

Installed Prices

Performance (Capacity Factors)

Power Purchase Agreement (PPA) Prices and LCOE

Concentrating Solar Thermal Power (CSP) Plants

Capacity in Interconnection Queues

Data and Methods

                                                 4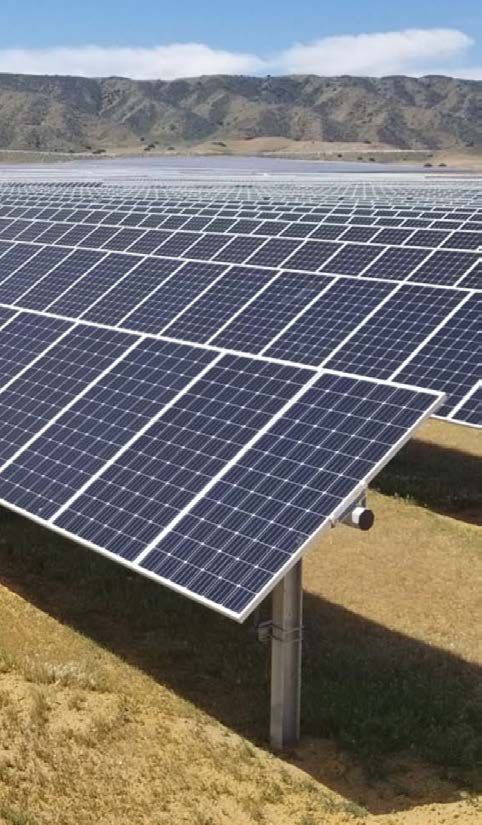
What’s new this year in the online data set?

Consistent use of new regional boundaries

Additional data for online and planned hybrid projects

Inclusion of LevelTen Energy PV power sales price data

Further presentation of trends in levelized energy costs

Reorganization and refinement of content and figures

                                                           5
Regional boundaries applied in this analysis include the seven
independent system operators (ISO) and two non-ISO regions

   Source: NREL                                                  6
Deployment and Technology Trends

  E NERGY T ECHNOLOGIES AREA   E N E R G Y A N AL YS I S   AN D   E N V I R O N M E N T AL I M P AC T S D I V I S I O N   E L E C T R I C I T Y M AR K E T S & P O L I C Y
Annual and cumulative growth of U.S. solar power capacity

Annual Solar Capacity Additions (GW)                                                                 Cumulative Solar Capacity (GW)
 24                                                                                                                                                  200
                Utility-Scale CSP
 21             Utility-Scale PV                                                                                                                     175
                Commercial PV
 18             Residential PV                                                                                                                       150

 15                                                                                                                                                  125
         PV is in GW DC and CSP is in GW AC
 12                                                                                                                                                  100
         Columns show annual capacity
   9                                                                                                                                                 75
         Areas show cumulative capacity
   6                                                                                                                                                 50

   3                                                                                                                                                 25

   0                                                                                                                                                 0
         2007

                2008

                       2009

                              2010

                                     2011

                                            2012

                                                   2013

                                                          2014

                                                                  2015

                                                                         2016

                                                                                2017

                                                                                       2018

                                                                                              2019

                                                                                                     2020e

                                                                                                             2021e

                                                                                                                     2022e

                                                                                                                             2023e

                                                                                                                                     2024e

                                                                                                                                             2025e
                                                                 Installation Year
Sources: Wood Mackenzie and SEIA (2010-2019), IREC, Berkeley Lab.
Note: Wood Mackenzie and SEIA's definition of utility-scale PV capacity differs from LBNL both in size thresholds and treatment
of project phase completion.

                               Interactive data visualizations: https://emp.lbl.gov/technology-trends
                                       and https://emp.lbl.gov/capacity-and-generation-state                                                              8
Annual capacity additions of different generator types

                                   40                                                                                      40%
                                         Utility-Scale Solar
                                                               Total Solar (right axis)

                                                                                                                                 Solar Capacity Additions (% of Total)
                                         Distributed Solar
                                   35                                                                                      35%
Annual Capacity Additions (GWAC)

                                         Wind
                                         Other RE
                                   30                                                                                      30%
                                         Other non-RE
                                         Gas
                                   25                                                                                      25%
                                         Coal                            Utility-Scale Solar
                                                                         (right axis)
                                   20                                                                                      20%

                                   15                                                                                      15%

                                   10                                                                                      10%

                                    5                                                     Distributed Solar (right axis)   5%

                                    0                                                                                      0%
                                        2007 2008 2009 2010 2011 2012 2013 2014 2015 2016 2017 2018 2019
   Sources: ABB, AWEA WindIQ, Wood Mackenzie, Berkeley Lab
   Note: This graph follows GTM/SEIA’s split between distributed and utility-scale solar, rather than our 5 MWAC threshold

          Over the past 5 years, solar (31%) and wind (28%) have accounted for 59% of all
          capacity additions to the U.S. grid (utility-scale solar was 18%)
                                                                                                                                                9
Solar’s market penetration by state
Solar generation as a % Solar generation as a %
of in-state generation of in-state load
State
Utility-Scale Utility-Scale
All Solar All Solar
Solar Only Solar Only
California 19.9% 13.0% 17.7% 11.6%
Vermont 14.0% 7.5% 6.1% 3.2%
Nevada 13.7% 12.0% 14.8% 13.0%
Massachusetts 13.7% 4.9% 6.6% 2.4%
Hawaii 12.6% 2.4% 14.7% 2.9%
Arizona 6.6% 4.4% 9.9% 6.6%
Utah 6.6% 5.4% 8.5% 7.0%
North Carolina 5.7% 5.5% 5.6% 5.4%
New Mexico 4.7% 3.8% 6.6% 5.4%
New Jersey 4.7% 1.7% 4.7% 1.7%
Rest of U.S. 0.9% 0.6% 1.0% 0.7%
TOTAL U.S. 2.6% 1.7% 2.9% 1.9%
Source: EIA
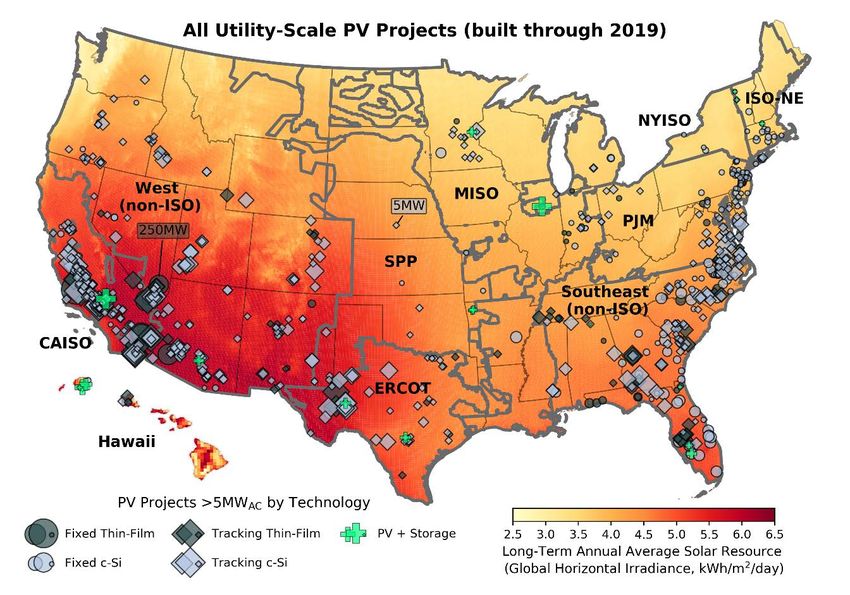
10Utility-scale solar projects that were added in 2019
Source:
Berkeley Lab
Interactive data visualizations: https://emp.lbl.gov/animated-map-pv-growth-gif
and https://emp.lbl.gov/technology-trends 11Utility-scale solar projects in operation at the end of 2019
Source:
Berkeley Lab
Interactive data visualizations: https://emp.lbl.gov/animated-map-pv-growth-gif
and https://emp.lbl.gov/technology-trends 12Annual and cumulative utility-scale PV capacity by region
Annual Capacity Additions (GWAC) Cumulative Capacity (GWAC)
9 27
West (non-ISO) Columns show annual capacity
8 Southeast (non-ISO) 24
Areas show cumulative capacity
7 SPP 21
PJM
6 18
NYISO
5 MISO 15
ISO-NE
4 12
HAWAII
3 ERCOT 9
CAISO
2 6
1 3
0 0
2010 2011 2012 2013 2014 2015 2016 2017 2018 2019
Installation Year
Source: Berkeley Lab
For the third year in a row, the Southeast led all other regions in 2019 in terms of
new utility-scale PV capacity additions.
13Annual and cumulative utility-scale PV capacity by module and
mounting type
Annual Capacity Additions (GWAC) Cumulative Capacity (GWAC)
8 32
7 Tracking Thin-Film 28
Tracking c-Si
6 Fixed-Tilt Thin-Film 24
5 Fixed-Tilt c-Si 20
4 16
Columns show annual capacity
3 12
Areas show cumulative capacity
2 8
1 4
0 0
2010 2011 2012 2013 2014 2015 2016 2017 2018 2019
Installation Year
Source: Berkeley Lab
88% of all new utility-scale PV capacity added in the United States in 2019
employ tracking—the highest single-year share yet.
14Global horizontal irradiance (GHI) by mounting type and
installation year
Long-Term Average Annual GHI at Newly Built Sites (kWh/m2/day) All PV
0 2 4 6 8 10 12 14 16 Fixed-Tilt
18 PV 20
6.0 Tracking PV
5.5
5.0
4.5
4.0
Markers show median values, with 20th and 80th percentiles
3.5
2010 2011 2012 2013 2014 2015 2016 2017 2018 2019
n=10 n=35 n=44 n=38 n=64 n=88 n=152 n=164 n=94 n=103
0.2 GW 0.5 GW 1.0 GW 1.3 GW 3.2 GW 2.9 GW 7.4 GW 4.1 GW 3.9 GW 4.6 GW
Installation Year
Source: Berkeley Lab (project information) and NREL (long-term annual average solar resource)
15Inverter loading ratio by mounting type and installation year
Inverter
0 Loading
2 Ratio (DC:AC)
4 6 8 10 12 14 16 18 20
1.50 All PV
Fixed-Tilt PV
1.40 Tracking PV
1.30
1.20
1.10
Markers show median values, with 20th and 80th percentiles
1.00
2010 2011 2012 2013 2014 2015 2016 2017 2018 2019
n=10 n=35 n=44 n=38 n=64 n=88 n=150 n=164 n=92 n=103
0.2 GW 0.5 GW 1.0 GW 1.3 GW 3.2 GW 2.9 GW 7.4 GW 4.1 GW 3.8 GW 4.6 GW
Installation Year
Source: Berkeley Lab
Note: The Inverter Loading Ratio (ILR, or DC:AC ratio) describes the ratio of project capacity measured in MWDC to
the nominal inverter capacity measured in MWAC
16Installed Prices E NERGY T ECHNOLOGIES AREA E N E R G Y A N AL YS I S AN D E N V I R O N M E N T AL I M P AC T S D I V I S I O N E L E C T R I C I T Y M AR K E T S & P O L I C Y
Installed price by year (in both DC and AC terms)

    0
Installed                4
          Price2 (2019 $/W)       6       8        10        12   14          16        18       20         1.3   2.3
                                        Median ($/W-AC)                Individual Projects ($/W-AC)   3.5
 8                                      Median ($/W-DC)                Individual Projects ($/W-DC)

 7                                                                                                    3.0

 6
                                                                                                      2.5
 5

 4                                                                                                    2.0

 3
                                                                                                      1.5
 2

 1                                                                                                    1.0

 0
       2010   2011   2012   2013   2014      2015      2016  2017 2018 2019                           0.5
       n=10   n=29   n=41   n=38   n=64      n=87     n=146 n=161 n=94 n=51
      0.2 GW 0.4 GW 0.9 GW 1.3 GW 3.2 GW 2.9 GW 7.4 GW 4.0 GW 3.9 GW 2.1 GW
                                                                                                      0.0
                                    Installation Year                                                         2019
  Sources: Berkeley Lab, Energy Information Administration

      The median installed price of projects that came online in 2019 fell to $1.4/WAC
      ($1.2/WDC), down 20% from 2018 and down by more than 70% from 2010.

                                                                                                                     18
Installed price by project size in 2019
Installed Price (2019 $/WAC)
3.0
Columns show median values for 2019 projects, with 20th and 80th percentiles
2.5
2.0
1.5
1.0
0.5
0.0
5-20 MW 20-50 MW 50-100 MW 100-200 MW
n=20 n=13 n=13 n=5
187 MW 434 MW 942 MW 565 MW
Source: Berkeley Lab Project Size (MWAC)
Economies of scale are evident in the 2019 project cost data.
19Installed price by mounting type and installation year
Installed
0 Price2(2019 $/W
4 AC) 6 8 10 12 14 16 18 20
8
All PV
7
Fixed-Tilt PV
6 Tracking PV
5
4
3
2
1 Markers show median values, with 20th and 80th percentiles
0
2010 2011 2012 2013 2014 2015 2016 2017 2018 2019
n=10 n=29 n=41 n=38 n=64 n=87 n=146 n=161 n=94 n=51
0.2 GW 0.4 GW 0.9 GW 1.3 GW 3.2 GW 2.9 GW 7.4 GW 4.0 GW 3.9 GW 2.1 GW
Installation Year
Sources: Berkeley Lab, EIA, FERC, SEC, trade press
The historical up-front cost premium for tracking has all but disappeared.
20Performance (Capacity Factors) E NERGY T ECHNOLOGIES AREA E N E R G Y A N AL YS I S AN D E N V I R O N M E N T AL I M P AC T S D I V I S I O N E L E C T R I C I T Y M AR K E T S & P O L I C Y
Cumulative capacity factor by resource strength, fixed-tilt vs.
 tracking, and inverter loading ratio (ILR)

 25% capacity factor sample-wide, but with large project-level range from 14%-35%
Cumulative AC Capacity Factor
40%
           Median
35%
           Individual Project
30%

25%

20%

15%

10%

 5%                      Sample includes 649 projects totaling 23.8 GWAC that came online from 2007-2018

 0%
       1 2 3 4 1 2 3 4 1 2 3 4 1 2 3 4 1 2 3 4 1 2 3 4 1 2 3 4 1 2 3 4
      ILR Quartile ILR Quartile ILR Quartile ILR Quartile ILR Quartile ILR Quartile ILR Quartile ILR Quartile
        Fixed-Tilt   Tracking     Fixed-Tilt   Tracking     Fixed-Tilt   Tracking     Fixed-Tilt   Tracking
           1st Quartile GHI             2nd Quartile GHI       3rd Quartile GHI          4th Quartile GHI
      Source: EIA, FERC, Berkeley Lab

                     Interactive data visualization: https://emp.lbl.gov/pv-capacity-factors                22
Utility-scale PV capacity factors and various drivers by
commercial operation date
Flat-to-declining trend since 2013 reflects the expansion of the market into less-
sunny regions of the United States (as depicted by the green “solar resource” line)
Average Capacity Factor in 2019 Index of Capacity Factor Influences (2010=100)
30% 200
Prevalance
Capacity factor of tracking
25% 175
20% 150
ILR
(DC:AC)
15% 125
10% 100
Solar
resource
5% 75
0% 50
2010 2011 2012 2013 2014 2015 2016 2017 2018 2019(P)
Commercial Operation Year (COD Year)
Source: EIA, FERC, Berkeley Lab
23Cumulative capacity factor by region and fixed-tilt vs. tracking
Average Cumulative AC Capacity Factor
35%
Fixed-Tilt Tracking 29.7%
30% 28.3%
25.7%
24.8%
25% 23.3% 23.8%
22.5%
21.2% 20.7% 21.4%
20.1% 19.8%
20% 18.2% 18.9%
17.7%
16.8%
135 projects, 6,761 MW
135 projects, 4,242 MW
15%
36 projects, 3,170 MW
72 projects, 2,622 MW
59 projects, 1,879 MW
32 projects, 1,648 MW
20 projects, 781 MW
10 projects, 231 MW
60 projects, 698 MW
38 projects, 937 MW
15 projects, 286 MW
15 projects, 259 MW
7 projects, 99 MW
5 projects, 81 MW
2 projects, 44 MW
5 projects, 81 MW
2 projects, 16 MW
2 projects, 44 MW
10%
5%
0%
ISO-NE PJM MISO NYISO ERCOT SPP Southeast West CAISO
(non-ISO) (non-ISO)
Source: EIA, FERC, Berkeley Lab
The high-insolation regions (West and CAISO) have the greatest number of
projects using tracking, as well as the highest capacity factors.
24Inter-annual variability in the solar resource among the sample,
by region and nationally
Average Annual Solar Resource Indices (Long-Term Average = 1.0)
1.10
1.05
1.00
0.95 National CAISO
SPP MISO
ERCOT PJM
NYISO ISO-NE
West (non-ISO) Southeast (non-ISO)
0.90
2008 2009 2010 2011 2012 2013 2014 2015 2016 2017 2018 2019
Source: NSRDB, Berkeley Lab
25Changes in fleet-wide capacity factors as projects age
Indexed Capacity Factor (Year 1=100%)
105%
Sample includes projects with COD from 2007-2018
100%
95%
90%
Capacity-Weighted Average
85%
Median (with 20th/80th percentile error bars)
1.1%/year degradation rate (for reference)
80%
Age: 1 2 3 4 5 6 7 8 9 10 11 12
Projects: 636 548 403 260 178 128 81 44 13 6 3 2
MWAC: 23,626 19,942 16,188 8,739 6,048 3,313 1,567 675 227 83 29 19
Source: EIA, FERC, Berkeley Lab
For more analysis on utility-scale PV project performance as plants age, see:
https://emp.lbl.gov/publications/system-level-performance-and
26Power Purchase Agreement (PPA) Prices
and LCOE
E NERGY T ECHNOLOGIES AREA E N E R G Y A N AL YS I S AN D E N V I R O N M E N T AL I M P AC T S D I V I S I O N E L E C T R I C I T Y M AR K E T S & P O L I C YSolar power sales price and LCOE analysis:
data sets and methodology
Berkeley Lab collects data on long-term power purchase agreement (PPA) prices
for utility-scale solar and wind energy
Solar sample includes 338 contracts totaling 23.1 GWAC from projects built from
2007 to the present, or planned for future installation
Prices reflect the bundled price of electricity and RECs as sold by the project
owner under a PPA
Dataset excludes merchant plants, projects that sell renewable energy certificates (RECs)
separately, and most direct retail sales
Prices reflect receipt of state and federal incentives (e.g., the ITC), and various market
influences; as a result, prices do not reflect solar generation costs
We also present LevelTen Energy data on PPA offers; these are often for shorter
contract durations, and levelization details are unclear
Levelized cost of energy is calculated based on following assumptions
Project-level CapEx and capacity factor data presented elsewhere in this deck
Levelized OpEx declines from $35/kWDC-yr in 2007 to $17/kWDC-yr in 2019 (2019$); project life
increases from 21.5 years in 2007 to 32.4 years in 2019 (from previous LBNL research)
Weighted average cost of capital (WACC) based on 10% equity return over time; debt interest
rate varies with the market over time; constant 60%/40% debt/equity ratio
Combined income tax of 40% pre-2018 and 27% post-2017; 5-yr MACRS; 2% inflation
28Levelized utility-scale PV PPA prices by PPA execution date and
region (full sample)
Levelized PPA Price (2019 $/MWh) CAISO
250 West (non-ISO)
20 MW MISO
SPP
200 ERCOT
PJM
NYISO
150 Southeast (non-ISO)
ISO-NE
Hawaii
100
210 MW
50
0
2006 2008 2010 2012 2014 2016 2018 2020
PPA Execution Date
Source: Berkeley Lab, FERC
Interactive data visualizations: https://emp.lbl.gov/pv-ppa-prices
and https://emp.lbl.gov/capex-lcoe-and-ppa-prices-region 29Levelized utility-scale PV PPA prices by PPA execution date and
region (recent sub-sample of the data shown on prior slide)
Levelized PPA Price (2019 $/MWh)
CAISO West (non-ISO)
MISO SPP
120 ERCOT PJM
NYISO Southeast (non-ISO)
100 ISO-NE Hawaii
10 MW
80
60
40
20
150 MW
0
2015 2016 2017 2018 2019 2020
PPA Execution Date
Source: Berkeley Lab, FERC
Interactive data visualizations: https://emp.lbl.gov/pv-ppa-prices
and https://emp.lbl.gov/capex-lcoe-and-ppa-prices-region 30Generation-weighted average levelized PPA prices by PPA
execution date: national and regional averages
Average Levelized PPA Price (2019 $/MWh)
160
140 Southeast
(non-ISO)
Hawaii
120
100
CAISO
80
PJM
60 West
MISO (non-ISO)
40 Nationwide
20 ERCOT
0
2009 2010 2011 2012 2013 2014 2015 2016 2017 2018 2019 2020(P)
PPA Execution Year
Source: Berkeley Lab, FERC
Note: Region-years withGeneration-weighted average levelized PPA prices by PPA
execution date: national and consolidated regional averages
Average Levelized PPA Price (2019 $/MWh)
160
West Southeast
140
Hawaii
120
100
80 Northeast
60
Central
40
Nationwide
20
0
2009 2010 2011 2012 2013 2014 2015 2016 2017 2018 2019 2020(P)
PPA Execution Year
Source: Berkeley Lab, FERC
Note: West = CAISO and West (non-ISO); Central = MISO, SPP and ERCOT; Northeast = PJM, NYISO and ISO-NE; Southeast
= Southeast (non-ISO). Region-years withLevelized PPA price of PV+battery hybrid projects in the sample
Levelized PPA Price (2019 $/MWh-PV)
$120
$100
$80
Hawaii 20 MW
$60 Arizona
Nevada 200 MW
$40 California
New Mexico
$20 Colorado
Florida
$0
Jul-15 Jan-16 Jul-16 Jan-17 Jul-17 Jan-18 Jul-18 Jan-19 Jul-19 Jan-20 Jul-20
PPA Execution Date
Source: Berkeley Lab, FERC
Note: Sample includes 39 PPAs in 7 states totaling 4.2 GWAC of PV and 2.3 GWAC of batteries
See public data file (at utilityscalesolar.lbl.gov) for details on >110
operating and planned PV+battery hybrid projects in 20 states 33Levelized PPA price of PV+battery hybrid projects in the sample
Levelized PPA Price (2019 $/MWh-PV)
Note: Sample includes 39 PPAs in 7 states totaling
$140
4.2 GWAC of PV and 2.3 GWAC of batteries
13 MW PV
$120
$100 Hawaii
Hawaii generally has
$80
smaller PV projects
$60
Other States
than the mainland (top
$40 graph), but with larger
$20 100 MW PV relative battery sizing
$0
690 MW PV (100% battery:PV
2015 2016 2017 2018 2019 2020
capacity, bottom graph)
Levelized PPA Price (2019 $/MWh-PV) PPA Execution Date
$140 100% battery:PV capacity
$120
Hawaii
$100
$80
See public data file
$60 90% battery:PV
(at utilityscalesolar.lbl.gov)
$40 for details on >110 operating
$20 Other States and planned PV+battery
5% battery:PV capacity hybrid projects in 20 states
$0
2015 2016 2017 2018 2019 2020
34
PPA Execution DateLevelized storage adder ($/MWh-PV) and premium (%) by
battery:PV capacity ratio and PPA execution date
Levelized Storage Adder (2019 $/MWh-PV) Storage Premium (Adder / Full PPA Price)
$20
60%
20 MW
(battery
30 MW 50% capacity)
$15 (battery
capacity)
40%
$10 300 MW 300 MW
(battery 30% (battery
capacity) capacity)
20%
$5
10%
$0 0%
0% 10% 20% 30% 40% 50% 60% 70% 80% 90% 100% 0% 10% 20% 30% 40% 50% 60% 70% 80% 90% 100%
Battery Capacity as % of PV Capacity Battery Capacity as % of PV Capacity
Storage Premium (Adder / Full PPA Price)
See public data file (at 60%
50% 75-90%
utilityscalesolar.lbl.gov) for 30-50% battery:PV capacity
40%
details on >110 operating 30%
and planned PV+battery 20%
5-25% battery:PV capacity
hybrid projects in 20 states 10%
0%
Mar-17 Sep-17 Mar-18 Sep-18 Mar-19 Sep-19 Mar-20 Sep-20
PPA Execution Date
Source: Berkeley Lab, FERC
Note: Sample includes 14 PPAs in 5 states totaling 2.0 GWAC of PV and 1.0 GWAC of batteries
35LevelTen Energy utility-scale PV PPA price indices
LevelTen PPA Price Index (2019 $/MWh, 25th percentile of first-year offer price)
$40
PJM
$35
MISO
$30
SPP
$25
ERCOT
$20
CAISO
$15
$10
Note: LevelTen does not report PPA prices for NYISO or ISO-NE.
$5
$0
2018-Q3 2018-Q4 2019-Q1 2019-Q2 2019-Q3 2019-Q4 2020-Q1 2020-Q2 2020-Q3
Source: LevelTen Energy
36LCOE of utility-scale PV by commercial operation date
Capacity-Weighted Average and Project-Level LCOE (2019 $/MWh)
350
300
250
300 MW
200
20 MW
150
100
50
0
2010 2011 2012 2013 2014 2015 2016 2017 2018 2019
Commercial Operation Year
Source: Berkeley Lab
Note: Yearly estimates reflect variations in installed cost, capacity factors, operational costs, cost of
financing, and project life; includes accelerated depreciation but excludes the ITC.
37LCOE of utility-scale PV by commercial operation date
Capacity-Weighted Average LCOE (2019 $/MWh)
350
PJM
300
Southeast
250
(non-ISO)
ISO-NE
200
MISO
150 West
(non-ISO) Hawaii
100 CAISO
50 Nationwide SPP
ERCOT
0
2010 2011 2012 2013 2014 2015 2016 2017 2018 2019
Commercial Operation Year
Source: Berkeley Lab
Note: Yearly estimates reflect variations in installed cost, capacity factors, operational costs, cost of
financing, and project life; includes accelerated depreciation but excludes the ITC. The dashed
portions of lines span intermediate years that have no data (e.g., 2018 in Hawaii, 2015 in ISO-NE).
38Comparison of LCOE and PPA prices for utility-scale PV
Median LCOE and Levelized PPA Price (2019 $/MWh)
280
240
LCOE without the ITC
200
160
120
80
LCOE with the ITC PPA price
40
0
COD: 2010 2011 2012 2013 2014 2015 2016 2017 2018 2019 2020
Projects: 10 28 40 38 63 86 146 161 94 46 TBD
MW-AC: 175 423 900 1,344 3,164 2,852 7,384 4,027 3,949 2,102 TBD
Commercial Operation Year
Source: Berkeley Lab
Close agreement between median PPA price and LCOE (with the ITC)
suggests an efficient cost-based PPA market and pass-through of the ITC
39Levelized PV and wind PPA prices and levelized gas prices
Levelized PPA and Gas Price (2019 $/MWh)
180
PV PPA prices
160
140
Levelized 20-year
120
EIA gas price projections
100
80
60
40
20
Wind PPA prices
0
2009 2010 2011 2012 2013 2014 2015 2016 2017 2018 2019 2020
PPA Execution Date and Gas Projection Year
Source: Berkeley Lab, FERC, Energy Information Administration
Note: Excludes projects in Hawaii. Smallest bubble sizes reflect smallest-volume PPAs (500 MW). 40Utility-scale PV PPA prices and natural gas fuel costs by
calendar year over time
2019 $/MWh
60
Range of AEO20 natural gas fuel cost projections
50
AEO20 reference case natural gas fuel cost projection
40
Gas
30
20
PV
10
Median PV PPA price (with 10th and 90th percentile range)
0
2020 2025 2030 2035 2040 2045 2050
Source: Berkeley Lab, FERC, Energy Information Administration
Notes: PV PPA price median and range reflect 56 PPAs executed 2018-2020. AEO 2020 delivered gas
price projections are converted from $/MMBtu to 2019 $/MWh using the heat rates implied by the
modeling output. Price comparisons shown are far from perfect—see earlier 2019 report for details. 41Concentrating Solar Thermal Power
(CSP) Plants
E NERGY T ECHNOLOGIES AREA E N E R G Y A N AL YS I S AN D E N V I R O N M E N T AL I M P AC T S D I V I S I O N E L E C T R I C I T Y M AR K E T S & P O L I C YLocation of CSP projects versus Direct Normal Irradiance (DNI)
Sources: Berkeley Lab, EIA 43Installed price of CSP projects over time
Installed Price (2019 $/W AC)
11 110 MWAC with 10 hours of storage
10
250 MWAC with 6 hours of storage
9
8 75 MWAC
7 250 MWAC each
68 MWAC
6
5 377 MWAC
4
3 CSP Trough
2 CSP Tower
1 PV Median (for reference)
0
2006 2007 2008 2009 2010 2011 2012 2013 2014 2015 2016 2017 2018 2019
Installation Year
Sources: Berkeley Lab
44Capacity factor of CSP projects (solar portion only) over time
Capacity Factor (solar portion only)
40%
Solana
Average PV in states with CSP (CA, NV, AZ)
35%
Genesis
30%
Mojave
25%
Nevada Solar One
20%
SEGS III-IX
15%
Ivanpah
10%
Crescent
5%
SEGS I & II Dunes
0%
2008 2009 2010 2011 2012 2013 2014 2015 2016 2017 2018 2019
Sources: Berkeley Lab, EIA, FERC
45Levelized CSP and utility-scale PV PPA prices (in CA, NV, and
AZ) by PPA execution date
Levelized PPA Price (2019 $/MWh)
$250 PV in CA, NV, AZ (for comparison)
CSP trough, no storage
$200 CSP trough, 6 hours storage
250 MW
CSP tower, no storage
$150 CSP tower, 10 hours storage
$100
$50
The offtaker cancelled this PPA in
October 2019, following prolonged
underperformance.
$0
2008 2009 2010 2011 2012 2013 2014 2015 2016 2017 2018 2019 2020
PPA Execution Date
Sources: Berkeley Lab, FERC
46Capacity in Interconnection Queues E NERGY T ECHNOLOGIES AREA E N E R G Y A N AL YS I S AN D E N V I R O N M E N T AL I M P AC T S D I V I S I O N E L E C T R I C I T Y M AR K E T S & P O L I C Y
Scope of generator interconnection queue data
Data compiled from interconnection queues for 7 ISOs and 30 utilities,
representing ~80% of all U.S. electricity load
Projects that connect to the bulk power system
Includes all projects in queues through the end of 2019
Filtered to include only “active” projects: removed those listed as “online,”
“withdrawn,” or “suspended”
Hybrid / co-located projects identified via either of these two methods:
“Generator Type” field includes multiple types for a single queue entry (row)
Two or more queue entries (of different generator types) that share the same point
of interconnection and sponsor, queue date, ID number, and/or COD
Emphasis was placed on identification of PV+storage and wind+storage
Other hybrid configurations are likely undercounted
Note that being in an interconnection queue does not guarantee
ultimate construction: majority of plants are not subsequently built
48Generation capacity in 37 selected interconnection queues from
2014 to 2019, by resource type
Capacity in Queues at Year-End (GW)
400 Entered queues in the year shown
Entered queues in an earlier year
300
Hatched portion indicates the amount paired with storage
200
100
0
2014 - 2019 2014 - 2019 2014 - 2019 2015 - 2019 2014 - 2019 2014 - 2019 2014 - 2019
Solar Wind Gas Storage Nuclear Coal Other
Source: Berkeley Lab review of interconnection queues Note: Not all of this capacity will be built
Interactive data visualization: https://emp.lbl.gov/generation-storage-and-hybrid-capacity 49Solar capacity in 37 selected interconnection queues from 2014
to 2019, by region
Solar Capacity in Queues at Year-End (GW)
80 Entered queues in the year shown
Hatched portion indicates the Entered queues in an earlier year
amount paired with storage
60
40
20
0
2014-19 2014-19 2014-19 2014-19 2014-19 2014-19 2014-19 2014-19 2014-19
West PJM ERCOT MISO Southeast CAISO SPP NYISO ISO_NE
(non-ISO) (non-ISO)
Source: Berkeley Lab review of interconnection queues Note: Not all of this capacity will be built
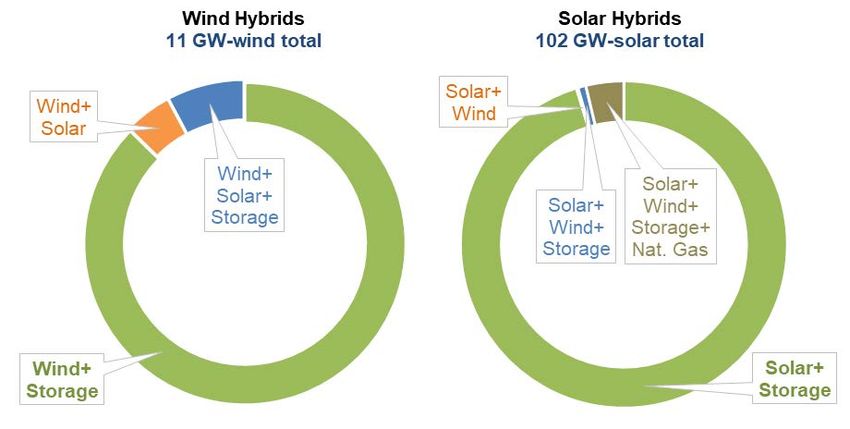
Interactive data visualization: https://emp.lbl.gov/generation-storage-and-hybrid-capacity 50Hybrid/co-located capacity within interconnection queues at end
of 2019: 102 GW of solar proposed as hybrids, 11 GW of wind
Solar+Storage and Wind+Storage
configurations are more common than
other hybrid types1
1Emphasis was placed on identification of solar+storage and
Source: Berkeley Lab review of interconnection queues
wind+storage: other hybrid configurations are likely undercounted.
Notes: (1) Not all of this capacity will be built; (2) Hybrid plants involving multiple generator types (e.g., wind+PV+storage,
wind+PV) show up in all generator categories, presuming the capacity is known for each type.
Interactive data visualization: https://emp.lbl.gov/generation-storage-and-hybrid-capacity 51Location of hybrid/co-located capacity within interconnection
queues at end of 2019
Percentage of Proposed Generators
Region Hybridizing in Each Region
Wind Solar Nat. Gas
CAISO 50% 67% 0%
Solar hybridization
ERCOT 3% 13% 0% is more evenly
SPP 1% 22% 0%
MISO 2% 17% 0%
distributed across
PJM 0% 17% 1% queues than wind
NYISO 1% 5% 4%
ISO-NE 6% 0% 0% hybridization
West (non-ISO) 6% 50% 0%
Southeast (non-ISO) 0% 6% 0%
TOTAL 4.8% 27.7% 0.6%
Source: Berkeley Lab review of interconnection queues
Notes: (1) Not all of this capacity will be built; (2) Hybrid plants involving multiple generator types (e.g.,
wind+PV+storage, wind+PV) show up in all generator categories, presuming the capacity is known for each
type; (3) Emphasis was placed on identification of solar+storage and wind+storage in queues: other hybrid /
co-located projects are likely undercounted.
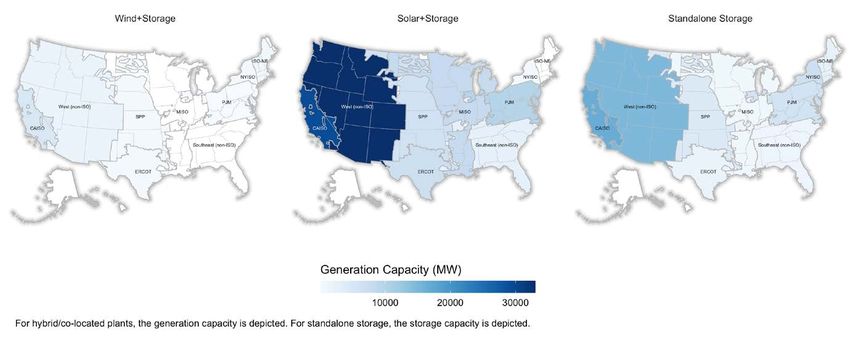
Interactive data visualization: https://emp.lbl.gov/generation-storage-and-hybrid-capacity 52Generator+storage hybrid/co-located projects and standalone
storage in interconnection queues
Storage:Generation Capacity Ratio
In the subset of ISO queues shown here, Region Wind+Storage Solar+Storage
solar hybrids plan to install more storage CAISO 25% 78%
ERCOT 54% 38%
capacity relative to generation capacity SPP 23% 38%
than do wind hybrids NYISO 7% 49%
Combined 27% 66%
Source: Berkeley Lab review of interconnection queues Note: Not all of this capacity will be built 53Data and Methods E NERGY T ECHNOLOGIES AREA E N E R G Y A N AL YS I S AN D E N V I R O N M E N T AL I M P AC T S D I V I S I O N E L E C T R I C I T Y M AR K E T S & P O L I C Y
Summary of Data and Methods (1)

Much of the analysis in this report is based on primary data, the sources of which are listed below (along with some general
secondary sources) by data set. We collect data from a variety of unaffiliated and incongruous sources, often resulting in data
of varying quality that must be synthesized and cleaned in multiple steps before becoming useful for analytic purposes. In
some cases, we essentially create new and useful data by piecing together various snippets of information that are of less
consequence on their own.

Technology Trends: Project-level metadata are sourced from a combination of Form EIA-860, FERC Form 556, state
regulatory filings, interviews with project developers and owners, and trade press articles. We independently verify much of the
metadata—such as project location, fixed-tilt vs. tracking, azimuth, module type—via satellite imagery. Other metadata are
indirectly confirmed (or flagged, as the case may be) by examining project performance—e.g., if a project’s capacity factor
appears to be an outlier given what we think we know about its characteristics, then we dig deeper to revisit the veracity of the
metadata.

Installed Prices: Project-level CapEx estimates are sourced from a combination of Form EIA-860, Section 1603 grant data
from the U.S. Treasury, FERC Form 1, data from applicable state rebate and incentive programs, state regulatory filings,
company financial filings, interviews with developers and owners, trade press articles, and data previously gathered by NREL.
CapEx estimates for projects built from 2013-2018 have been cross-checked against confidential EIA-860 data obtained under
a non-disclosure agreement (and we expect to receive similar data for 2019 projects and successive years going forward). The
close agreement between the confidential EIA data and our other sources in most cases provides comfort that our normal data
collection process (i.e., the process that we go through prior to receiving the confidential EIA data with a one-year lag) does, in
fact, yield reputable CapEx estimates. That said, we do caution readers to focus more on the overall trends rather than on
individual project-level data points.

Capacity Factors: We calculate project-level capacity factors using net generation data sourced from a combination of FERC
Electric Quarterly Reports, FERC Form 1, Form EIA-923, and state regulatory filings. Because many projects file data with
several of these sources, we are often able to cross-reference (and correct, if needed) odd-looking data across several
sources, thereby providing higher confidence in the veracity of the data.

                                                                                                                                  55
Summary of Data and Methods (2)
PPA Prices: We gather PPA price data from a combination of FERC Electric Quarterly Reports, FERC Form 1, Form EIA-923,
state regulatory filings, company financial filings, and trade press articles. We only include a PPA within our sample if we have
high confidence in all of the key variables such as execution date, starting date, starting price, escalation rate (if any), time-of-
day factor (if any), and term. By this process of exclusion, there is very little chance for erroneous PPA price data to enter our
sample. Instead, this winnowing process results in our PPA price sample being somewhat smaller than it might otherwise be—
though we are typically able to add back in any “incomplete” PPAs in subsequent years, once more data have become
available with the passage of time.
LCOE: Our project-level LCOE calculations draw upon the empirical project-level data presented throughout this report,
including installed prices, O&M costs, and capacity factors, and are supplemented with assumptions about financing and other
items, as described in more detail in earlier slides.
56An accessible data file and multiple visualizations
can be found at utilityscalesolar.lbl.gov
To contact the corresponding authors:
• Mark Bolinger, Lawrence Berkeley National Laboratory
603-795-4937, MABolinger@lbl.gov
• Joachim Seel, Lawrence Berkeley National Laboratory
510-486-5087, jseel@lbl.gov
Berkeley Lab’s contributions to this work were funded by the
Solar Energy Technologies Office, Office of Energy Efficiency
and Renewable Energy of the U.S. Department of Energy
under Contract No. DE-AC02-05CH11231. The authors are
solely responsible for any omissions or errors contained herein.
E NERGY T ECHNOLOGIES AREA E N E R G Y A N AL YS I S AN D E N V I R O N M E N T AL I M P AC T S D I V I S I O N E L E C T R I C I T Y M AR K E T S & P O L I C YYou can also read