Guide to Reports and Dashboards Supplied with Sage People - Version 22 - SP-MULTI-ANL-UG-201804-R022.00
←
→
Page content transcription
If your browser does not render page correctly, please read the page content below

Guide to Reports and
Dashboards Supplied with
Sage People

Version 22

                 SP-MULTI-ANL-UG-201804--R022.00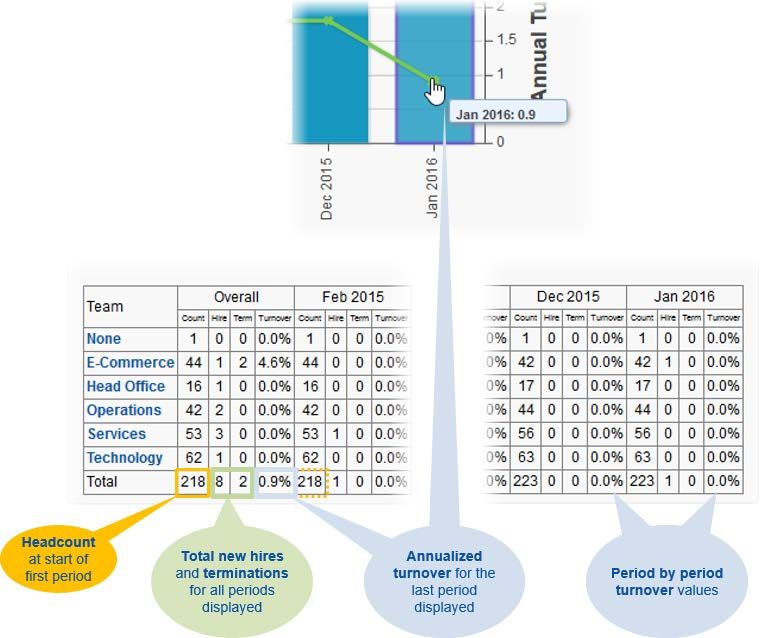
© Sage 2018. All rights reserved.
This document contains information proprietary to Sage and may not be reproduced, disclosed, or used in
whole or in part without the written permission of Sage.
Software, including but not limited to the code, user interface, structure, sequence, and organization, and
documentation are protected by national copyright laws and international treaty provisions. This document is
subject to U.S. and other national export regulations.
Sage takes care to ensure that the information in this document is accurate, but Sage does not guarantee the
accuracy of the information or that use of the information will ensure correct and faultless operation of the
service to which it relates. Sage, its agents and employees, shall not be held liable to or through any user for
any loss or damage whatsoever resulting from reliance on the information contained in this document.
Nothing in this document alters the legal obligations, responsibilities or relationship between you and Sage as
set out in the contract existing between us.
This document may contain screenshots captured from a standard Sage system populated with fictional
characters and using licensed personal images. Any resemblance to real people is coincidental and
unintended.
All trademarks and service marks mentioned in this document belong to their corresponding owners.

SP-MULTI-ANL-UG-201804--R022.00

                                                 © Sage 2018                                                  2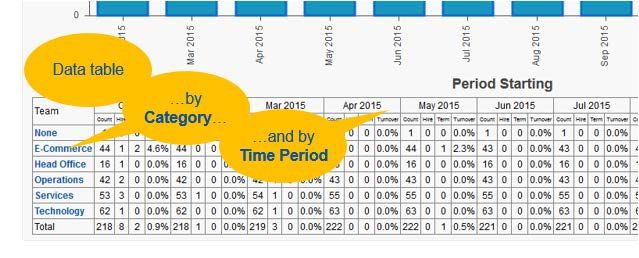
Contents

Contents

About this Guide 4
           Feedback 4

Reports and Dashboards 5

Pre-defined Reports and Dashboards Supplied with HCM 6
           Fairsail Administration 7
           Fairsail Analytics 9
           Fairsail Platform Dashboards 10
           HR Analytics 12
           Performance Management 13
           Salary Planning 14
           Talent Succession Planning 17
           Time Off Management 19
           Training Development 21

Turnover Report 23
           What the Turnover Report Shows 24
           Changing the Time Period 26
           Changing the Data Category 27
           Creating Your Own Data Categories 29
              Example: Group Countries by Region 29
              Example: Exclude Involuntary Leavers 33
              More Example Formulas 37
           Calculations 39
              Example: Turnover Report by Month 40
              Example: Turnover Report by Quarter 43

Pre-defined Reports and Dashboards Supplied with Recruit 44
           Sage People Dashboards (Sage People Recruit) 45
           Sage People Recruit 46

Pre-defined Reports Supplied with Resource Manager 49

Index 50

                                                        © Sage 2018         3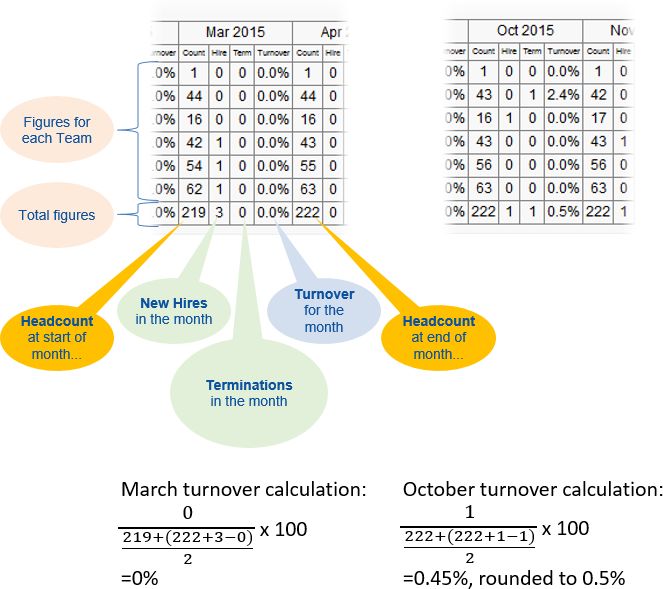
About this Guide
This Guide to the Reports and Dashboards supplied with Sage People provides an overview of the
standard reports and dashboards supplied with these Sage People packages:
• Human Capital Management (HCM)
• Recruit
• Resource Manager

Feedback
Feedback from you on our products and on our documentation is important to us. We seek to incorporate your
ideas in future enhancements to our products, and only by understanding your requirements can we hope to
meet or exceed your expectations.
• To provide comments and suggestions on any aspect of Sage People please email us:
   feedback@support.fairsail.com
• To provide specific feedback on our documentation please email our documentation team:
   documentation@fairsail.com
Thank you!

                                               © Sage 2018                                              4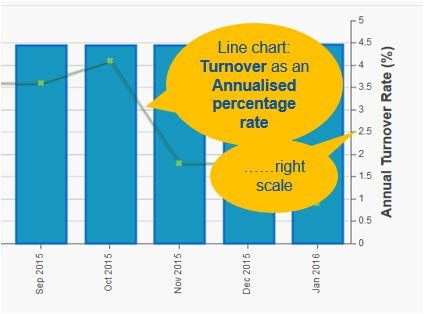
Reports and Dashboards
                                                                                                          Feedback

                                                 Reports and Dashboards
Reports                                                     Dashboards

•   Are available in a range of formats.                    •   Are based on custom reports held in Report Folders.
•   Support multiple objects.                               •   Support up to 20 separate components as graphics.
•   Can be exported to Excel, as data only, or formatted.   •   Use Dashboard Folders to enable sharing.
•   Use Report Folders to enable sharing.                   •   Viewers need access to the Report Folders holding the
                                                                Dashboard component source data.

                                                      © Sage 2018                                                       5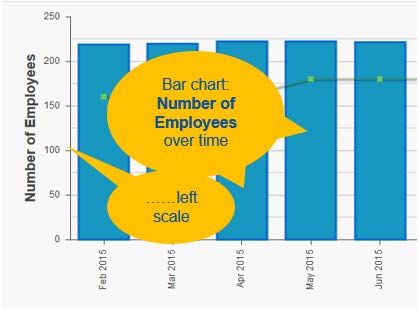
Pre-defined Reports and Dashboards Supplied with HCM
                                                                                               Feedback

            Pre-defined Reports and Dashboards
                             Supplied with HCM
Sage People HCM includes a number of pre-defined reports and dashboards. You can use these as
configured, or re-configure them to meet your exact requirements.
Reports and dashboards are stored in folders:
• Fairsail Administration (see page 7)
   General reports offering a range of Team Member analysis including headcount, absence and vacation
   statistics, starters and leavers, country, department, and manager breakdowns.
• Fairsail Analytics (see page 9)
   Dashboards supporting Performance Management, Salary Planning, Talent Management, and Training
   and Development.
• Performance Management (see page 13)
   Reporting on Objectives, Performance Reviews, and Targets.
• Salary Planning (see page 14)
   Salary and bonus analysis and projections, compensation and benefits analysis.
• Talent Succession Planning (see page 17)
   Team Member age analysis and a range of reports derived from Talent Plan data, including performance,
   potential, and reasons to leave.
• Time Off Management (see page 19)
   Analysis of vacation, sickness, and other absence.
• Training Development (see page 21)
   Analysis of competencies, skills and development needs for Team Members.
• Turnover Report (see page 23)
   A dedicated report enabling you to analyze employee turnover using a number of different bases.

                                                © Sage 2018                                             6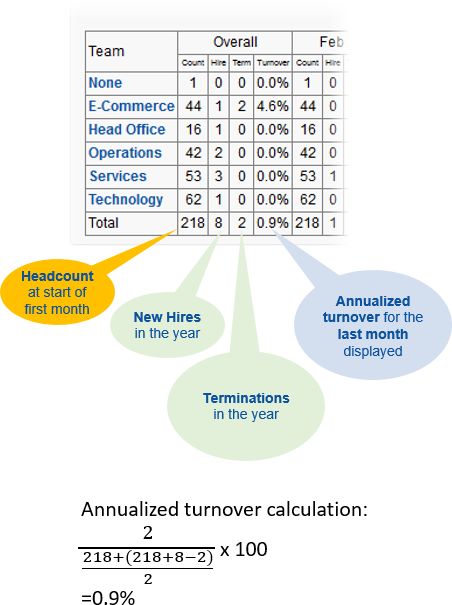
Pre-defined Reports and Dashboards Supplied with HCM
                                                                                        Fairsail Administration

Fairsail Administration

Report                            Description
Action Emails                     Action Events grouped by Action Event Pattern.
Active Users                      All Active Users in your Org with summary information and last login date and time.
Birthdays in Next 60 Days         Team Member birthdays, listed in date order from today's date.
Departments by HR Manager         HR Departments, grouped by HR Manager.
EEO                               Equal Employment Opportunity monitoring, listing team member details including
                                  gender and ethnicity.
HCM Absence / % of Work Time Absence as a percentage of total time worked by team member, summarized by
                             location or by other Team Member, Employment, Absence, or Activity field.
HCM Absence Cost Accrual          Financial cost of absence by Team Member, summarized by function or by other
                                  Team Member, Employment, Absence, or Activity field.
HCM High Potential w High Risk Team Members who are identified on the Talent Plan with high potential and at high
                               risk of leaving. The report also includes the talent plan assessment of the impact of
                               their loss.
HCM Historic Heads & Leavers      Headcount and leavers per quarter over the last year, summarized by division. The
                                  report also displays Team Member details including:
                                  •   Name.
                                  •   Country of employment.
                                  •   Hire date.
                                  •   End date for leavers.
                                  • Function.
HCM Objective Progress            Team Members with their progress against objectives, summarized by progress
                                  (ongoing on track; ongoing above track; closed achieved and so on) or by other
                                  Objective or Team Member field.
HCM Objectives by Department Team Members with their progress against objectives, summarized by department or
                             by other Objective or Team Member field.
HCM Starters by Location          Team Members starting in the last full calendar year, summarized by location.
HCM Starters by Team              Team Members starting in the last full calendar year, summarized by function.
HCM Summary of Employee           Team Member potential as identified on the Talent Plan, summarized by level of
Potential                         potential within country.
HCM Summary of Loss Impact        Team Member impact of loss as identified on the Talent Plan, summarized by risk of
                                  leaving within impact of loss.
HCM Team Members (By              Team Members summarized by country and including a bar chart. The report
Country)                          displays Team Member details including:
                                  HR Department
                                  •   Employment status.
                                  •   Grade.
                                  •   Manager.
                                  •   Continuous service date.
                                  •   Years employment.
                                  •   Salary information.

                                                    © Sage 2018                                                         7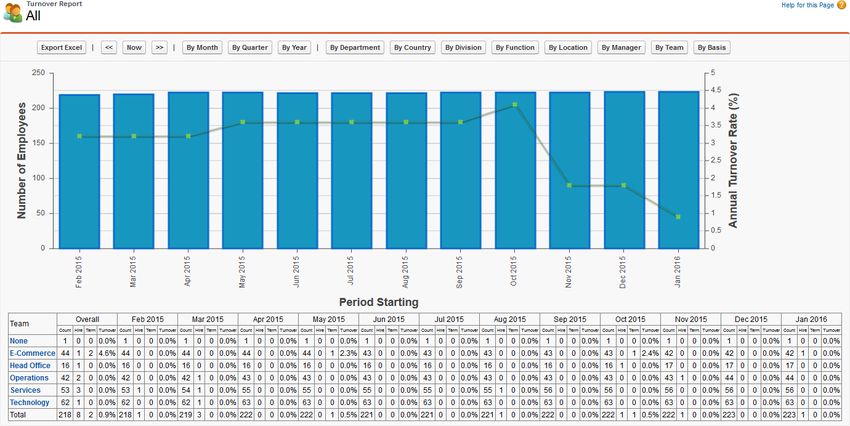
Pre-defined Reports and Dashboards Supplied with HCM
                                                                                  Fairsail Administration

Report                      Description
HCM Team Members (By        Team Members summarized by function. The report displays Team Member details
Department)                 including:
                            •   Country
                            •   Employment status
                            •   Grade
                            •   Manager
                            •   Continuous service date
                            •   Years employment
                            • Salary information.
HRIS Bradford Score         Team Member's absences with their associated Bradford Scores.
Leavers by Location         Team Members who left your organization in the last year, complete with start and
                            end dates. Summarized by location or by other Team Member or Employment
                            Record field.
Leavers by Team             Team Members who left your organization in the last year, complete with start and
                            end dates. Summarized by function (team) or by other Team Member or Employment
                            Record field.
Login Wall of Shame         Active users who have not logged in in the last 30 days.
Logins in Last 30 Days      Active users who have logged in in the last 30 days.
Managers and Team Members   Team Members summarized by Manager. The report also includes:
                            •   Department
                            •   Team Member email
                            •   Personnel number
                            • Total number reporting to each manager.
User Adoption               Analysis of last login data with name, department, division, and job title, over a time
                            period chosen by you.
Users Cumulative Logins     Total number of logins by User name with department, division, and job title, over a
                            time period chosen by you.

                                               © Sage 2018                                                            8
Pre-defined Reports and Dashboards Supplied with HCM
                                                                                           Fairsail Analytics

Fairsail Analytics

Dashboard                     Description
Fairsail Adoption Dashboard   A number of indicators of adoption, looking back over the last 30 days and including:
                              •   Number of users logging in, and total number of users.
                              •   Most active and least active users.
                              •   Graphical display of:
                                  o Cumulative logins
                                 o Proportion of users logging in
HR Analytics                  Basic data including:
                              •   Total headcount
                              •   Salary cost
                              •   Headcount and salary cost by:
                                  o Country
                                  o Division
                                  o Number of years service
                                  o Age range
                                 o Gender
Performance Management        Graphical display of performance indicators including:
                              •   Average performance rating by manager.
                              •   Overall performance as a ratings average.
                              •   Number of performance reviews by country.
                              •   Average performance by department.
                              •   Progress against objectives.
                              • Performance ratings.
Salary Planning               Graphical display including:
                              •   Number of Team Members in each salary band.
                              •   Performance rating by salary band.
                              • Projected salary award totals by manager.
Talent Management             Graphical display including:
                              •   Age ranges by number of years employed.
                              •   Number of Team Members with each Talent Plan potential score.
                              •   Number of Team Members in each Talent Plan Reason to Leave category.
                              • Talent Plan potential ratings against performance rating.
Training and Development      Graphical display including numbers of Team Members:
                              •   With each development need.
                              •   With skills in each skill area.
                              •   With each competency.

                                                  © Sage 2018                                                         9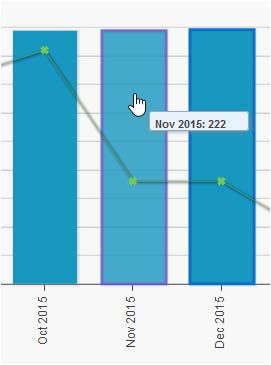
Pre-defined Reports and Dashboards Supplied with HCM
                                                                               Fairsail Platform Dashboards

Fairsail Platform Dashboards

Dashboard                      Description
Platform HCM - Dashboard       Graphical display of basic data including:
                               •   Current headcount by country and by function.
                               •   Leavers by location and by function.
                               •   Summaries of employee potential and impact of loss, by country, taken from
                                   Talent Plan data.
                               •   Progress of objectives in total and by team.
                               •   High potential employees with a high risk of leaving.
                               • Absence as a percentage of hours worked, by location .
Platform Headcount & Leavers   Graphical display including:
                               •   Total number of employees and annualized turnover rate, by month.
                               •   Headcount summary by division, broken down by quarter over the last year.
                               •   Current headcount by country and by function.
                               •   Leavers summary by division, broken down by quarter over the last year.
                               •   Leavers by location and by function.
                               • Starters by location and by function.
Platform Performance           Graphical display of performance indicators including:
Management
                               •   Average performance rating by manager.
                               •   Overall performance as a ratings average.
                               •   Number of performance reviews by country.
                               •   Average performance by department.
                               •   Progress against objectives.
                               • Performance ratings.
Platform Recruit               Graphical display including:
                               •   Application status.
                               •   Total number of active applications.
                               • Number of active vacancies by vacancy type.
Platform Salary Planning       Graphical display including:
                               •   Number of Team Members in each salary band.
                               •   Performance rating by salary band.
                               • Projected salary award totals by manager.
Platform Talent Management     Graphical display including:
                               •   Age ranges by number of years employed.
                               •   Number of Team Members with each Talent Plan potential score.
                               •   Number of Team Members in each Talent Plan Reason to Leave category.
                               •   Talent Plan potential ratings against performance rating.

                                                  © Sage 2018                                                   10
Pre-defined Reports and Dashboards Supplied with HCM
Fairsail Platform Dashboards
Dashboard Description
Platform Training and Graphical display including numbers of Team Members:
Development
• With each development need.
• With skills in each skill area.
• With each competency.
Platform Vacation & Absence Graphical display including:
Management
• Total absence days by location and by function.
• Absence as a percentage of year to date time worked.
• Total vacation days by location and by month.
© Sage 2018 11Pre-defined Reports and Dashboards Supplied with HCM
HR Analytics
HR Analytics
Report Description
Headcount and Salary Current headcount and total annual salary in the reporting currency, by country.
Includes the percentage of the total headcount in each country.
Presented in a table and a graphic.
Headcount by Age Range Current headcount grouped by age range. Includes the total annual salary by
reporting currency, and the percentage of the total headcount in each age range.
Presented in a table and a graphic.
Headcount by Country Current headcount grouped by country. Includes the total annual salary by reporting
currency, and the percentage of the total headcount in each country.
Presented in a table and a graphic.
Headcount by Division Current headcount grouped by division. Includes names, job titles, countries, teams,
the total annual salary by reporting currency, and the percentage of the total
headcount in each division.
Includes a graphic with headcount, the total annual salary by reporting currency, and
the percentage of the total headcount in each division.
Headcount by Gender Current headcount grouped by gender. Includes names, job titles, countries,
divisions, teams, the total annual salary by reporting currency, and the percentage of
the total headcount in each gender.
Includes a graphic with headcount, the total annual salary by reporting currency, and
the percentage of the total headcount for each gender.
Headcount by Service Years Current headcount grouped by length of service in years. Includes names, job titles,
countries, divisions, teams, employee ages, the total annual salary by reporting
currency, and the percentage of the total headcount for each number of years
service.
Includes a graphic with headcount, the total annual salary by reporting currency, and
the percentage of the total headcount for each number of years service.
Point in Time Headcount Current headcount including all employees who:
• Started before or during the last month.
• Are currently employed or who finished employment in the last month.
© Sage 2018 12Pre-defined Reports and Dashboards Supplied with HCM
Performance Management
Performance Management
Report Description
Current Performance Review Performance Reviews analyzed by manager for the most recent completed Team
Bias Member reviews. The report uses standard deviation and difference from ideal mean
to reveal overly harsh or overly generous reviews.
Draft Performance Review Bias Performance Reviews analyzed by manager for uncompleted Team Member
reviews. The report uses standard deviation and difference from ideal mean to reveal
overly harsh or overly generous reviews.
Objectives at risk Objectives summarized by progress category: ongoing above track; ongoing on
track; ongoing below track; closed completed and so on.
The report includes a bar chart showing progress category broken down by
department.
Objectives by action due Objectives summarized by action: manager approve or edit; manager review; team
member confirm or edit and so on.
The report includes:
• Team Member department and manager
• Objective name.
• Objective start and end dates.
• Next objective review date.
Performance by Department Average performance scores drawn from completed performance reviews and
summarized by HR Department.
Performance Review Current performance review ratings summarized by country. The report shows the
Distribution number of Team Members rated in each category from Development Need to
Exceeds Expectations, broken down by country and with the total number of rated
Team Members in each country.
The report includes a bar chart showing rating category by country.
Targets Multicurrency Sales targets and actuals by Team Member, summarized by manager. The report
includes:
• Target name.
• Target currency.
• Target value for the financial year in local and reporting currencies.
• Actuals for the year to date in local and reporting currencies.
• Percentage achieved for the year to date.
• Progress: above track, on track and so on.
© Sage 2018 13Pre-defined Reports and Dashboards Supplied with HCM
Salary Planning
Salary Planning
Report Description
Bonus Projection Projected value of planned bonuses for all Team Members, summarized by
manager. The report also displays:
• Current annualized salary.
• Bonus percentage.
Compensation and Benefits Annualized value of Team Members' salary and benefits in your organization's
reporting currency. Summarized by country.
Individual benefits are listed for each Team Member, along with the value of each
benefit, and the total value of all benefits.
Employee Cost By Country Annualized cost of all Team Members by country in your organization's reporting
currency.
The report displays for each country:
• Total annual salary.
• Total benefits.
• Average per Team Member.
The report also displays grand totals for your complete organization.
HCM Salary History The most recent salary review awarded to each Team Member. The report displays:
• Annual salary in local and reporting currencies.
• Salary record number (linked to the salary record).
• Salary amount following the last salary award, per paid time unit; for hourly paid
employees this is an hourly amount. In local and reporting currencies.
• Annualized salary amount following the last salary award, in local and reporting
currencies.
• Exchange rate used to convert local to reporting currency.
• Date and time of the last currency recalculation.
• Reason for the last salary award.
HCM Team Members (By Sal Team Member position against salary band as a percentage, summarized by
Band Position) country. The report displays:
• Work Days Pattern.
• Department.
• Employment status.
• Grade.
• Manager.
• Continuous service date.
• Salary band position as a percentage.
• Years employment.
• Annual salary, in local and reporting currencies.
• Salary currency.
• Average salary band position for the country.
The report includes a bar chart displaying average salary band percentage by
country.
© Sage 2018 14Pre-defined Reports and Dashboards Supplied with HCM
Salary Planning
Report Description
Proposed Salary Increases Proposed but not yet approved salary increases for all Team Members, summarized
by manager. For each Team Member the report displays:
• Name.
• Current salary.
• Proposed increase amount and percentage.
• High projection amount and percentage.
• Rationale.
Salary Point in Time Team Member salaries on a specified date. For today's date configure the filter logic
as follows:
Filter Logic: 1 AND (2 OR 3)
1. Start Date less or equal ""
3. Next Start Date equals ""
For each Team Member the report displays:
• Name.
• Country and Location.
• HR Department.
• Job Title.
• Employment Status.
• Manager.
• Annual Salary at the date specified.
• Salary Currency.
• Start Date for the salary.
• Next Salary Start Date.
• Previous Salary Start Date.
Salary Position in Bands Team Member distribution by Salary Band, with each Team Member's position
indicated by Salary Band Quarter. For each Salary Band the report displays:
• Salary Band Name.
• Number of employees per Salary Band Quarter.
• Total number of employees per Salary Band.
• Team Member Name.
• Salary Currency Name.
• Current Annual Salary in local and reporting currencies.
• Bottom and top values.
• Overall grand total number of employees in all salary band quarters.
The report includes a bar chart showing employee distribution by Salary Band
Quarter within Salary Band.
Salary Position vs. Team Member numbers allocated to each Salary Band Quarter, broken down by
Performance Rating Performance Review Rating.
The report includes a stacked bar chart.
© Sage 2018 15Pre-defined Reports and Dashboards Supplied with HCM
Salary Planning
Report Description
Salary Projection Current Team Member salary projections with current Performance Review Ratings,
Review summarized by manager.
For each Team Member the report displays:
• Current Salary Start Date.
• Annual Salary.
• Salary Band position as a percentage.
• Performance Rating.
• Low and High Salary Projection Percentages.
• Low and High Salary Projection Amounts.
The report includes a bar chart showing the total high projection increase amounts
per manager.
Time Since Salary Increase v Number of months since the last salary change for each of the current Talent Plan
Performance Performance Rating groups. The report offers full drill down.
© Sage 2018 16Pre-defined Reports and Dashboards Supplied with HCM
Talent Succession Planning
Talent Succession Planning
Report Description
Age Range of Team Members Team Members summarized by age range.
The report displays the number of Team Members in each 5 year age band: 15 to 19
years old, 20 to 24, and so on. Drill down by any Team Member field within age band.
The report includes a funnel chart.
Age vs Years Employed Team Members in each age range, broken down by the number of years they have
worked for your organization. Drill down by any Team Member field within age band.
The report includes a stacked bar chart.
Talent Plan People to Retain Team Members identified in the Talent Plan as high performers with high or medium
potential, and with a high or medium risk of leaving. For each identified Team
Member the report displays:
• Manager.
• Current Talent Plan number, linked to the Talent Plan.
• Current Talent Plan Performance Rating and Potential.
• Current Talent Plan Risk of Leaving.
• Assessed Impact of Loss.
The report includes a bar chart showing the number of Team Members in each
Reason to Leave category.
Talent Plan Performance vs Number of Team Members displayed in a matrix of potential against performance
Potential rating, derived from the Talent Plan. Select high, medium, or low potential and drill
down by any Team Member or Talent Plan field.
Talent Plan Reason to Leave by Number of Team Members summarized by manager for each of the Talent Plan
Manager Reasons to Leave. Select managers and drill down by any Team Member or Talent
Plan field.
Team Members By Team Members summarized by average competency assessment score. For each
Competencies identified Team Member the report displays:
• Country.
• Team.
• Report Line.
Select a Team Member and drill down by a range of fields from the Talent Plan,
Performance Review, Competency Assessment, Salary, Employment, or Team
Member records.
Team Members By Team Members summarized by Talent Plan Performance Rating. For each identified
Performance Team Member the report displays:
• Country.
• Team.
• Report Line.
Select a performance rating and drill down by a range of fields from the Talent Plan,
Performance Review, Competency Assessment, Salary, Employment, or Team
Member records.
© Sage 2018 17Pre-defined Reports and Dashboards Supplied with HCM
Talent Succession Planning
Report Description
Team Members By Potential Team Members summarized by Talent Plan Potential. For each identified Team
Member the report displays:
• Country.
• Team.
• Report Line.
Select a potential rating and drill down by a range of fields from the Talent Plan,
Performance Review, Competency Assessment, Salary, Employment, or Team
Member records.
© Sage 2018 18Pre-defined Reports and Dashboards Supplied with HCM
Time Off Management
Time Off Management
Report Description
FMLA Balance Remaining Team Members who have taken FMLA qualifying leave in the last 12 months, with the
amount taken and the permitted balance outstanding.
Balance outstanding is displayed as a rolling total, typically as a number of hours
remaining from the 12 week permitted FMLA total in any rolling 12 month period.
You can select Team Members and drill down by a range of Employment Record and
Absence fields.
HCM Absence by Location & Team Member approved absences summarized by location and then by month. For
Month each Team Member absence the report displays:
• Team Member full name.
• Country.
• Employment Status.
• Reason for absence.
• End Date.
• Duration.
• HR Department.
• Status of the absence request: confirmation that it has been approved.
Total durations are displayed for each location and for each month within location.
HCM Absence by Team Member Team Member approved absences. For each absence the report displays:
• Country.
• Employment Status.
• Reason for absence.
• Start Date
• End Date.
• Duration.
• Location.
• HR Department.
• Status of the absence request: confirmation that it has been approved.
HCM Absences by Team & Team Member approved absences summarized by team and then by month. For
Month each Team Member absence the report displays:
• Team Member full name.
• Country.
• Employment Status.
• Reason for absence.
• End Date.
• Duration.
• Location
• Status of the absence request: confirmation that it has been approved.
Total durations are displayed for each team and for each month within team.
© Sage 2018 19Pre-defined Reports and Dashboards Supplied with HCM
Time Off Management
Report Description
HCM Vacation Days by Month Team Member vacation taken by month, summarized by HR Department. For each
vacation month the report displays:
• Team Member full name.
• Country.
• Employment Status.
• Reason.
• End Date.
• Duration.
• Vacation allowance per year.
• Status of the vacation request: approved, pending and so on.
Total durations are displayed for each HR Department and for each month within HR
Department.
The report includes a pie chart displaying vacation days taken per month.
HCM Absence Team Member approved absences summarized by location. For each absence the
report displays:
• Team Member full name.
• HR Department.
• Country.
• Employment Status.
• Reason.
• Start and End Dates.
• Duration.
• Status of the absence request: confirmation that it has been approved.
Total durations are displayed for each location.
HCM Vacation Team Member vacation summarized by location. For each vacation the report
displays:
• Team Member full name.
• HR Department.
• Country.
• Employment Status.
• Reason.
• Start and End Dates.
• Duration.
• The Team Member's vacation allowance per year.
• Status of the vacation request: approved, pending and so on.
Total durations are displayed for each location, and a grand total at the bottom of the
report.
You can select a location and drill down by Team Member, Employment Record,
Absence, or Activities fields.
The report includes a pie chart summarizing vacation by location.
© Sage 2018 20Pre-defined Reports and Dashboards Supplied with HCM
Training Development
Training Development
Report Description
Average Competencies All competencies defined for your organization with average Team Member scores
for each.
You can select competencies and drill down on competency and competency
assessment fields.
The report includes a bar chart, showing competency strengths and weaknesses
across your organization.
Competency Assessment by Currently active competency assessments summarized by Action due. Possible
Action Due actions include:
• Manager: Start
• Team Member: Start
• Manager: Manager Assessment
• Team Member: Self Assessment
• Manager: Close
• Team Member: Close
For each assessment the report displays:
• Team Member name.
• Start, Close, and End Dates
• A Team Member Active check box.
• A Manager Active check box.
• The number of other assessors active.
You can select an Action type and drill down by Competency Assessment or Team
Member fields.
Development Needs and Team Development Needs summarized by area and broken down by item within each area.
Members For each item the report displays:
• Team Member names identified with the development need.
• Team Member's Manager.
• Team Member's department.
You can select an item and drill down by Development Need or Team Member field.
The report includes a bar chart showing the number of Team Members with
development needs in each area.
Skills and Team Members All skills defined for your organization summarized by area. For each area the report
displays the number of Team Members with skills in that area, and for each skill
within area, the number of Team Members with that skill.
Each Skill is linked to the Skill Library Item detail page, enabling you to display the list
of Team Members with that skill.
You can select an area and drill down by Skill or Team Member field.
The report includes a bar chart showing the number of Team Members with skills in
each area.
Team Members by Competency All competencies defined for your organization with the scores for each Team
Scores Member assessed against each competency. Average scores are also displayed for
each competency.
You can select a competency and drill down by Team Member, Competency,
Competency Assessment, Indicator, or Indicator Comment.
© Sage 2018 21Pre-defined Reports and Dashboards Supplied with HCM
Training Development
© Sage 2018 22Turnover Report
The Sage People Turnover report provides comprehensive analysis of employee turnover, drawing on team
member data held in Sage People HCM. The default format enables you to display the data using a range of
bases, and you can further customize your analysis by selecting fields from a field set to break the data down
differently.
To display the Turnover report:
1. In WX go to the address bar and enter:
fhcm2__turnover
immediately following apex/
For example:
https://fhcm2.eu2.visual.force.com/apex/fhcm2__turnover
2. Select Enter.
© Sage 2018 23Turnover Report
What the Turnover Report Shows
What the Turnover Report Shows
© Sage 2018 24Turnover Report
What the Turnover Report Shows
© Sage 2018 25Turnover Report
Changing the Time Period
Changing the Time Period
The Turnover report displays a window of data drawn from 12 consecutive time periods, and defaults to
monthly data running back from the most recent complete period. Select the buttons to change the frequency
of the analysis:
• By Quarter
Displays data for every third month, running back for 12 quarters from the most recently completed 3-month
period.
For example, running the report in mid-February 2016 displays data for January 2016, October 2015, and
so on, back to April 2013.
• By Year
Displays data for every twelfth month, running back for 12 years from the most recently completed
12-month period.
For example, running the report in mid-February 2016 displays data for January 2014, January 2013, and
so on, back to January 2005.
Use the scroll buttons to move the
display window backwards or
forwards one time period at a time.
The window remains 12 time periods
wide:
Select Now to redisplay the report
running back from the most recently
completed time period:
© Sage 2018 26Turnover Report
Changing the Data Category
Changing the Data Category
The Turnover report bar chart shows the total number of employees per time period. The data table breaks that
data down by category and displays one row of data for each item in the category, unassigned employees in a
None group at the top, then in alphabetical order from top to bottom:
Select the buttons to change the break down category. By default you can choose from:
• By Basis
The Team Member's employment basis such as Full Time, Part Time, Hourly, Salaried. Displays the value
in the Basis field from the Team Member's current Employment Record.
• By Country
The Country field from the Team Member record.
• By Department
HR Departments defined for your organization that have employees assigned to them. HR Departments
with no employees are ignored.
• By Division
The Division field from the Team Member record.
• By Function
The Team Member's Job Function: the Function field from the Team Member record.
• By Location
The Location field from the Team member record.
• By Manager
The Team Member's current primary manager: the Manager field from the Team Member record.
© Sage 2018 27Turnover Report
Changing the Data Category
• By Team
The Team field from the Team member record.
You can change the order in which the buttons are displayed, add or remove buttons by using the Turnover
field set on the Team Member object.
In addition to the default category buttons, the Turnover field set includes:
Field Description
Age Range Age, calculated from Birth Date and today's date, rounded down to the last completed whole
number multiple of five years. So an Age of 39 years gives an Age Range of 35.
Business The Business field from the Team member record.
Citizenship The country from which the Team member claims citizenship. The Citizenship field from the
Team member record. Team Members with no entry in this field are returned as Citizenship
None.
Employment Status For example, Active, Temporary, Left. The Employment Status field from the Team
Member record.
Ethnicity The Ethnicity field from the Team Member record. Team Members with no entry in this field
are returned as Ethnicity None.
Gender The Gender field from the Team Member record. Team Members with no entry in this field
are returned as Gender None.
Generation The Generation field from the Team Member record. Generation uses a formula based on
Birth Date to assign employees to generations X, Y, or Z. Team Members with no entry in
this field are returned as Generation None.
Grade The employment grade the Team Member has in your organization. The Grade field from
the Team Member record. Ungraded Team Members are returned as Grade None.
Job Title The Job Title field from the Team Member record. Team Members with no entry in this field
are returned as Job Title None.
Probation Period End The Probation Period End Date field from the Team member record. Team Members with
Date no entry in this field are returned as Probation Period End Date None.
Year Employed The number of years each employee has worked for the organization. The Year Employed
field from the Team Member record. Year Employed uses a formula based on the
Employment Record Continuous Service Date to calculate the number of years
employment.
Years Employed Employees are classified into five year blocks of completed employment - 0, 5, 10, 15, and
Range so on. The Years Employed Range field from the Team Member record. Years Employed
Range uses a formula to round the number of years employed down to the last completed
whole number multiple of five years.
You can also create your own Data Categories using formula fields (see page 29).
© Sage 2018 28Turnover Report
Creating Your Own Data Categories
Creating Your Own Data Categories
In addition to the default fields available in the Team Member Turnover Field Set, you can create your own
formula fields to use as Turnover Report data categories. In summary:
1. Create a new Custom Field, typically on the Team Member or Employment Record objects, using the
Formula Data Type.
The field is automatically added to the list of fields available for the Turnover Field Set.
2. Edit the Turnover Field Set by dragging and dropping the new field into the Field Set.
The new field is automatically added as a data category button on the Turnover report.
3. Select the new Data Category button to group data in line with the formula you created.
Example: Group Countries by Region
Purpose
To group employees by geographic region based on the Country field (fHCM2__Country__c) as recorded in
their Team Member records. This example uses the regions:
• APAC (Asia Pacific)
• EMEA (Europe, Middle East, Africa)
• NA (North America)
Team Member records showing countries not assigned to these regions display under the country names.
How
1. Go to Setup > App Setup > Create > Objects.
2. Select the Label for the Team Member object.
3. In Custom Fields &
Relationships, select
New:
Sage People displays the New Custom Field wizard.
4. Select the Formula Data Type:
© Sage 2018 29Turnover Report
Creating Your Own Data Categories
5. Select Next.
6. In Field Label enter Region.
Sage People automatically completes Field Name with the Field Label you entered.
7. Select the Text Formula Return Type:
8. Select Next.
9. In Region (Text) enter the formula:
CASE(fHCM2__Country__c ,
"Canada", "NA",
"China", "APAC",
"Denmark", "EMEA",
"France", "EMEA",
"Germany", "EMEA",
"Ireland", "EMEA",
"Singapore", "APAC",
"Sweden", "EMEA",
"UK", "EMEA",
"USA", "NA",
fHCM2__Country__c)
© Sage 2018 30Turnover Report
Creating Your Own Data Categories
10. In Description enter:
To group Countries by region.
11. In Help Text enter:
Groups Team Members by geographic region using the Country field.
12. Select Next.
13. Set field-level security for the new field to enable access by users assigned to Profiles you want to be able
to run the Turnover report.
Typically, set Fairsail Administrator and Fairsail HR Manager to visible, all other Profiles clear:
14. Select Next.
15. In Add to page layouts, uncheck all Page Layouts unless you want to add the Region field by default to a
page layout:
16. Select Save.
Sage People displays the Team Member Custom Object page.
17. Select Field Sets and select Edit for the Turnover Field Set:
© Sage 2018 31Turnover Report
Creating Your Own Data Categories
18. Drag and drop the Region field into the Field Set:
19. Select Save.
20. Go to the Turnover Report and select By Region:
The data table displays the newly defined regional grouping:
© Sage 2018 32Turnover Report
Creating Your Own Data Categories
Example: Exclude Involuntary Leavers
Purpose
To exclude involuntary terminations from the Turnover Report based on the Reason For Leaving field
(Reason_For_Leaving__c) as recorded in their Team Member records. This example also excludes Team
Members with either:
• The Job Title Intern
• The Full Name Test
How
1. Go to Setup > App Setup > Create > Objects.
2. Select the Label for the Employment Record object.
3. In Custom Fields & Relationships, select New:
Sage People displays the New Custom Field wizard.
4. Select the Formula Data Type:
5. Select Next.
6. In Field Label enter Exclude Involuntary.
Sage People automatically completes Field Name with the Field Label you entered.
© Sage 2018 33Turnover Report
Creating Your Own Data Categories
7. Select the Text Formula Return Type:
8. Select Next.
9. In Exclude Involuntary (Text) enter the formula:
IF
(ISPICKVAL
(Reason_For_Leaving__c, "Involuntary")
|| CONTAINS
(fHCM2__Team_Member__r.fHCM2__Job_Title__c, "Intern")
|| CONTAINS
( fHCM2__Team_Member__r.fHCM2__Name_Full__c, "Test"),
"Yes",
"No")
10. In Description enter:
To identify Involuntary leavers, interns, and test users.
© Sage 2018 34Turnover Report
Creating Your Own Data Categories
11. In Help Text enter:
Returns Yes if Reason for leaving is Involuntary, Job Title is Intern, or Full Name is Test. Otherwise
returns No.
12. Select Next.
13. Set field-level security for the new field to enable access by users assigned to Profiles you want to be able
to run the Turnover report.
Typically, set Fairsail Administrator and Fairsail HR Manager to visible, all other Profiles clear:
14. Select Next.
15. In Add to page layouts, uncheck all Page Layouts unless you want to add the Region field by default to a
page layout:
16. Select Save.
Sage People displays the Team Member Custom Object page.
17. Select Field Sets and select Edit for the Turnover Field Set:
© Sage 2018 35Turnover Report
Creating Your Own Data Categories
18. In the left panel select Current Employment to display the fields in the Employment Record.
19. Drag and drop the Exclude Involuntary field into the Field Set:
20. Select Save.
21. Go to the Turnover Report and select By Exclude Involuntary:
The data table displays the newly defined regional grouping:
© Sage 2018 36Turnover Report
Creating Your Own Data Categories
More Example Formulas
Follow the steps in the full examples to create a formula field (see page 29). Use the example formulas in this
section to help you create the formula to display the data category you want on the Turnover Report.
Identify Employees in a given Country and Contractors
Purpose
To identify employees in China and all contractors working with Full Time Equivalent values of less than 1.
Special fields
On the Employment Record, two formula fields:
• Include Contractors1
IF(ISPICKVAL(Contract_Type__c, "Indefinite") && (ISPICKVAL(fHCM2__Basis__c,
"Contractor")),
IF(fHCM2__FTE__c >=1,"Include","Exclude"),
"")
Evaluates special picklist field Contract Type and generic picklist field Basis to identify Contractors with
Contract Type Indefinite, then evaluates the FTE values for those contractors.
Returns Include for those Indefinite Contractors who are full time, and Exclude for those who are less
than full time. Returns null if those conditions are not met.
• Include Contractors2
IF(ISPICKVAL(Contract_Type__c, "Definite") && (ISPICKVAL(fHCM2__Basis__c, "Contractor")
&& Contract_Length_Days__c >=90),
IF(fHCM2__FTE__c >=1,"Include","Exclude"),
"")
Evaluates special picklist field Contract Type, generic picklist field Basis, and special field Contract
Length Days to identify Contractors with Contract Type Definite and a Contract Length of 90 days or
more, then evaluates the FTE values for those contractors.
Returns Include for those Definite Contractors with contracts of 90 days or more who are full time, and
Exclude for those who are less than full time. Returns null if those conditions are not met.
Formula
IF(fHCM2__Country__c = "China" || fHCM2__Current_Employment__r.Include_Contractors1__c
= "Exclude" || fHCM2__Current_Employment__r.Include_Contractors2__c = "Exclude",
"Contract & China", "All Other Employees")
• Evaluates Country and returns Contract & China when Country is China. Returns All Other Employees
when Country is not China.
• Evaluates Include Contractors1 and returns Contract & China when the value is Exclude. Returns All
Other Employees when value is not Exclude.
Evaluates Include Contractors2 and returns Contract & China when the value is Exclude. Returns All
Other Employees when value is not Exclude.
© Sage 2018 37Turnover Report
Creating Your Own Data Categories
Identify Key Talent
Purpose
To identify high value employees using Talent Plan ratings.
Formula
IF(ISPICKVAL(fHCM2__Current_Talent_Plan__r.fHCM2__Potential__c, "High") ||
ISPICKVAL(fHCM2__Current_Talent_Plan__r.fHCM2__Performance_Rating__c, "Exceeds
Expectations") ||
(IF(ISPICKVAL(fHCM2__Current_Talent_Plan__r.fHCM2__Impact_of_Loss__c, "N/A") ||
ISPICKVAL(fHCM2__Current_Talent_Plan__r.fHCM2__Impact_of_Loss__c, "High") ||
ISPICKVAL(fHCM2__Current_Talent_Plan__r.fHCM2__Impact_of_Loss__c, "Medium"), 0,
VALUE(LEFT(TEXT(fHCM2__Current_Talent_Plan__r.fHCM2__Impact_of_Loss__c),1))) >= 7),
"Key Talent",
"All Others")
• Evaluates Talent Plan Potential rating and returns Key Talent when Potential is High.
• Evaluates Talent Plan Performance Rating and returns Key Talent when Rating is Exceeds
Expectations.
• Evaluates Talent Plan Impact of Loss and returns Key Talent when Impact of Loss is High, Medium, or
N/A.
Early Talent Plans used Impact of Loss text values in the picklist.
• Evaluates Talent Plan Impact of Loss and returns Key Talent when Impact of Loss is 7 or above.
More recent Talent Plans use a numeric rating from 1 to 9.
Returns All Others when none of evaluated fields returns Key Talent.
Identify Employees in a given Country and Voluntary Leavers
Purpose
To identify employees in India and all voluntary leavers.
Formula
IF(fHCM2__Current_Employment__r.fHCM2__Reason_For_Leaving__c "Involuntary" ||
fHCM2__Country__c = "India","Voluntary & India","All Others")
• Evaluates Reason For Leaving and returns Voluntary & India when Reason For Leaving is not
Involuntary.
• Evaluates Country and returns Voluntary & India when Country is India.
Returns All Others when the evaluated fields contain any other values.
© Sage 2018 38Turnover Report
Calculations
Calculations
Staff or labor turnover is the rate at which an employer organization loses employees, expressed as a
percentage of headcount and typically annualized. A general form of the calculation of turnover is:
To calculate turnover as displayed in the Turnover Report, Sage People uses:
• Headcount
• New hires during the periods under review - months, quarters, or years.
A new hire is an employee with a Current Employment Start Date during the period, and no End Date.
• Terminations during the periods under review.
A termination is an employee with a Current Employment End Date during the period.
The Turnover report displays headcount against annualized turnover for a range of time periods, as well as
turnover figures for each month, quarter, or year.
The formula used to calculate turnover for each period is:
Period turnover % =
where:
Average Headcount =
where:
Value at end of period =
where:
New hires
All employees with Current Employment Start Date during the month, and no End Date.
Terminations
All employees with Current Employment End Date during the month.
The formula used to calculate overall turnover is:
Overall turnover % =
where:
Average Headcount =
where:
Value at end of period =
© Sage 2018 39Turnover Report
Calculations
Example: Turnover Report by Month
1. With Sage People WX displayed, go to the address bar and enter:
turnover
immediately following apex/
For example:
https://fhcm2.eu2.visual.force.com/apex/turnover
2. With the Turnover Report displayed, select By Month.
3. Use the scroll buttons and to select the time period you want to display. The chart and data
table remain 12 months wide.
The example uses data from February 2015 to January 2016.
For each month in the display, the chart shows:
• A total headcount bar.
• An annualized turnover rate line.
Hover to display data values:
© Sage 2018 40Turnover Report
Calculations
For each month the data table shows:
Monthly turnover figures are not shown on the chart.
© Sage 2018 41Turnover Report
Calculations
For the overall report the data table shows figures for the whole period:
All annualized turnover data points displayed on the line chart use the same calculation method:
1. Calculate the average headcount over the previous 12 months:
a. Take the starting headcount 12 months ago.
b. Calculate the headcount at the end of the 12 month period by adding the total number of new hires and
subtracting the total number of terminations.
c. Add the starting headcount and the headcount at the end of the 12 months and divide by 2.
2. Take the total number of terminations in the previous 12 months and divide it by the average headcount
over the previous 12 months.
3. Multiply the result by 100 to convert it to a percentage.
When repeated for each month through the year the calculation produces a rolling, month by month series of
annualized turnover figures.
© Sage 2018 42Turnover Report
Example: Turnover Report by Quarter
1. With Sage People WX displayed, go to the address bar and enter:
turnover
immediately following apex/
For example:
https://fhcm2.eu2.visual.force.com/apex/turnover
2. With the Turnover Report displayed, select By Quarter.
3. Use the scroll buttons and to select the time period you want to display. The chart and data
table remain 12 quarters wide.
The calculation uses the same logic as that for monthly data (see page 40); in place of months, substitute
quarters. Each annualized turnover data point displayed on the line chart use the same calculation method:
1. Calculate the average headcount over the previous 12 quarters:
a. Take the starting headcount 12 quarters ago.
b. Calculate the headcount at the end of the 12 quarter period by adding the total number of new hires and
subtracting the total number of terminations.
c. Add the starting headcount and the headcount at the end of the 12 quarters and divide by 2.
2. Take the total number of terminations in the previous 12 quarters and divide it by the average headcount
over the previous 12 quarters.
3. Multiply the result by 100 to convert it to a percentage.
When repeated for each quarter through the year the calculation produces a rolling, quarter by quarter series of
annualized turnover figures.
© Sage 2018 43Pre-defined Reports and Dashboards Supplied with Recruit
Pre-defined Reports and Dashboards
Supplied with Recruit
Sage People Recruit includes a number of pre-defined reports and dashboards. You can use these as
configured, or re-configure them to meet your exact requirements.
Sage People Recruit reports and dashboards are stored in folders:
• Sage People Dashboards (Installed Package: Sage People Recruit) (see page 45)
Dashboards displaying a range of information from Sage People HCM including:
o Headcount, leavers and starters.
o Performance management
o Vacation and absence.
...as well as basic Recruit statistics on applications and vacancies, and Resource Planning data including
salary budgets, employee turnover, and resource needs.
• Sage People Recruit (see page 46)
Information on vacancies, applications, candidates, assessments, interviews, and more.
© Sage 2018 44Pre-defined Reports and Dashboards Supplied with Recruit
Sage People Dashboards (Sage People Recruit)
Sage People Dashboards (Sage People Recruit)
Dashboard Description
HCM - Dashboard Graphical display including:
• Current headcount by country and by function.
• Leavers by location and by function.
• Year to date starters by team and by function.
• Total absence days by location and by function.
• High potential employees with a high risk of leaving.
• Summaries of employee potential and impact of loss, by country, taken from
Talent Plan data.
• Progress of objectives in total and by team.
HCM - Performance Graphical display including:
Management
• Progress against objectives for all departments, and by department.
• Summaries of employee potential and impact of loss, by country, taken from
Talent Plan data.
• High potential employees with a high risk of leaving.
HCM - Vacation & Absence Graphical display including:
Management
• Total absence days by location and by function.
• Absence as a percentage of year to date time worked.
• Total vacation days by location and by month.
HRIS - Headcounts & Leavers Graphical display including:
• Total number of employees and annualized turnover rate, by month.
• Headcount summary by division, broken down by quarter over the last year.
• Current headcount by country.
• Leavers summary by division, broken down by quarter over the last year.
• Leavers by location and by function.
• Starters by location and by function.
Recruit Dashboard Graphical display including:
• Application status.
• Total number of active applications.
• Number of active vacancies by vacancy type.
Resource Planning Graphical display including:
• Budgeted salary against actual salary by team and by job title.
• Total number of employees and annualized turnover rate, by month.
• Resource Need status.
© Sage 2018 45Pre-defined Reports and Dashboards Supplied with Recruit
Sage People Recruit
Sage People Recruit
Report Description
Aged Applications All current Applications summarized by Assessor and showing the number of days
since the application was last modified. For each Application the report displays:
• Candidate Name. Select to jump to the candidate record.
• Application Number. Select to jump to the application record.
• Vacancy applied for. Select to jump to the vacancy record.
• Days since modification.
• Status of the application: New, ongoing, and so on.
• Current Stage. Select to jump to the detail page for the stage.
For each assessor the report displays maximum, minimum, and average number of
days since last modification.
You can select an assessor and drill down by Application fields.
The report includes a bar chart showing average days since modification for each
assessor.
Application Status All current Applications summarized by status: new, ongoing, not this vacancy and so
on. For each Application the report displays:
• Candidate Name. Select to jump to the candidate record.
• Application Number. Select to jump to the application record.
• Vacancy applied for. Select to jump to the vacancy record.
• Total score achieved by the candidate for all selection criteria.
• Average score achieved by the candidate for selection criteria.
• Rating indicator.
• Number of selection criteria assessed at below the level needed for the role.
For each status the report displays the number of applications.
You can select a status and drill down by Application fields.
The report includes a pie chart showing the number of applications by status.
Assessed Criteria Assessed selection criteria summarized by candidate, and by selection stage within
candidate. For each criteria the report displays:
• Assessment stage at which the criteria is measured.
• Average score achieved by the candidate across all selection stages at which the
criteria is measured. Highlighted green if on or above the level needed,
highlighted red if below the level needed.
• Score for the criteria at each stage.
• Number of scores below the desired level (may not result in rejection).
• Number of scores below the required level (can result in automatic rejection).
• Comments.
For each candidate the report also displays an overall average score, highlighted
green if on or above the level needed, highlighted red if below the level needed.
The report includes a bar chart showing shortlisted candidates and the average
scores they have achieved for assessed criteria.
© Sage 2018 46Pre-defined Reports and Dashboards Supplied with Recruit
Sage People Recruit
Report Description
Criteria Scores Selection criteria used by your organization and the average scores achieved by
candidates across all applications.
You can select criteria and drill down by Application, Criteria Assessment, or Criteria
Library Item field.
The report includes a bar chart showing selection criteria and the average scores
achieved for each.
Interviews Interviews scheduled for all dates up to and including today. For each interview the
report displays:
• Candidate name. Select to jump to the Candidate record.
• Application number. Select to jump to the Application record.
• Vacancy name. Select to jump to the Vacancy record.
• Interview date.
• Interviewer. Select to jump to the interviewer's user record.
• Interview location.
• Interview duration.
Recruit Total Applicant Funnel All current applications summarized by current assessment stage. For each
application the report displays:
• Application Number. Select to jump to the application.
• Candidate Name.Select to jump to the candidate.
• Candidate email. Select to create an email to the candidate's address in your
default email application.
• Recruiter. Select to jump to the recruiter's user record.
• Status of the application.
For each stage the report displays the total number of applications at that stage.
You can select a stage and drill down by Application or Vacancy fields.
Recruit - Vacancy Type by Current vacancies summarized by status, and by role type within status.. For each
Status vacancy the report displays:
• Candidate Name. Select to jump to the candidate record.
• Current assessment stage for each candidate.
• Vacancy name. Select to jump to the vacancy record.
• Vacancy location.
• Vacancy status.
You can select a status and drill down by Application or Vacancy fields.
Stages Reached Candidates summarized by current stage in the assessment process, and by
vacancy within stage. For each candidate the report displays:
• Current assessor. Select to jump to the assessor's user record.
• Candidate name. Select to jump to the candidate record.
• Application number. Select to jump to the application record.
• Average score achieved by the candidate.
• Rating indicator for the candidate.
• Total score achieved by the candidate.
• Status of the application.
You can select a stage and drill down by Application or Current Stage fields.
© Sage 2018 47You can also read