ZipcodeR: advancing the analysis of spatial data at the ZIP code level in R.
←
→
Page content transcription
If your browser does not render page correctly, please read the page content below
Please do not remove this page

zipcodeR: advancing the analysis of spatial data
at the ZIP code level in R.
Rozzi, Gavin C.
https://scholarship.libraries.rutgers.edu/discovery/delivery/01RUT_INST:ResearchRepository/12663159860004646?l#13663159850004646

Rozzi, G. C. (2021). zipcodeR: advancing the analysis of spatial data at the ZIP code level in R. Software
Impacts, 9, 1–4. https://doi.org/10.1016/j.simpa.2021.100099
Document Version: Version of Record (VoR)

Published Version: https://doi.org/10.1016/j.simpa.2021.100099

CC BY-NC-ND V4.0
Downloaded On 2021/09/30 18:26:07 -0400
Software Impacts 9 (2021) 100099

 Contents lists available at ScienceDirect

 Software Impacts
 journal homepage: www.journals.elsevier.com/software-impacts

Original software publication

zipcodeR: Advancing the analysis of spatial data at the ZIP code level in R
Gavin C. Rozzi
Rutgers Urban & Civic Informatics Lab, Edward J. Bloustein School of Planning and Public Policy, Rutgers, The State University of New Jersey, United States of
America

ARTICLE INFO ABSTRACT
Keywords: The United States Postal Service (USPS) assigns unique identifiers for postal service areas known as ZIP codes
ZIP code which are commonly used to identify cities and regions throughout the United States in datasets. Despite the
R widespread use of ZIP codes, there are challenges in using them for geospatial analysis in the social sciences.
ZCTA
 This paper presents zipcodeR, an R package that facilitates analysis of ZIP code-level data by providing an
ZIP code tabulation area
 offline database of ZIP codes and functions for geocoding, normalizing and retrieving data about ZIP codes
zipcodeR
 and relating them to other geographies in R without depending on any external services.

Code metadata

 Current Code version Rolling release commit 3f982b808c1ac2c4ed777c70c7cc0b3ec3e5bedc
 Permanent link to code / repository used of this code version https://github.com/SoftwareImpacts/SIMPAC-2021-53
 Permanent link to Reproducible Capsule https://codeocean.com/capsule/4509180/tree/v1
 Legal Code License GPLv3
 Code Versioning system used git
 Software Code Language used R
 Compilation requirements, Operating environments & dependencies ≥ 3.5
 If available Link to developer documentation / manual
 Support email for questions gr@gavinrozzi.com

Software metadata
 Current software version 0.3.0
 Permanent link to executables of this version https://github.com/gavinrozzi/zipcodeR/releases/tag/0.3
 Permanent link to Reproducible Capsule https://codeocean.com/capsule/4509180/tree/v1
 Legal Software License GNU GPL ≥ 3
 Computing platform / Operating System Linux, macOS, Windows, Unix-like
 Installation requirements & dependencies R 3.5 or greater, dplyr, tidycensus, udunits2, raster, rlang, magrittr
 If available Link to user manual - if formally published include a reference to the https://gavinrozzi.github.io/zipcodeR/index.html
 publication in the reference list
 Support email for questions gr@gavinrozzi.com

1. Introduction used to predict social determinants of health and reveal inequalities
 in small areas [2,3]. zipcodeR makes working with these data easier
 zipcodeR is a package for the R statistical programming language [1] by enabling users to rapidly acquire, geocode and relate ZIP code-
aimed to make research and geospatial analysis easier when analyzing level data to states, counties, Census tracts, and other geographies
data aggregated at the ZIP code level, which is one of the most common commonly encountered in social science research. zipcodeR contributes
forms of geographic data encountered by researchers in the social to the R data science ecosystem by integrating multiple open-source
sciences. While less ideal than other geographies for tracking long- datasets and official government crosswalk files to provide data on over
term trends, such as Census tracts, an individual’s ZIP code can be 41,000 ZIP codes that are suitable for integration into larger projects

 The code (and data) in this article has been certified as Reproducible by Code Ocean: (https://codeocean.com/). More information on the Reproducibility
Badge Initiative is available at https://www.elsevier.com/physical-sciences-and-engineering/computer-science/journals.
 E-mail address: gr@gavinrozzi.com.

https://doi.org/10.1016/j.simpa.2021.100099
Received 10 May 2021; Received in revised form 1 June 2021; Accepted 23 June 2021

2665-9638/© 2021 The Author(s). Published by Elsevier B.V. This is an open access article under the CC BY-NC-ND license
(http://creativecommons.org/licenses/by-nc-nd/4.0/).

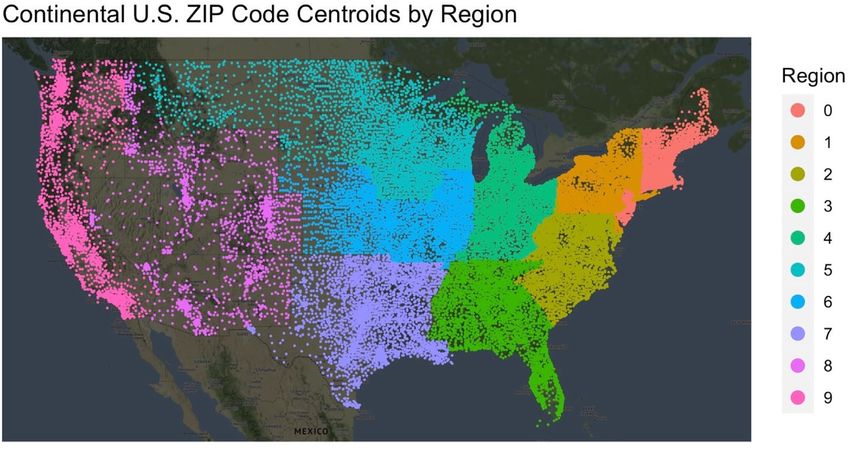
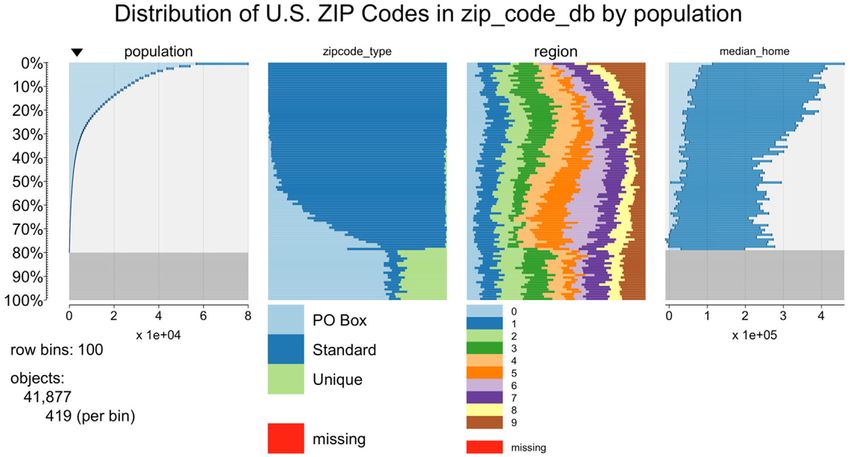
G.C. Rozzi Software Impacts 9 (2021) 100099

via datasets and wrapper functions. zipcodeR has been available on the 2.2. Comparison with existing R packages
Comprehensive R Archive Network (CRAN) since September, 2020 [4].
 In addition to making these data sources available for integration, Previous R packages have sought to address some of the challenges
zipcodeR includes a suite of functions for programmatically retrieving being addressed by zipcodeR but have suffered from drawbacks in-
data on ZIP codes by U.S. state, city, county, time zone and other search herent in existing approaches. There has been a lack of a currently
parameters to support the rapid analysis of data. Beginning in version supported and general-purpose library for working with U.S. ZIP codes
0.3.0 of the package, new geographic functions make it possible to in R that is available through the CRAN repository and covers most
calculate the geographic distance between ZIP codes in miles when only general use cases for exploratory data analysis and research applica-
the ZIP codes are known, as well as searching all ZIP codes located in tions. A popular, previously supported R library that had a degree of
a specific radius around a given coordinate pair with a single function overlap with zipcodeR was the package zipcode, which has since been
call in R. These features make it possible to easily map ZIP code-level archived from the CRAN repository and no longer actively updated by
data without depending on external geocoding APIs, which makes it its maintainer [14]. The archival of the zipcode package from CRAN
especially useful for working with restricted datasets that must not be and lack of further support has limited its reach and utility to the wider
sent outside of internal networks. R community, creating a gap in functionality. Another key limitation of
 the zipcode package was its sole reliance on a data source that was last
2. The zipcodeR package updated in 2004 according to its author, which was later integrated
 with an additional source in 2012. Because ZIP code boundaries are
 based upon the mail delivery routes of the United States Postal Service
2.1. Methodology
 – which can change over time – researchers cannot accurately rely upon
 older packages that have not been updated for use in research involving
 The zipcodeR package integrates multiple open data sources to
 newly collected data at the ZIP code level.
provide maximum utility for researchers analyzing datasets aggregated
 Other currently supported packages that overlap with zipcodeR,
at the ZIP code-level. Most of the data used in the package’s data
 such as choroplethrZip, while useful for their intended applications, are
retrieval functions are supplied by the package’s zip_code_db object,
 too large to be distributed via CRAN and were designed for specific use
an R data frame that contains 41,877 observations of 24 variables. A
 cases like mapping [15]. As the choroplethrZip package is exclusively
data dictionary for all of the variables of data available in zip_code_db
 distributed via GitHub, it must be manually installed using a package
is provided by the package’s documentation [5]. This data frame was
 such as remotes or devtools, limiting the discoverability of these types
built by adapting the approach used by Hu [6] and converting the
 of packages for users new to R.
dataset from an SQLite database into the native binary format used
 The zipcodeR package seeks to achieve a sensible middle ground
by R for integration into the package. A visualization of the spatial
 between very large R packages designed with a specific use case in
distribution of ZIP codes located within the continental U.S. by region
 mind like choroplethrZip and leaner, but far more limited packages like
using zip_code_db dataset is shown in Fig. 1.
 zipcode by including a comprehensive dataset and wrapper functions
 Similar work was undertaken to convert additional ZIP code cross- for subsetting data, but not a large shapefile of polygons representing
walk files produced by U.S. federal government agencies, including the ZIP code boundaries that increases storage demands and forecloses the
U.S. Department of Housing & Urban Development (HUD) and the Cen- possibility of being published on CRAN due to their lack of support for
sus Bureau. These additional datasets were integrated to aid the task of very large files included with packages.
relating ZIP codes to Census Tracts and related geographies [8,9].
 ZIP codes are often used to compare differences between different 3. Impact overview
regions of a state in social science research across one or more vari-
ables. Fig. 2 shows a visualization of the differences between ZIP code The zipcodeR package was originally developed to eliminate repet-
metadata contained within zip_code_db ordered by the population of itive tasks for some of the workflows for using ZIP code level data that
each ZIP code. Table plots are an effective method for visualizing the are common in social science research workflows using the R statistical
properties of large, multivariate datasets, such as zip_code_db. A table programming language.
plot of the dataset was produced through the use of the tabplot R Since the package’s initial release in late 2020, zipcodeR has en-
package [10]. These visualizations are produced by creating statistical abled the rapid prototyping of research and data science projects and
bins from the observations contained within the dataset, with the bars has been implemented in a diverse range of R projects, both pub-
representing the mean of numeric values and frequencies for categor- lished and those still under development. For example, an interactive
ical values. In Fig. 2, each bin contains 419 observations, about 10% dashboard built in R Shiny was published by a data analytics firm show-
of the full data frame. An analysis of this figure makes it possible to casing an income tax dataset that shows economic data by ZIP code
show that there are clear differences between both the distribution of and state through an analysis of administrative data from the Internal
the population of the United States and median home value across the Revenue Service of the United States aggregated from individual tax
3 types and 9 regions of ZIP codes. returns [16].
 The zip_code_db dataset serves as a basis for many of the functions Furthermore, numerous academic and public health research
that were developed to obtain data on user-provided ZIP codes. Most projects that have successfully implemented zipcodeR in their analyses,
of the functions provided by the package return a subset of these data as shown by a search of publicly available GitHub repositories. These
based upon user-supplied search criteria. For example, the function have included efforts by academic researchers to create composite
reverse_zipcode()will return all 24 columns of data about a ZIP metrics of data collected during the COVID-19 pandemic, a study of
code contained within zip_code_db when provided with a ZIP code by physician mental health in partnership with the American Medical
the user. Many of the package’s functions build upon the dplyr and Association, as well as an analysis of how equitable COVID-19 vaccine
raster packages for data manipulation & spatial calculations [11,12]. distribution was in the state of Texas [17–19].
A full reference of the functions provided by zipcodeR may be viewed zipcodeR has also seen adoption in educational contexts, specifically
via the package’s documentation [13]. Other functions provided by the in data science and urban informatics courses and projects. Several stu-
package which do not rely on zip_code_db include the normalize_zip() dent projects & practicums were published on GitHub that implemented
function which relies on custom logic to clean ZIP codes that are the package, demonstrating its use in projects exploring relationships
messy or non-standardized, a common task encountered by researchers between COVID-19 case counts and election data at the ZIP code-level
working with ZIP code-level data. in New York City [20]. Another project that implemented zipcodeR

 2

G.C. Rozzi Software Impacts 9 (2021) 100099

Fig. 1. A map showing centroids of each ZIP code contained within zipcodeR’s zip_code_db dataset for the continental U.S., colorized by the region of the ZIP code as assigned
by the USPS. The region is determined by the first character of the ZIP code as provided by USPS. This map was produced using the ggmap R package [7].

Fig. 2. A table plot of the zip_code_db data frame provided by the zipcodeR package. This dataset provides data that is used to support most of the package’s functions. In this
visualization. statistical bins are ordered based on the population of each ZIP code contained within the dataset.

in their analysis included a program evaluation at a university cancer 4. Conclusion and future work
center [21]. Another educational application of the package was seen
via Tidy Tuesday [22], a weekly coding challenge intended to provide This paper introduced the zipcodeR package for streamlining the
a safe environment for learning R and data analysis skills supported analysis of ZIP code-level data in social science research. The package
 has now had three major iterations published on CRAN since its initial
by the data science community. For the week of May 11th, 2021, Tidy
 release and is gradually becoming more comprehensive as additional
Tuesday implemented the zipcodeR package as a basis for an analysis of
 user feedback is considered for future iterations. Contributions of code
broadband accessibility in the United States using ZIP code-level data. and feedback from researchers who have implemented zipcodeR have
This demonstrated the package’s potential in supporting the analysis of also been very helpful for the development of the package and further
commonly available administrative data & eliminating repetitive tasks, contributions from the community are welcome. While the package is
especially for less-experienced R users. relatively feature-complete at this stage, future iterations may see the

 3
G.C. Rozzi Software Impacts 9 (2021) 100099

integration of additional ZIP code crosswalk datasets available from the [8] United States Census Bureau, Relationship Files, (n.d.), https://www.census.gov/
U.S. federal government, as well as the improvements to the existing geographies/reference-files/time-series/geo/relationship-files.html.
 [9] HUD USPS ZIP Code Crosswalk Files | HUD USER, (n.d.), https://www.huduser.
functions for increased efficiency and broader applicability to research
 gov/portal/datasets/usps_crosswalk.html.
workflows. [10] M. Tennekes, E.D. Jonge, P. Daas, Visualizing and inspecting large datasets with
 tableplots, J. Data Sci. 11 (2013) 43–58, http://www.jds-online.com/files/JDS-
Declaration of competing interest 1108.pdf.
 [11] R.J. Hijmans, Raster: geographic data analysis and modeling, 2021, https://cran.
 r-project.org/web/packages/raster/index.html.
 The authors declare that they have no known competing finan- [12] H. Wickham, R. François, L. Henry, K. Müller, dplyr: A grammar of data
cial interests or personal relationships that could have appeared to manipulation, 2021.
influence the work reported in this paper. [13] G.C. Rozzi, Function reference • zipcodeR, 2021, https://gavinrozzi.github.io/
 zipcodeR/reference/index.html.
 [14] J. Breen, Zipcode: U.S. ZIP code database for geocoding, 2012, https://cran.r-
Appendix A. Supplementary code
 project.org/src/contrib/Archive/zipcode/.
 [15] A. Lamstein, choroplethrZip: Shapefile, Metadata and Visualization Functions for
 Supplementary material related to this article can be found online US Zip Code Tabulated Areas (ZCTAs), 2020, https://github.com/arilamstein/
at https://doi.org/10.1016/j.simpa.2021.100099. choroplethrZip.
 [16] D. Lucey, Introducing the Redwall IRS SOI Tax Dashboard - Redwall Analyt-
 ics, Redwall Anal. (2021) https://redwallanalytics.com/2021/02/03/introducing-
References the-redwall-irs-soi-tax-dashboard/.
 [17] P. Ganguly, S. Mukherjee, A.S. Kumar, GitHub - abinesh-23/Physician-mental-
 [1] R Core Team, R: A Language and Environment for Statistical Computing, 2021, health-analysis-AMA-: This repository contains the code for the research project
 https://www.R-project.org/. partnered with American Medical Association (AMA) to understand physician
 [2] E. Sokol, How geographic data can help address social determinants of health, mental health working as a frontline worker during COVID pandem, 2021.
 Heal. IT Anal. (2019) https://healthitanalytics.com/features/how-geographic- [18] UNC School of Government ncIMPACT Initiative, GitHub - ncIMPACT/covid-
 data-can-help-address-social-determinants-of-health. keys-impact: Examining composite variables for COVID-19 Keys to Economic
 [3] T.C. Yang, S. Kim, Y. Zhao, S. won E. Choi, Examining spatial inequality in Recovery project, 2021, https://github.com/ncIMPACT/covid-keys-impact.
 COVID-19 positivity rates across New York City ZIP codes, Heal. Place. 69 (2021) [19] L.B.J.S. of P.A. University of Texas at Austin, Texas COVID-19 Vaccine Tracker:
 102574. Explore Equity, 2021.
 [4] G.C. Rozzi, Data & functions for working with US ZIP Codes [R package zipcodeR [20] S. Green, M. Gonsalves, D. Markowska-Desvallons, O. Khaimova, J. Mazon,
 version 0.3.0], 2021, https://cloud.r-project.org/web/packages/zipcodeR/index. DATA 607 Final Project - COVID rates vs. Election Results in NYC, (n.d.),
 html. https://rpubs.com/OrliKhaim/DATA607_Final_Project.
 [5] G.C. Rozzi, ZIP Code Database — zip_code_db • zipcodeR, ZipcodeR Doc, 2021, [21] R. Dario Herrera, GitHub - UACC-renedherrera/UAZCC_COE_Program_Evaluation:
 https://gavinrozzi.github.io/zipcodeR/reference/zip_code_db.html. Implementation of different evaluation tools to measure program effectiveness,
 [6] S. Hu, Uszipcode 0.2.4 documentation, 2020, https://uszipcode.readthedocs.io/ 2021, https://github.com/UACC-renedherrera/UAZCC_COE_Program_Evaluation.
 index.html. [22] T. Mock, Tidy Tuesday: A weekly data project aimed at the R ecosystem, 2021.
 [7] D. Kahle, H. Wickham, ggmap: Spatial Visualization with ggplot2, The R Journal
 5 (2013) 144–161, https://journal.r-project.org/archive/2013-1/kahle-wickham.
 pdf.

 4
You can also read