PROCEEDINGS OF SPIE Density analysis of Flickr data as a proxy to reveal the intensity of tourism activity in Borobudur
←
→
Page content transcription
If your browser does not render page correctly, please read the page content below
PROCEEDINGS OF SPIE
       SPIEDigitalLibrary.org/conference-proceedings-of-spie

                   Density analysis of Flickr data as a
                   proxy to reveal the intensity of
                   tourism activity in Borobudur

                   Wibowo, Totok, Rofi'i, Achmad, Sulistyaningrum, Nur

                                  Totok W. Wibowo, Achmad Rofi'i, Nur A. Sulistyaningrum, "Density analysis of
                                  Flickr data as a proxy to reveal the intensity of tourism activity in Borobudur,"
                                  Proc. SPIE 11311, Sixth Geoinformation Science Symposium, 113110F (21
                                  November 2019); doi: 10.1117/12.2549040

                                  Event: Sixth Geoinformation Science Symposium, 2019, Yogyakarta,
                                  Indonesia

Downloaded From: https://www.spiedigitallibrary.org/conference-proceedings-of-spie on 22 Oct 2021 Terms of Use: https://www.spiedigitallibrary.org/terms-of-use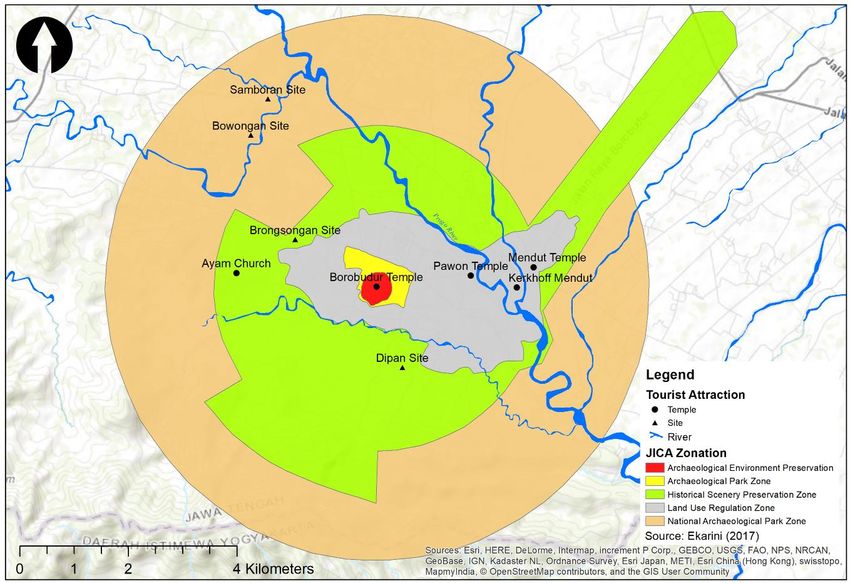
Density Analysis of Flickr Data as a Proxy to Reveal the Intensity of
                                      Tourism Activity in Borobudur
                                   Totok W. Wibowo*a, Achmad Rofi’ia, Nur A. Sulistyaningruma
                  a
                    Department of Geographic Information Science, Faculty of Geography, Universitas Gadjah Mada,
                           Bulaksumur Yogyakarta 55281. *Corresponding author: totok.wahyu@ugm.ac.id

                                                                                  ABSTRACT

                Indonesia has many cultural heritages that attracts not only local tourist but also a foreigner. The most renowned site for
                cultural tourism is Borobudur, that attracts many tourists. It also included as one of the seven cultural wonders in the
                world. Tourism activity cannot be separated from photography since the visitors would want to have memories of the
                locations. Involuntary Geographic Information (iVGI) is one of the new sources of information that can be used to
                analyze the pattern of human activities spatially. This research explores Flickr data as an example of using photo-based
                iVGI data for hotspot analysis of human activities in cultural tourism objects. Each photo in Flickr’s database located in
                Borobudur can be assumed as an activity log since Flickr allowed the user to add geotagged photos. Though a data
                cleaning process must be done to filter irrelevant data. Point Density was employed in this study to explore photo
                distribution in the study area. The density will act as an indicator that an area is more frequently visited by visitors.
                Besides, Zonation of Borobudur Region data was used to justify the density and the zone designated by the official
                document. The results of the study show that the peak of photography activity occurs at 13 pm and area arround the
                Stupa of Borobudur Temple has attracted visitor in undertaking photo shoot activity.
                Keywords: iVGI, Borobudur, Flickr, Spatiotemporal

                                                                          1. INTRODUCTION
                Spatial studies require geographically referenced data, which can be represented by points, lines, and polygons.
                Traditionally, spatial data can be obtained using geospatial data sources, such as satellite imagery, secondary data, and
                direct surveys. Current technological developments allow people to upload their activities through social media
                platforms. Social media data uploaded by users can be plotted on the map, along with the widespread use of
                communication devices equipped with GPS receivers. Fischer [1] introduced the term Involuntary Geographic
                Information (iVGI) to refer to spatial data originating from social media users. In this case, the main objective of the
                upload is not always the same as those of data usage. The term iVGI is the development of a Volunteered Geographic
                Information (VGI) conceptualized by Goodchild [2], where user uploads are in line with the purpose of data usage.
                Diverse data uploads of social media users bring challenges in its management [3]. The data must be processed first to
                ensure the level of relevance to the analysis to be carried out. Many researchers applied filters to obtain relevant data to
                suit their needs [4]–[6]. Of course, to be used as a spatial data source, users must add location information to the data
                they uploaded.
                Flickr is one of the photo-sharing services that allow a user to upload geotagged photos. Created in 2004, Flickr is
                estimated to have more than 90 million users in 2017. Photos from social media uploads are certainly very diverse.
                Visitor activity in a tourist attraction is an interesting topic in social media study. Tourists surely want to capture the
                moment of their vacation in the tourist sites. Some even upload photos taken into their social media accounts. Thus,
                geotagged photo found around tourist objects can be assumed to be a record of activities at tourist sites [7].
                Mapping tourist activities in a tourist attraction could provide support for determining development priorities.
                Photogenic spots are currently commonly used as one of the allurements in many tourist attractions. Photograph
                dissemination through social media has also an impact on the increasing popularity of tourism objects that have emerged
                lately. Based on this fact, the determination of photographic activities in a tourist attraction could utilize historical data
                on geotagged photos taken by tourists [8], [9]. Furthermore, the result of the analysis could provide insights into tourist
                attraction's management.

                                           Sixth Geoinformation Science Symposium, edited by Sandy Budi Wibowo, Andi B. Rimba
                                                Stuart Phinn, Ammar A. Aziz, Proc. of SPIE, Vol. 11311, 113110F · © 2019 SPIE
                                                           CCC code: 0277-786X/19/$21 · doi: 10.1117/12.2549040

                                                                        Proc. of SPIE Vol. 11311 113110F-1
Downloaded From: https://www.spiedigitallibrary.org/conference-proceedings-of-spie on 22 Oct 2021
Terms of Use: https://www.spiedigitallibrary.org/terms-of-use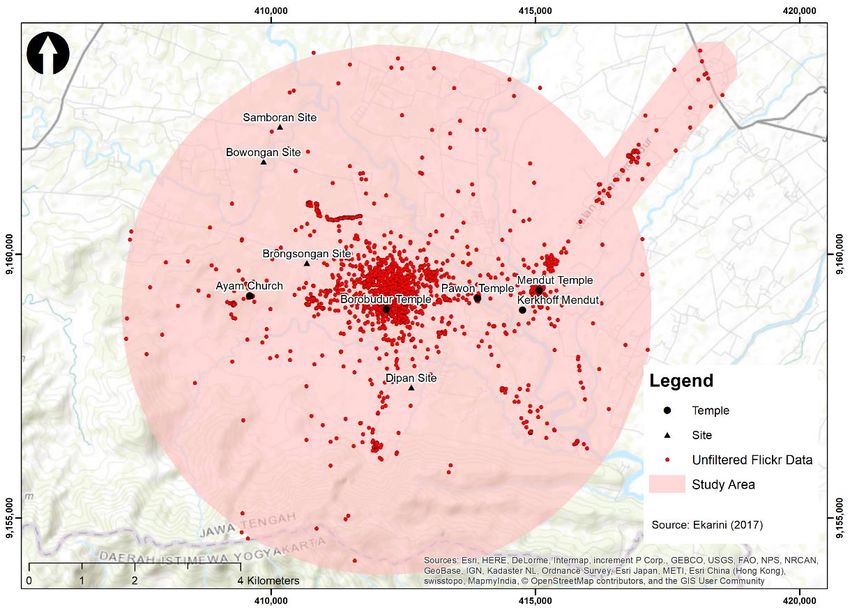
2. STUDY AREA
                This study was conducted at the Borobudur Temple Compound, which is one of Indonesia's leading tourist locations and
                listed as one of UNESCO's cultural heritage (Figure 1). Based on the authority data there were 3,135,292 local and
                foreign tourists throughout 2017, the highest among other tourist attractions in Central Java Province [10].
                Administratively, Borobudur Temple Compound belongs to Magelang Regency Area. Magelang city is the nearest city
                from Borobudur, but a lot of Tourist also come from the Special Region of Yogyakarta. Around Borobudur temple, there
                are also Mendut temples and Pawon temples, which form a straight line called Borobudur Temple Compound. On the
                west side of Borobudur, there is a relatively new tourist attraction called Gereja Ayam Rhema Hill, which was recently
                famous thanks to social media.
                Based on the zoning prepared by JICA, there are five zones for heritage management [11]. Zone 1 and zone 2, is the
                complex of Borobudur Temple which functions for the Archaeological Environment Preservation and Archaeological
                Park. Meanwhile, the other three zones serve to preserve historical scenery. In the zoning are also included several other
                cultural objects, for example, Dipan Site, Brongsongan Site, and Mendut Kerkhoff.

                                                  Figure 1. Study area, located in Borobudur Temple and its vicinity

                                                                               3. METHODS
                3.1 Data Pre-Processing
                The Flickr API is used to obtain geotagged photo metadata around the study area. In the metadata listed some
                information, such as title, tag, accuracy, date, latitude, and longitude. There is a time limit that applies to the data, which
                only uses data from 2004 to 2018. The time limitation is carried out to get the whole data per year as input in
                spatiotemporal data analysis. Overall there are 4,631 unfiltered Flickr photos in the study area (Figure 2).

                                                                        Proc. of SPIE Vol. 11311 113110F-2
Downloaded From: https://www.spiedigitallibrary.org/conference-proceedings-of-spie on 22 Oct 2021
Terms of Use: https://www.spiedigitallibrary.org/terms-of-use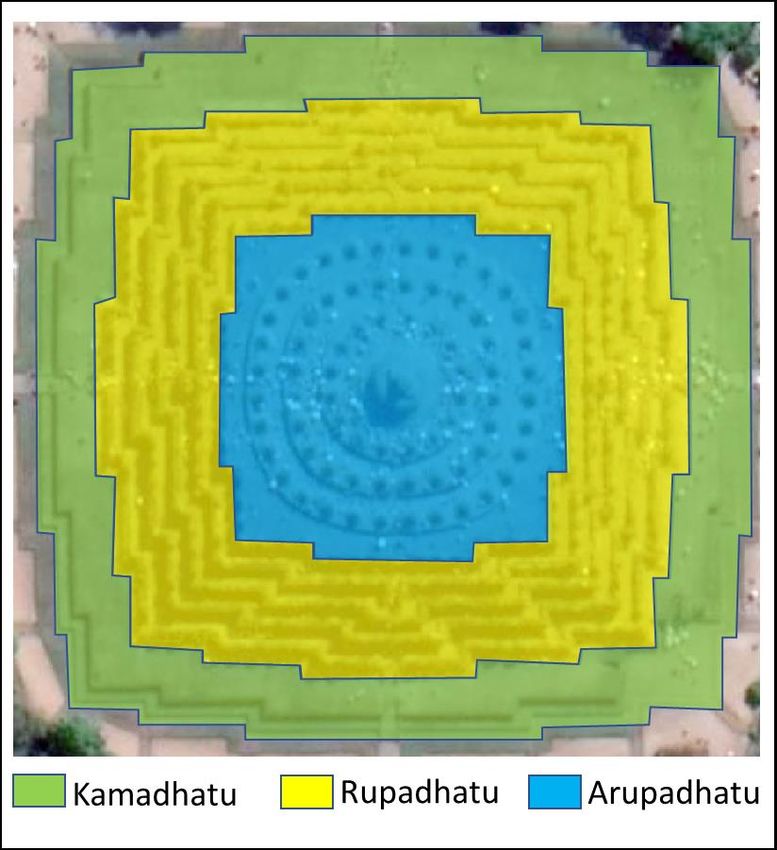
Figure 2. Unfiltered Flickr geotagged photos locations in the study area
                Data filtering is the first processing step applied once the metadata is collected. The title and tags are used as input in
                text-based query analysis to determine the relevance of a photo. Both fields contain information added by Flickr users
                about the description of the uploaded photo. Photos that are not related to Borobudur Temple Compound or tourism
                activities in the vicinity will not be used in spatial analysis. For instance, photos with a generic name usually certain
                prefix such as DSC (Digital Still Camera) and IMG (Image) were not used in this study. On the other hand, the following
                keywords were employed as a tourism activity identifier, namely Borobudur, Tourism, Holiday, Mendut, Heritage,
                Temple, and Relief. Photos that occupy the same coordinate were also removed.
                3.2 Density Analysis
                General spatial distribution identified by using quadrat density, since it can give a more rigid density picture, with the
                advantage of displaying the original distribution. The grid size used for calculating quadrat density is 30 m, considering
                an analysis scale of 1: 60,000 (Figure 3). The number of points on each grid is calculated and saved in the attribute data
                of each grid. Visualization using the standard deviation classification system is used to display maps. Grids with an
                amount of data 1 will be excluded in this visualization to reduce the complexity of the map display.
                The number of point data in each grid can be a representation of tourism activity in the study area, especially
                photography. The approach used in this study does not consider the number of points on the neighboring grid since the
                photoshoot activity is specific to a distinct spot. High concentration of point data can be assumed as a favorite spot for a
                photo shoot at the study site, especially in the Borobudur Temple Compound.

                                                                        Proc. of SPIE Vol. 11311 113110F-3
Downloaded From: https://www.spiedigitallibrary.org/conference-proceedings-of-spie on 22 Oct 2021
Terms of Use: https://www.spiedigitallibrary.org/terms-of-use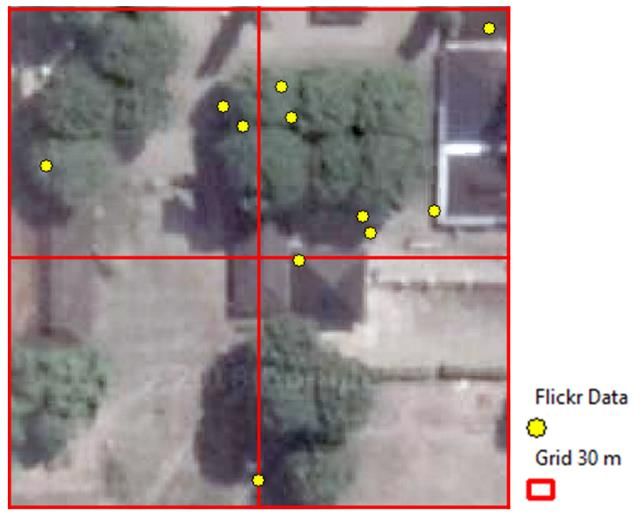
Figure 3. Example of quadrat density calulation
                3.3 Spatiotemporal Analysis
                Hotspot Analysis utilizes vector data to identify the location of hot spots and cold points that are statistically significant
                in the data used. In practice, the event points will be collected into a polygon or convergent point that is close to each
                other based on distance calculations [12]. Polygon groups/clusters will be arranged according to the values at each point
                and are classified as high (hot) or low (cold). The polygons can be either administrative boundaries or tessellation
                polygons.
                The spatiotemporal analysis is carried out to determine the pattern of tourist activity both in the spatial and the specified
                period. Space-time cube is used for this analysis because it can reveal data patterns spatially. In principle, the space-time
                cube will aggregate point data into space-time bins. The bin has a three-dimensional structure, which spatially occupies
                the x and y positions, while the z-axis represents time. In this study, the period for each bin is one month.
                Visualization of space-time cube in 2 dimensions was done to find out the tendency of data, whether there is an up or
                down tendency. Getis-Ord Gi* was used to distinguish the structure of the level of cluster concentration [13]. More
                detailed analysis is performed using Emerging Hot Spot Analysis, which is used to break down trends into several
                categories namely new, consecutive, intensifying, persistent, diminishing, sporadic, oscillating, and historical hot and
                cold spots.

                                                                4. RESULTS AND DISCUSSION
                4.1 Flickr Data and Density Analysis
                The results of observations in the title and tag columns indicate a written error, even though they have the same purpose.
                For example, the user writes Borobudur with Borobadur, Borubadur, and Borabodur. These errors are tolerable and
                remain used in the data for spatiotemporal analysis. The filtering results gave 2,951 data that were relevant for the study,
                that number constituted 63.72% of the total data obtained at the study site.
                There are three peaks when tourists take photos namely, 1 pm, 4-5 pm, and 10 pm (Figure 4). Among the three the 1 pm
                peak have the highest number of photos and can be concluded as the favorite time for tourists to take pictures. Daytime is
                the peak of tourism activities in Borobudur. If the weather is not cloudy, visitors can take photos in the tourist area freely
                and get the maximum results. The second peak occurs at 4 to 5 am, during which time the sun is not too hot but with
                adequate lighting. These conditions are quite ideal for taking photos. The third peak occurs just before midnight, which
                is 10 pm. It can be inferred that most of these photos uploaded outside the Borobudur complex.

                                                                        Proc. of SPIE Vol. 11311 113110F-4
Downloaded From: https://www.spiedigitallibrary.org/conference-proceedings-of-spie on 22 Oct 2021
Terms of Use: https://www.spiedigitallibrary.org/terms-of-use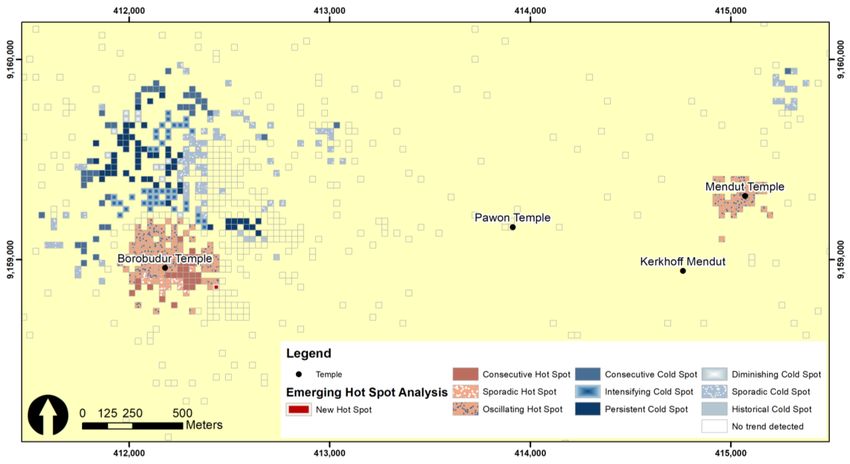
Figure 4. Temporal concentration of Flickr Data
Temporal analysis can reveal the favorite time of tourists in the study location. However, the information about the
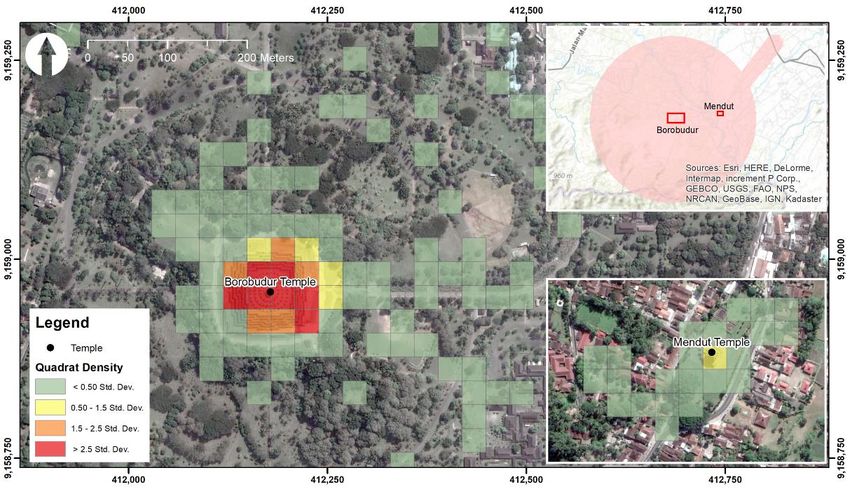
favorite location of tourists to take pictures is needed to formulate more specific planning. Quadrat Density analysis
shows that in the area around Arupadhatu Stupa has the highest number of data (Figure 5). The Arupadhatu Stupa is
located at the top of Borobudur Temple and the surrounding area has provided enough space to carry out photoshoots
(Figure 6). The preservation of cultural heritage seen at Borobudur Temple is the prohibition to sit in the Stupa or touch
the Stupa. The enforcement of the ban needs to be promoted especially in locations with high-density levels.
Figure 5. Quadrat density of Flickr data
The second-density level can be found on the eastern and southern sides of Borobudur Temple. The eastern part is the
entry for tourist to the Borobudur Temple. The scene also seems photogenic because of the existence of Menoreh hills in
Proc. of SPIE Vol. 11311 113110F-5
Downloaded From: https://www.spiedigitallibrary.org/conference-proceedings-of-spie on 22 Oct 2021
Terms of Use: https://www.spiedigitallibrary.org/terms-of-usethe background. The existence of photography services that often offer their services at this location add opportunities
for many photography activities.
Mendut Temple becomes the only location other than Borobudur Temple compound that has a significant density. There
are 23 photos on the grid at Mendut Temple or 10 times smaller than the maximum number in a grid. A total of 1,034
grids (98%) have less than 20 photos, which in this case is not significant. This vast difference shows that the appeal of
photography in the study area is indeed located around the Borobudur Temple.
Figure 6. Three divisions of Borobudur Temple sturcture
4.2 Borobudur Hot Spot Map
In the previous section, we have discussed how the pattern of Flickr distribution data both temporally and spatially. Hot
spots analysis in Figure 7 presents the results in the form of hot spots and cold spots around the Borobudur Compound
Temple. The analysis revealed there were 11 varieties, 6 of which were categorized as cold spots. Meanwhile, there are
four hot spot classes namely oscillating, sporadic, successive, and new hot spots. One other class is the data bin which is
not significant either as a cold or hot spot.
Hot spots can be seen around Borobudur Temple and Mendut Temple. This result is supported by a significant quadrat
density value. Slightly different results were found in the analysis of the hot spots that there were consecutive hot spots
around the entrance of the temple courtyard. In the area near the Borobudur Temple Stupa classified as the oscillating hot
spot category. Both results indicate that by the end of time-step there were plenty of photos taken around the entrance of
the temple courtyard. On the other hand, located around the Stupa is a hot spot area that also being a statistically
significant cold spot during earlier time-step.
Proc. of SPIE Vol. 11311 113110F-6
Downloaded From: https://www.spiedigitallibrary.org/conference-proceedings-of-spie on 22 Oct 2021
Terms of Use: https://www.spiedigitallibrary.org/terms-of-useFigure 7. Hot spot analysis of Flickr geotagged data between 2005-2018
Areas with sporadic hot spot can be found in the southern part of Borobudur Temple. Statistically, this area has never
been a cold spot but inconsistent for the specified period. This is interesting because the southern part of the temple has
no attraction for tourists. After a tourist reaches the top of the temple, they will continue to move west and/or north of the
temple. The pattern of the oscillating place formed also follows the direction of the tourist movement. Meanwhile, the
pattern of the oscillating hot spot at Mendut Temple looks enclosing and uniform. There is no cold spot data that directly
adjacent with that data. The Mendut temple complex which is not too broad can be easily reached by tourists.
Cold spots can be found in the northern part of Borobudur Temple, located outside the ring road. In that section, there are
several interesting objects to visit such as elephants, Samudraraksa Museum, Borobudur Museum, Lumbini Park, and
centers for crafts and food. Although these places have a high number of visiting visitors, only a small number of photos
taken at these places will possibly be uploaded to social media accounts. This is because generally, the main purpose of
Borobudur visitor is to see the temple and capture the moment there.
5. CONCLUSION
The results of the analysis show that there are a lot of photographic activities around the Stupa of Borobudur Temple.
Hence, the preservation of the Borobudur Temple ideally should be concentrated around the Stupa. The eastern area of
Borobudur Temple needs to be anticipated for development because based on hot spot data, the location is widely used
for photography activities in recent years. Based on zoning data from JICA, the recommended area is included in the
archeological environment preservation zone. Another area that also has quite a lot of photography activity is the Mendut
Temple, which is part of the Borobudur Temple Compound. The temporal analysis shows the highest photography
activity taken in the afternoon. Borobudur managers should ideally be able to use working hours to meet the needs of
tourists for photography activity.
6. ACKNOWLEDGEMENTS
This work was completed as part of the 2019 Faculty of Geography UGM Lecturer Research Grant
(2056.45/UN1/FGE/KPT/SETD/2019).
Proc. of SPIE Vol. 11311 113110F-7
Downloaded From: https://www.spiedigitallibrary.org/conference-proceedings-of-spie on 22 Oct 2021
Terms of Use: https://www.spiedigitallibrary.org/terms-of-useREFERENCES
[1] F. Fischer, “VGI as big data. A new but delicate geographic data-source.,” GeoInformatics, 2012.
[2] M. F. Goodchild, “Citizens as sensors: The world of volunteered geography,” GeoJournal, vol. 69, no. 4, pp.
211–221, 2007.
[3] P. A. Longley, M. Adnan, and G. Lansley, “The Geotemporal Demographics of Twitter Usage,” Environ. Plan.
A, vol. 47, no. 2, pp. 465–484, 2015.
[4] J. A. Donaire, R. Camprubí, and N. Galí, “Tourist clusters from Flickr travel photography,” Tour. Manag.
Perspect., 2014.
[5] A. Majid, L. Chen, G. Chen, H. T. Mirza, I. Hussain, and J. Woodward, “A context-aware personalized travel
recommendation system based on geotagged social media data mining,” Int. J. Geogr. Inf. Sci., vol. 27, no. 4, pp.
662–684, Apr. 2013.
[6] A. Majid, L. Chen, H. T. Mirza, I. Hussain, and G. Chen, “A system for mining interesting tourist locations and
travel sequences from public geo-tagged photos,” Data Knowl. Eng., vol. 95, pp. 66–86, Jan. 2015.
[7] S. Kisilevich, M. Krstajic, D. Keim, N. Andrienko, and G. Andrienko, “Event-based analysis of people’s
activities and behavior using Flickr and Panoramio geotagged photo collections,” Proc. Int. Conf. Inf. Vis., pp.
289–296, 2010.
[8] L. Yang, L. Wu, Y. Liu, and C. Kang, “Quantifying tourist behavior patterns by travel motifs and geo-tagged
photos from flickr,” ISPRS Int. J. Geo-Information, vol. 6, no. 11, pp. 1–18, 2017.
[9] R. Ji, Y. Gao, B. Zhong, H. Yao, and Q. Tian, “Mining Flickr landmarks by modeling reconstruction sparsity,”
ACM Trans. Multimed. Comput. Commun. Appl., vol. 7 S, no. 1, 2011.
[10] Dinas Pariwisata Jawa Tengah, Buku Statistik Pariwisata Jawa Tengah 2017. 2017.
[11] F. D. Ekarini, “The Landscape of Borobudur Temple Compounds and its Environment,” J. World Herit. Stud.,
vol. Special Is, pp. 24–29, 2017.
[12] D. O’Sullivan and D. J. Unwin, Geographic Information Analysis: Second Edition. 2010.
[13] U. R. R. Manepalli, G. H. Bham, and S. Kandada, “Evaluation of Hotspots Identification Using Kernel Density
Estimation (K) and Getis-Ord (Gi*) on I-630,” 3rd Int. Conf. Road Saf. Simul., 2011.
Proc. of SPIE Vol. 11311 113110F-8
Downloaded From: https://www.spiedigitallibrary.org/conference-proceedings-of-spie on 22 Oct 2021
Terms of Use: https://www.spiedigitallibrary.org/terms-of-useYou can also read