Unleashing your data and creating actionable insights through visual analytics - Onware
←
→
Page content transcription
If your browser does not render page correctly, please read the page content below

Unleashing your data and
creating actionable insights
through visual analytics.
3

CONTENTS

 04   About Onware Business Solutions

 05   Customers

 06   Visual Analytics

 08   Microsoft Power BI Licensing and Pricing

 09   Tableau Licensing and Pricing
 10   Business Intelligence Professional Services

 11   Custom Software Development Services

 12   Guided Evaluation

 14   Contacts

                 The contents of this document are confidential and copyright Onware Business Solutions Inc.
4

ABOUT ONWARE BUSINESS SOLUTIONS

Onware is a team of software professionals         TABLEAU
based in Edmonton, Alberta, Canada. We
have been building Internet Applications for       Tableau helps people transform data into
over 15 years. Our passion is building great       actionable insights that make an impact.
software and experiences for our clients with      Easily connect to data stored anywhere, in
attention to detail.                               any format. Quickly perform ad hoc analyses
                                                   that reveal hidden opportunities. Drag and
The Onware Contract Administration Internet        drop to create interactive dashboards with
application was first created in 2002 as a spin-   advanced visual analytics then share across
off from the University of Alberta’s Software      your organization and empower teammates to
Engineering Research Lab.                          explore their perspective on data. From global
                                                   enterprises to early-stage startups and small
In addition to the Onware application, we have
                                                   businesses, people everywhere use Tableau’s
almost 10 years of experience implementing
                                                   analytics platform to see and understand their
and supporting Tableau and Microsoft
                                                   data.
applications throughout small and large
businesses, including consultants, service
providers, government entities, general/
sub/specialty contractors, and those in the
architectural, engineering, construction, and
owner (AECO) industry. We have extensive
experience working with Procore, ViewPoint,
and eCMS construction management software.
                                                   MICROSOFT
After years of working with clients based in
the United States, we incorporated Onware Foster innovation everywhere across your
Business Solutions in Texas to better serve our organization with the Microsoft Power Platform
American clients.                                 – analyze data, build solutions, automate
                                                  processes, and create virtual agents. The
Whether it is helping you manage your team Microsoft Power Platform is more than the
or to give visibility to the executive and board- sum of its parts. Connect them together –
level oversight, we have the answers to your and to Office 365, Dynamics 365, Azure and
organization’s needs and challenges. We have hundreds of other apps – and build end-to-
extensive experience with monitoring volume end business solutions.
or resolution times, workload distributions,
sales and KPI tracking, construction and
project management, budget administration
and financial analysis.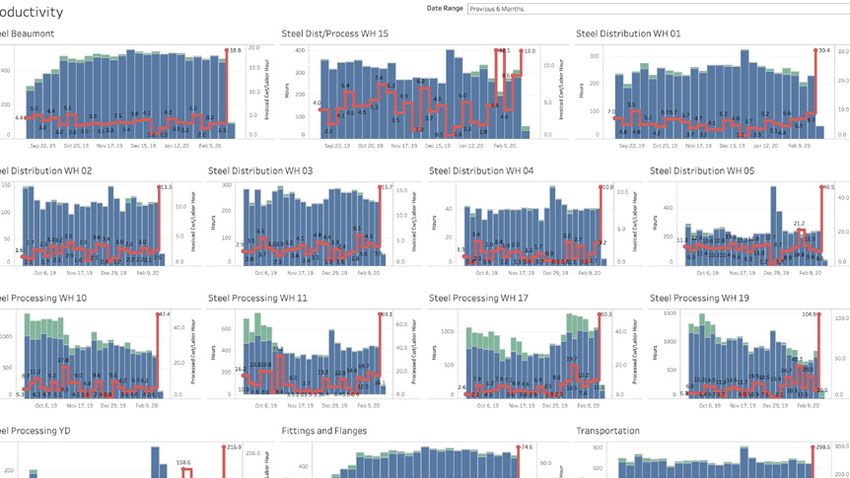
5

CUSTOMERS

Onware’ serves clients throughout Canada and the United States:

Onware’s products and services have been utilized on many large scale and high profile
construction projects, some examples include:

Calgary International Airport - $1.4B            Edmonton Federal Building - $229M
Edmonton Clinic - $500M                          Healthcare Research Innovation Facility - $165M
Grande Prairie Regional Hospital - $460M         MacEwan Centre for Arts - $143M
Stanton Territorial Hospital - $300M             Innovation Centre for Engineering - $103M
NAIT Centre for Advanced Technology - $192M      Clareview Recreation Centre - $88M
RBC Branch Renovations - 500 projects, $155M     Meadows Recreation Centre - $85M
Northlands Expansion - $155M                     Edmonton International Airport - $62M
6
VISUAL ANALYTICS
Onware are experts in dealing with complex
construction and financial data. Let us help
your organization transform its data into
actionable insights through visual analytics to
drive business results.
KEY SKILLS
• Knowledgeable in working with complex
data sources including: eCMS, ViewPoint,
Procore, Sage, SQL Server, .
• Integrating data from different sources,
ETL (extract, transform, load) processing
• Interactive dashboard design
• Project-based data and reporting including
job cost reports, scheduling, management,
etc.
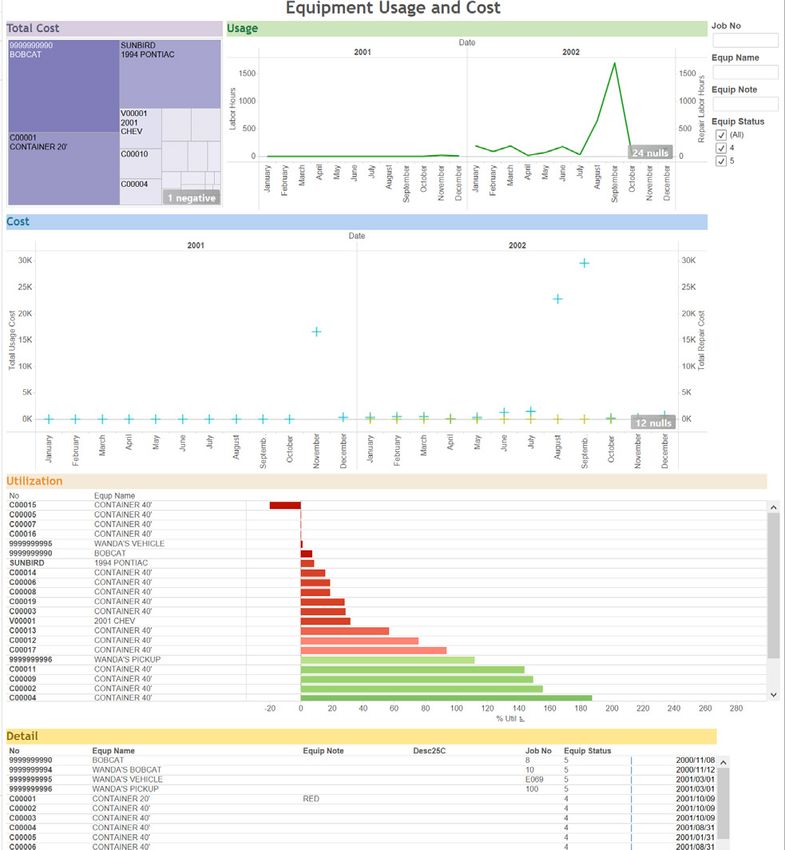
• Financial data and reporting including EQUIPMENT USAGE AND COST (ECMS)
income statements, balance statements,
account receivables and payables, etc.
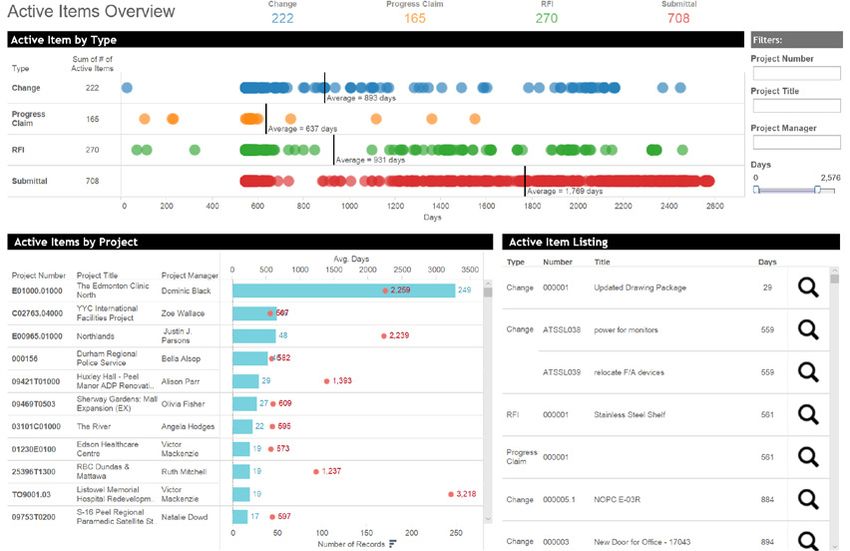
Some examples from Onware’s catalog of
dashboards and reports:
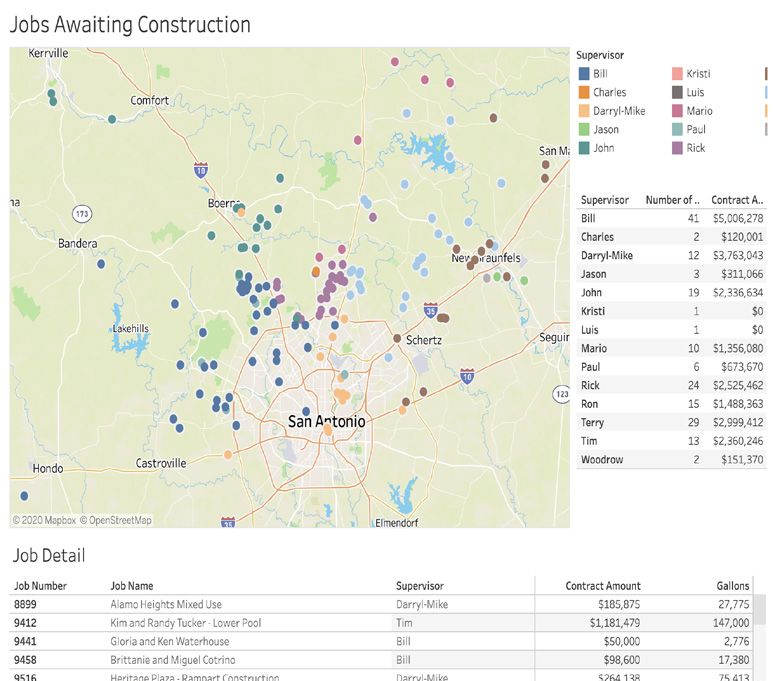
JOB TIME LINES AND MAPPING
WORKFORCE ANALYSIS (PROCORE)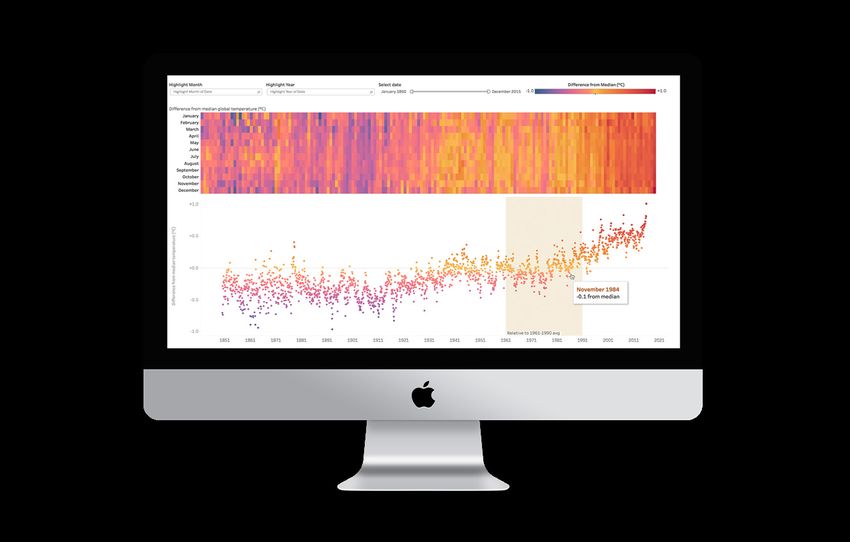
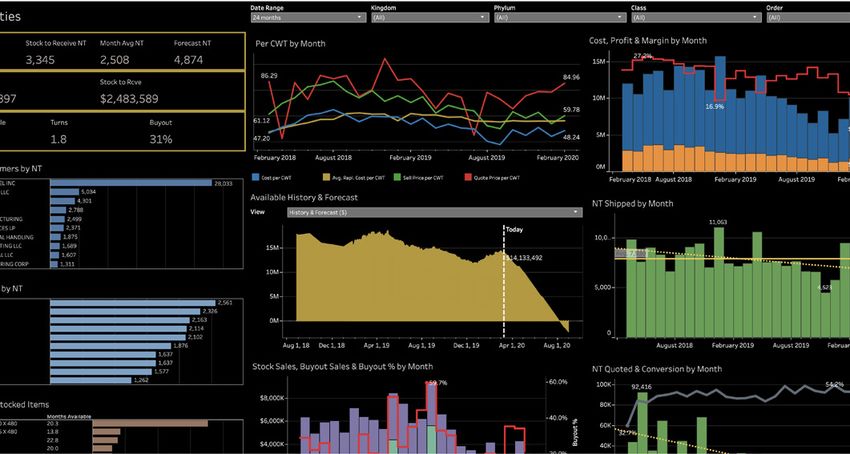
7

 CONSTRUCTION MANAGEMENT/       PRODUCTIVITY AND OPERATIONS
  CONTRACT ADMINISTRATION

PROJECT & CORPORATE FINANCIAL   FORECASTING, SALES & BACKLOG
8

MICROSOFT POWER BI LICENSES AND
PRICING
Microsoft Power BI helps you connect to and POWER BI PRO
visualize any data using the unified, scalable
platform for self-service and enterprise Distribute and access insights anywhere by
business intelligence (BI) that is easy to use combining Power BI Desktop and Power BI
and helps you gain deeper data insight.         Pro. Self-service and modern BI in the cloud,
                                                and fully managed by Microsoft. Collaborate
There are two kinds of Power BI per-user and build reports with colleagues and then
licenses: free and Pro. Which type of license publish and share those reports anytime,
a user needs is determined by where content anywhere, and on any device.
is stored and how they will interact with that
content1.                                       Power BI Pro uses shared capacity. If content
                                                is stored in a shared capacity, users who are
POWER BI DESKTOP                                assigned a Power BI Pro license can collaborate
                                                only with other Power BI Pro users. They can
Connect, prep and model your data with ease; consume content shared by other users,
provide advanced analytics with the familiarity publish content to app workspaces, share
of Office; deepen your data insights with AI- dashboards, and subscribe to dashboards and
driven augmented analytics; create interactive reports.
reports customized for your business, and
author for everyone, anywhere.                    		                 $120 USD/USER/YEAR
A user with a free license can only use the
Power BI service to connect to data and POWER BI PREMIUM
create reports and dashboards in their own
                                               Power BI Premium is for enterprise BI,
workspace. They cannot share content with
                                               big data analytics, cloud and on-premises
others or publish content to other workspaces.
                                               reporting. It includes advanced administration
		                                     FREE    and deployment controls; dedicated cloud
                                               compute and storage resources; and allows
                                               any user to consume Power BI content.

                                                Power BI Premium allows users with a free
                                                license to act on content in workspaces that
                                                are assigned to a Premium capacity.

                                                                                $59,940 USD/YEAR2

                                                1 For full comparison of Power BI Features, visit Microsoft Power BI.
                                                2 Price per dedicated cloud compute and storage resource.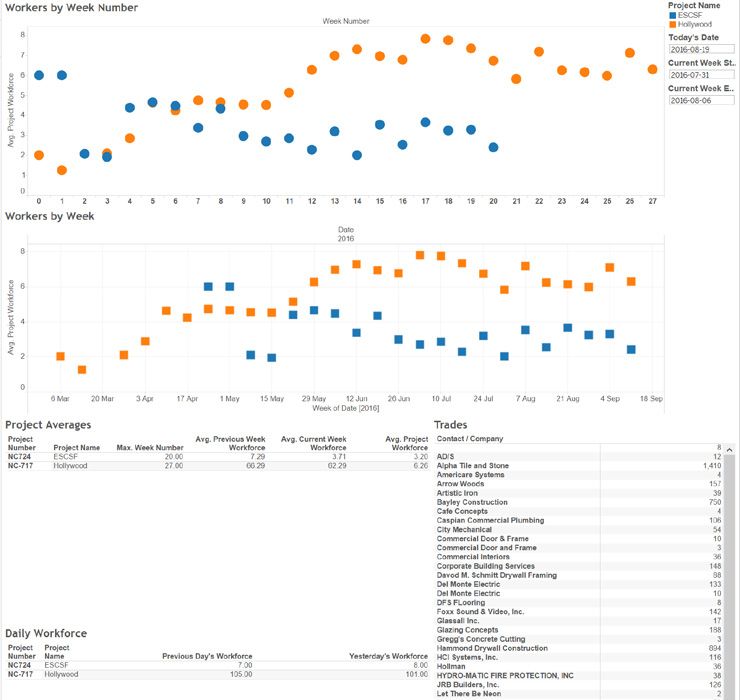
9

TABLEAU LICENSES AND PRICING

How do you turn people’s collective potential     TABLEAU EXPLORER
into a competitive advantage? Arm them with
data, unlock their curiosity, and unleash their Explore trusted data and answer your own
creativity. Enable your teams to work faster    questions faster with full self-service analytics.
and smarter by choosing a seamless end-to-      Explorers gives business users the ability and
end analytics experience. Prepare for analysis. autonomy to access and explore published
Build data sources and dashboards. Publish      data sources to ask and answer questions
and share content. Collaborate. All with the    that lead to new insights and better business
security and governance you require1.           outcomes. Explorers can analyze any data
                                                sources or workbooks on the server. They
TABLEAU DESKTOP                                 can create a new analysis on the web based
                                                on governed data sources, and subscribe
Tableau Desktop makes it easy to answer and create alerts for themselves and their
questions about your data visually, in minutes. colleagues.
Connect to any data and drag and drop to
analyze. Create interactive visualizations and $420 USD/USER/YEAR (TABLEAU SERVER)
dashboards - all without any programming. $500 USD/USER/YEAR (TABLEAU ONLINE)
Then share with a few clicks. Tableau connects
live to most databases and spreadsheets and
                                                TABLEAU VIEWER
also offers a fast, in-memory data engine to
speed up analysis. Anyone who is comfortable View and interact with dashboards and
with Excel can learn Tableau quickly.           visualizations in a secure, easy-to-use
                                                  platform. Tableau Viewer makes it possible
TABLEAU PREP (INCLUDED WITH DESKTOP)
                                                  for organizations to extend the value of data
Data prep is one of the biggest challenges        and analytics across their entire workforce
facing our customers today. Tableau Prep          in a very cost-effective manner. Viewers are
simplifies common data preparation tasks          able to view and filter dashboards, receive
- such as joins, unions, pivots, cleaning,        and manage subscriptions, and receive data-
and aggregations - with a drag-and-drop           driven alerts, all via a web browser and/or
experience. It offers a complete picture of       their mobile device.
your data and helps you bridge the gap $144 USD/USER/YEAR (TABLEAU SERVER)
between data preparation and analytics, for
better business results.                    $180 USD/USER/YEAR (TABLEAU ONLINE)

$840 USD/USER/YEAR

                                                  1 For full comparison of Tableau licenses, visit Tableau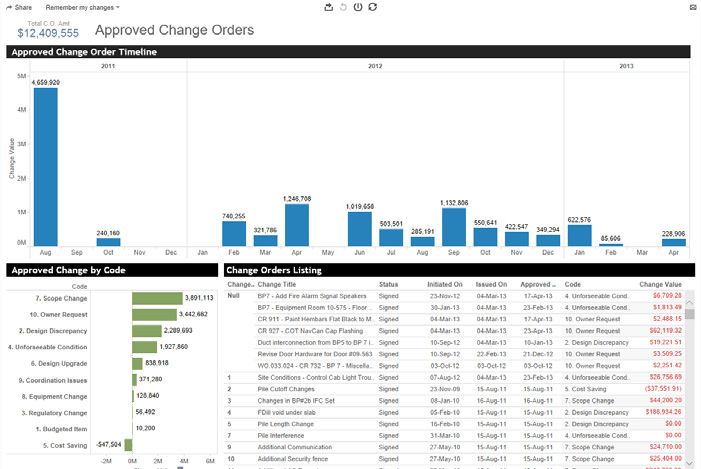
10

 BUSINESS INTELLIGENCE PROFESSIONAL
 SERVICES
 Need help getting things implemented? Want         SERVER INSTALLATION
 to make your visualizations pop? Onware
 offers a variety of professional services. Draw    Onware provides live on-line implementation
 on our experience implementing business            services to help with your deployment. This
 intelligence solutions in organizations of all     includes installation and configuration of your
 sizes.                                             business intelligence servers, whether on
                                                    premises or in the cloud. We will also help to
 CONNECTIONS TO DATA                                determine and implement suitable change
                                                    management and backup strategies for your
 SOURCES
                                                    organization
 Connect directly to your data for live, up-to-
 date data analysis that taps into the power of     TRAINING
 your data warehouse. Or extract data into and
 take advantage of breakthrough in-memory           Training is critical to get the most out of your
 architecture. Or do both, for two, three, or       business intelligence tools. One of our goals
 even ten different data sources and blend          is to help empower users with the ability to
 them all together. It’s up to you and your data.   see and understand their data.

 Onware will help you connect to your data,         PRICING1,2
 and ensure that your data is secure by
 configuration data connection permissions          SENIOR CONSULTANT                    $225 USD/HR
 and row-level filtering as necessary.              INTERMEDIATE CONSULTANT $175 USD/HR

 VISUALIZATION CONSULTING                           JUNIOR CONSULTANT                         $125 USD/HR

 Onware provides live on-line and on-site
 services to help with your data visualizations.
 This includes management consulting and
 business analysis to truly understand your
 needs to develop the most meaningful,
 impactful, and business specific visualizations
 to meet your business requirements.             We also perform fixed fee engagements based on
                                                    specific project requirements. Contact us for more
                                                    details.

                                                    1 Travel expenses to locations outside Edmonton charged at cost.
                                                    2 Billed in half-hour increments.
11
CUSTOM SOFTWARE DEVELOPMENT
SERVICES
Onware also offers a variety of custom software CUSTOM APPLICATIONS
development services.
We can build applications in any language, tool,
Contact us for more information and we can or framework tailored for your organizational
discuss specific project requirements and needs.
build custom proposals and pricing.
PAST PROJECTS
MICROSOFT AZURE
We have experience in a variety of
SERVICES technologies, including:
Turn ideas into solutions with more than • ASP.NET MVC/Razor/Web API
100 services to build, deploy, and manage • .NET Core
applications - in the cloud, on-premises, and • AngularJS
at the edge - using the tools and frameworks • iOS development
of your choice. Onware is an expert with • Universal Windows Platform (UWP) apps
Azure, and configuring deployment optimally • Android Development
• Xamarin
for redundancy and performance.
• SQL Server DB Design and Deployment
• Docker
EXISTING IT INTEGRATION
Let Onware integrate the public cloud PRICING
applications with your existing IT environment
Please contact us to discuss your requirements
for increased efficiency and productivity.
and we can provide pricing.
Discuss specific project requirements with
us and we can build custom proposals and
pricing.
PLANT BOOKINGS AND CONSTRUCTION PROCESS
PERFORMANCE REPORTING DIAGNOSTIC PLATFORM12
GUIDED EVALUATION
INTENT OF GUIDED PREPARING THE DATA
EVALUATION • Identify where the raw data is and how to
connect to it.
The guided evaluation is a tool for organizations • Determine how to optimize the raw data
in the process of evaluating using Business for business intelligence tools to consume
Intelligence to deliver project and corporate it.
financial information to decision makers such • Determine how a client-server deployment
as managers, superintendents, and outside will connect to the data.
agencies.
PUBLISHING AND SHARING
The intent of the guided evaluation is to
answer the following questions: • Publishing and sharing the dashboards
created to a server environment.
1. How will business intelligence tools • Determine and configure security and
integrate with financial systems and what login requirements.
effort is required to make it a mainstream
business service? VISUALIZATION BEST PRACTICES
2. How will business intelligence tools
integrate with other systems (i.e. project Collaboratively build visualizations based on
management, time keeping)? requirements and feedback.
3. How can a production business intelligence CLIENT USE CASES
environment be the most optimally
deployed in terms of technical readiness The guided evaluation will attempt to deliver
and business value? prototype visualizations based on up to
4. What is the estimated capital and four (4) use cases to be determined by your
operational cost of the production stakeholders leading up to the evaluation.
environment?
5. What would be the key milestones to FINISHED VISUALIZATIONS
establish a production service?
The finished example visualizations, based on
your use cases will be published on a server
SCOPE environment. Copies of the working files from
the guided evaluation will be provided as well.
Onware has successfully completed guided
evaluations throughout Canada and the
United States. The guided evaluation will take
a consultative, collaborative, and educational
approach and it is intended to involve key
stakeholders from your organization.13
REQUIREMENTS TRAVEL AND MATERIALS
ONWARE WILL SUPPLY If work is to take place at the client site, the
following travel expenses are reimbursable at
• Evaluation Software, as required. cost:
• Senior Consultant - five (5) business days. • Airfare from Edmonton, AB, Canada.
• Hotel accommodations.
• Ground transportation and parking.
YOU AGREE TO SUPPLY
• Meals while on site.
• Up to four (4) use cases to build dashboard
visualizations. DELIVERABLES
• Appropriate connections to data sources
PROTOTYPES
via VPN or remote desktop connection.
• Key stakeholder involvement during time Four (4) prototype visualizations published in
on-site; namely those with knowledge a server environment. All working files will be
and access to the data being used in the provided.
evaluation and those who understand the
vision. GUIDED EVALUATION SUMMARY REPORT
• Data sources created
COST • Dashboards/Visualizations created
PROFESSIONAL SERVICES • Issues encountered
• Infrastructure requirements for the
A typical guided evaluation is scheduled production environment
to take five (5) business days to complete. • Estimated infrastructure costs, licensing,
Consultant will can be on-site or virtual and design, and services
will need access to key stakeholders and data. • Key milestones and steps needed to move
into production
Cost is based on five (4) days of consulting time.
The amount of work that can be accomplished
during this time is highly dependent on
resource availability and integrity of the data.
Please contact us to discuss your use cases
and pricing.14 CONTACTS ONWARE INC. CANADA Suite 201, 3230 Parsons Road NW Edmonton, Alberta, Canada T6N 1M2 UNITED STATES OF AMERICA 3139 W Holcombe Blvd #A74 Houston, Texas 77025 TELEPHONE +1 (780) 488-9273 E-MAIL business.solutions@onware.com WEBSITE https://solutions.onware.com LINKEDIN https://linkedin.com/company/onware-business-solutions TWITTER https://twitter.com/onwarebiz
https: / / so l utio n s.o nwa re.co m
b u siness.s o l utio n s @ o nwa re.co m
             780-488-9273
You can also read