Overview of Presentation - Identifying Extreme Weather Events through an NSO Climate Data Rescue Project - unece
←
→
Page content transcription
If your browser does not render page correctly, please read the page content below
26/09/2018

 Identifying Extreme Weather Events through an NSO Climate Data
 Rescue Project
 Expert Forum for Producers and Users of Climate Change-related Statistics, 2-4 October 2018

 Task Force on Measuring Extreme Events and Disasters, 5th October 2018

 Paul McElvaney and Dimitri Cernize
 Environment and Climate Division, CSO Ireland

                                               Overview of Presentation
1. Climate daily data rescue project (1830s-1959)
        • What is involved in data rescue project
        • Data capture process of daily data
        • Data quality checking of daily data
        • Creating one longitudinal file

2. Climate indicators
3. Identifying extreme events through internet and data

                                                                                                       1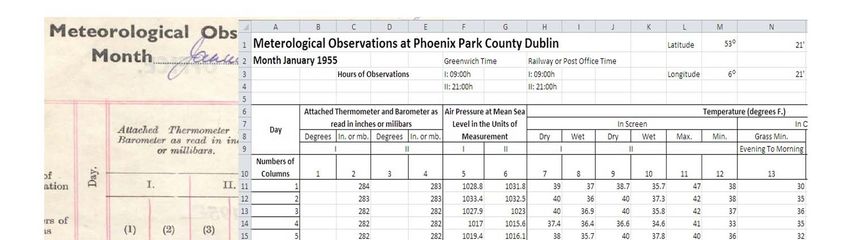
26/09/2018
1. Climate Daily Data Rescue Project
• CSO research motivated by UNECE meetings on climate indicators and extreme events
• Weather is a main cause of many extreme events and a major factor in the supply of many ecosystem services
• Research on climate change indicators made CSO aware that pre-1960s daily meteorological data for Ireland was generally not computerised (pre-1940s for
rainfall)
• The CSO has a role in the development of the Irish Statistical System including ensuring that the statistical potential of administrative records is realised
• CSO offered to assist Met Éireann with data rescue and it was agreed that given our experience with capturing and processing large scale datasets that we would
take on a data rescue of the full monthly meteorological sheets
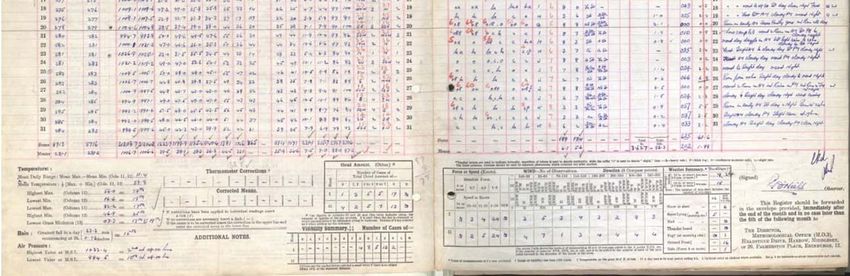
• Each monthly sheet contains around 40 data items for each day as well as summary monthly tables
Manuscript Daily Data Page
• Thermometer and barometer readings • Weather summary**
• Air pressure • Visibility indicators*
• Various temperatures • Cloud formations**
• Humidity • Rainfall
• Sunshine hours
• Wind force and direction*
• Remarks**
2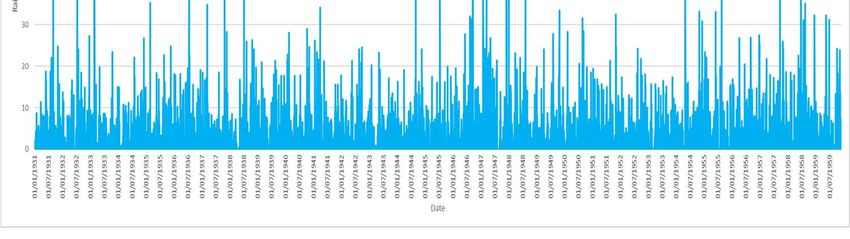
26/09/2018

        3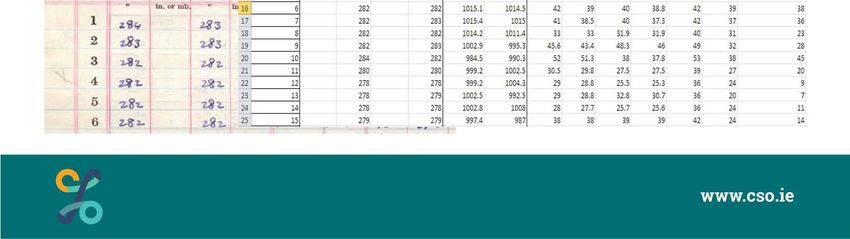
26/09/2018

                                    Data Quality Checking of Daily Data
•   Met Éireann will integrate the fully checked daily data from the data rescue project with daily data from 1960 onwards and publish this as a research file on
    their website
•   Quality of daily data must be very accurate as the file will be used at daily level
•   Initial CSO checks are to compare consistency of daily data with monthly summary tables in monthly report e.g. monthly summary table may have maximum
    temperature in shade as 72.8° F on 15th May 1892 which should correspond with the highest daily temperature in shade in that month
•   Monthly sheets contain totals and means for numerical variables and these are recalculated by CSO from daily data and compared
•   Further checks for outliers e.g. cloud formation codes that only occur a few times
•   Data checking is taking as long as data capture
•   Meteorological offices checking standard is to have two persons key same month and compare but SAS offers an alternative approach

                                             What is Involved - Tasks Sequence
•   Manuscripts sent by Met Éireann to external company for scanning
•   Scanned images named by Met Éireann e.g. MO-1_54_095_c_-
•   Images sent to CSO for keying
•   CSO designed excel template to look like scanned images
•   Monthly daily data excel file read into SAS and checked by CSO
•   Further visual checking of keyed month
•   Integrated time-series file of all years created by CSO
•   Data returned to Met Éireann in one tab-delimited file
•   Monthly excel files available to Met Éireann

                                                                                                                                                                            4
26/09/2018

                                CSO Resource Requirements for Data Rescue
•   Day to day management of project at statistician level (recent recruits)
•   Excel templates designed to reflect monthly sheets completed by meteorological officer
•   SAS used to create a consistent time series file (consistent naming of SAS variables)
•   SAS used for checking keyed data
•   Data checking is very important but very time-consuming as there have been many changes in the design of the monthly recording sheet => new templates and
    SAS programs
•   Longitudinal file will be created for Met Éireann with every data item consistent over time
•   Each station month takes around six hours on average for all tasks
•   -> 2 hours keying; 2 hours checking; and 2 hours excel and SAS programs for longitudinal consistency
•   120 years by 12 months by 6 hours = 8,640 person hours for Phoenix Park

                                                 Daily versus Monthly Data
•   Monthly maximums, means, minimums currently used for pre 1960s analyses
•   Advantages of daily data:
•   - more granular analyses including combining months to identify spells of exceptional weather
•   - variables can be cross-classified e.g. relationships between air pressure, humidity, rainfall, and temperature
•   - analyses of general and extreme weather patterns e.g. days with very high rainfall
•   - more flexible calculation of indicators e.g. length of frost-free season, drought, and heatwaves
•   - Frequency of unusual weather e.g. days when snow was on the ground in the Phoenix Park

                                                                                                                                                                        5
26/09/2018

                   Year                Snow lying on the Ground in Phoenix Park 1912‐1959

                                    Jan                Feb           Mar             Apr             Dec              Days
                   1947                            6          26               8                0               2              42
                   1937                            1             1           14                 0               4              20
                   1941                      16                  2             0                0               0              18
                   1955                            5          10               0                0               0              15
                   1950                            0             0             0                0             12               12
                   1952                            9             1             0                0               2              12
                   1958                            6             4             1                1               0              12
                   1945                      11                  0             0                0               0              11
                   1956                            1             9             0                0               0              10
                   1917                            3             5             0                0               2              10

                                                       2. Climate Indicators
There are many weather-related indicators and 30 year averages are often used as a benchmark period to evaluate short-term data e.g. 1981-2010
Shorter periods such as 10 minute intervals and real-time satellite imagery (Copernicus) are used by meteorologists and emergency alert teams to
respond in real-time to storms and floods
Indicators can be adjusted for specific purposes
Climatological community has defined four types of drought:
•     Meteorological drought (dry weather periods)
•     Hydrological drought (risk of impact on river ecosystem)
•     Agricultural drought (impact on agriculture)
•     Socio-economic drought (impact on public water supply)

                                                                                                                                                           6
26/09/2018

                                               Example Climate Indicators
•   Maximum, Mean, Median, Minimum, Percentiles
•   Frost days (daily minimum temperature < 0° C)
•   Ice days (daily maximum temperature < 0° C)
•   Summer days (daily maximum temperature > 25° C)
•   Tropical nights (daily minimum temperature > 20° C)
•   Heatwave (five consecutive days > 25° C for Ireland)
•   Absolute drought (15 days with all < 0.2 mm)
•   Partial drought (29 days with total < 5.8 mm)

                                                           Rainfall Indicators
•   There are many climate indicators that can be derived from rainfall data such as wet days (>1 mm) and very wet days (>20 mm). Rainfall data can also be used
    to identify historical floods and droughts that may have impacted on human settlements, non-residential premises, agriculture, and water ecosystems.
•   An absolute drought is defined as a consecutive period of at least 15 days where the daily rainfall was less than 0.2 millimetres on each day.
•   There were 10 absolute droughts recorded at the Phoenix Park during 1931-1959.
•   Analysing absolute drought periods in conjunction with other weather data adds important context
•   The longest absolute drought in the Phoenix Park during 1931-1959 was in 1947 and lasted for 32 days. It occurred in conjunction with a mean maximum
    temperature during that period of 72.8° F (22.7° C). In contrast the 1932 drought in February/March had a mean maximum temperature of 45.7° F (7.6° C).
•   Partial drought indicator (29 days < 5.8 mm) would result in only 3 partial droughts during 1931-1959

                                                                                                                                                                           7
26/09/2018

Absolute   Start        End          Duration    Mean maximum temperature   Mean minimum temperature
drought

    1      13/02/1932   04/03/1932     21 days            45.7 °F                       32.9 °F

    2      02/09/1933   16/09/1933     15 days            69.0 °F                       48.6 °F

    3      03/04/1938   01/05/1938     29 days            55.3 °F                       33.6 °F

    4      22/05/1939   09/06/1939     19 days            68.7 °F                       44.1 °F

    5      01/03/1945   17/03/1945     17 days            53.5 °F                       38.7 °F

    6      01/05/1946   15/05/1946     15 days            56.7 °F                       38.5 °F

    7      03/08/1947   03/09/1947     32 days            72.8 °F                       50.6 °F

    8      03/03/1953   24/03/1953     22 days            50.6 °F                       32.9 °F

    9      12/04/1954   29/04/1954     18 days            55.7 °F                       35.7 °F

    10     04/07/1955   01/08/1955     29 days            71.7 °F                       51.5 °F

                                                                                                               8
26/09/2018

                                        3. Steps in Measuring Extreme Events
•   CSO has recently started compiling an inventory based on internet searches of weather-related terms e.g. flooding, wildfires, storms, and reports
•   CSO will also compile an inventory based on daily weather data from 1960 onwards from the Met Éireann website: https://www.met.ie/climate/available-data/historical-data
•   The characteristics of known exceptional events from the internet inventory will be identified in the daily data e.g. amount of rainfall that resulted in a media reported flood event
•   Create a provisional register from daily weather data using thresholds associated with media reported events and meteorological definitions of indicators
•   SAS programs will be written flexibly to allow changes to be made easily in the duration and intensity thresholds e.g. 10 days with maximum daily temperature > 25° C rather than five days
•   Duration and intensity inclusion thresholds can be lowered to include exceptional but not extreme events
•   Typology of events will initially be based on UNECE and SENDAI framework etc.

                                                                                                                                                                                                          9
26/09/2018

Family Geophysical                          Hydrological                         Meteorological                      Climatological              Biological                      Extra‐terrestrial
       Earthquake                           Flood                                Convective Storm                    Drought                     Animal Incident                 Impact
       Mass Movement                        Landslide                            Extratropical Storm                 Glacial Lake                Disease                         Space Weather
       Volcanic Activity                    Wave Action                          Extreme Temperature                 Outburst                    Insect Infestation
 Main
                                                                                 Fog                                 Wildfire
Event
                                                                                 Tropical Cyclone

        Ash Fall                            Avalanche : Snow,                    Cold Wave                           Forest Fire                 Bacterial Disease               Airburst
        Fire following EQ                   Debris                               Derecho                             Land Fire: Brush,           Fungal Disease                  Collision
        Ground Movement                     Coastal Flood                        Frost/Freeze                        Bush, Pasture               Parasitic Disease               Energetic Particles
        Landslide following EQ              Coastal Erosion                      Hail                                Subsidence                  Prion Disease                   Geomagnetic
        Lahar                               Debris/Mud                           Heat Wave                                                       Viral Disease                   Storm
        Lava Flow                           Flow/Rockfall                        Lightning                                                                                       Radio Disturbance
        Liquefaction                        Expansive Soil                       Rain                                                                                            Shockwave
        Pyroclastic Flow                    Flash Flood                          Sandstorm/Dust storm
        Tsunami                             Ice Jam Flood                        Snow/Ice
Peril                                       Riverine Flood                       Storm Surge
                                            Rogue Wave                           Tornado
                                            Seiche                               Wind
                                            Sinkhole                             Winter Storm/Blizzard

                                        Analyses of Currently Computerised Daily Data (1960+)

    •     https://www.met.ie/climate/available-data/historical-data
    •     Around 17 million days of data for around 1,800 stations from around 1960 forwards (rainfall data back to 1940s and many manual volunteer stations only record rainfall)
    •     Around 4 million hourly records which could be used to identify more intense weather e.g. downpours
    •     Can be downloaded by public from meteorological agency’s website
    •     Enables identification of exceptional weather and development of thematic reports e.g. Heatwaves in Ireland
    •     However 1960s was already the start of increased car ownership and foreign holidays so longer time series preferred
    •     Meteorological stations are geo-coded so maps possible and potential to use for SDG reports
    •     Monthly and seasonal variations and long-term changes in those patterns can be looked for
    •     Shortcomings include missing data and inconsistency in available variables across stations

                                                                                                                                                                                                        10
26/09/2018
Minimum Temperature < -15° C in 1960s-2018
Period (13 days) Counties
16th and 17th February 1969 Mayo
1st and 2nd January 1979 Carlow, Kildare, Louth, Meath (both days), Offaly
12th January 1982 Offaly
7th January 2010 Kilkenny
3rd December 2010 Kilkenny
20‐25 December 2010 Cavan, Dublin, Galway, Mayo (all days), Roscommon, Sligo
Heatwaves in Ireland 1960s-2018
Defined as five consecutive days > 25° Celsius
• 354 heatwaves were recorded at meteorological stations across all of the 26 counties in Ireland (112 in 1995 but 2018 data have only been downloaded up to
around June)
Using five consecutive days > 28° Celsius
• 9 heatwaves were recorded across 7 counties
Using three consecutive days > 30° Celsius
• 4 heatwaves were recorded across 4 counties and three years
• Offaly (1976), Kilkenny and Wexford (1983), and Clare (2018)
1126/09/2018
Highest Daily Rainfall 1942‐2018 Station County Date
260.3 mm Beenreagh mountain Kerry 03/10/2016
243.5 mm Cloone lake, Caragh Kerry 18/09/1993
208.5 mm Torc mountain no.4 Kerry 05/08/1986
206.5 mm Glenvicee, Caragh Kerry 05/08/1986
205.2 mm Moanbane no.2 Wicklow 09/03/1995
201.2 mm Waterville octive no.9 Kerry 03/10/2016
200.2 mm Kilcoole (treatment plant) Wicklow 25/08/1986
198.6 mm Cloone lake, Caragh Kerry 03/10/2016
194.5 mm Ballaghbeama gap Kerry 05/08/1986
192.7 mm Cummeragh mountain no.2 Kerry 05/08/1986
Comprehensive Time Series
• One concern is to avoid having greater inclusion of more recent events because of better media coverage and folk memory. Hence we need to identify criteria
based on extreme events, relax the criteria so that more events come into scope of the research (exceptional events) and then do internet and report searches to
see if these potential events suggested by the daily data resulted in actual events
• The media searching has resulted in a lot of material including reports such Landslides in Ireland (published 2006), Snowfall in Ireland (2012), and Extreme
Wave Events in Ireland (published 2013) however generally no ongoing data collection mechanisms were established so the series in these reports are not being
updated on a systematic basis
• Final step will be to try and obtain costings for the major events (damage caused and subsequent mitigation and adaptation expenditure). This will create
possibility of comparing any reductions in damage costs in repeat events with prevention costs. This work will probably be of most interest to policy-makers and
local authorities.
1226/09/2018
Conclusions
• Climate change would impact on social and economic aspects of life and of our environment
• Meteorological variables provide important front-line insight into extreme events
• Longer time series should result in a much more granular understanding of climate change
• Climate change impact could vary greatly within a country and across seasons
• Ecosystem services would be affected by significant climate change
• Daily data can lead in the identification of actual extreme events especially historical ones
• Meteorological offices have in-depth knowledge and WMO is working on climate indicators
• Statistical offices have generally not been involved in climate and meteorological analyses
• Statistical agencies and offices can lead in integrating weather and climate data into official statistics
13You can also read