India Mobile Broadband Index 2021

Page created by Joe Spencer
 
CONTINUE READING
India Mobile Broadband Index 2021
India Mobile
Broadband Index 2021

0
India Mobile Broadband Index 2021
About Nokia
     MBiT Index
    Nokia MBiT Index is a report
    on mobile broadband performance
    in India. It aims to provide valuable
    insight, data and analysis on mobile
    broadband and traffic growth in India, by
    co-relating these trends with various demand
    and supply-side drivers of the connectivity ecosystem
    such as handsets, devices, content, subscriber usage
    patterns and network investments by mobile operators.

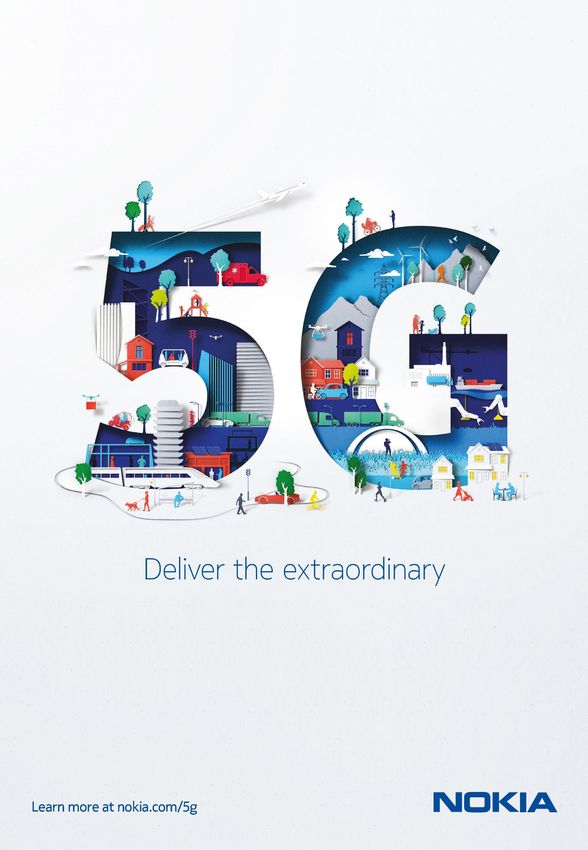
    As India is gearing up to embrace 5G, demand for
    robust mobile and data connectivity amid COVID-19        MBiT Index has
    has led technologies such as fixed wireless access       been created
    (FWA) to emerge as a cost-efficient broadband            based on Nokia’s
    alternative driving digitalization.                      analysis of data
                                                             obtained from
    This edition of the MBiT Index evaluates 4G, 3G and      various sources.
    overall data traffic growth trends at a pan-India and
                                                             It analyses mobile
    circle category level, and data consumption per user
                                                             broadband traffic
    on 4G and 3G for 2020. It highlights the current
                                                             trends only at a
    device ecosystem for 4G and VoLTE devices in India
                                                             consolidated level
    as well as users’ data usage patterns in terms of type
    of content being consumed and its key drivers.           and does not
                                                             intend to provide
    The report also outlines the impact of COVID-19          a comparative
    on broadband performance, particularly fixed             analysis of data
    broadband which is changing the overall consumption      growth for different
    patterns. It highlights how emerging technologies are    operators.
    likely to revolutionize the overall broadband
    connectivity supplemented by Govt initiatives
    and the growing opportunities for consumers,
    CSPs and enterprises.
1
India Mobile Broadband Index 2021
With ~60x traffic growth in last 5 years and 13.5 GB avg.
data usage per subscriber per month, India stands tall
amongst the mature markets
    Massive increase in content consumption amid COVID-19 coupled with
    rising smartphone users, leading to increase in 4G data traffic

            Overall data traffic increased by 36% in 2020 due to
     1      continued 4G consumption, while 3G data traffic showed its
            highest ever decline of 56%

            4G constituted 98.7% of total data traffic consumed across
     2      the country; category A & B circles accounted for 76% of total
            data traffic

      3     Overall avg. data usage per month registered a CAGR of 76%
            from 2015-2020 reaching 13.5 GB in December 2020

     4
            4G device base reflected a continuous growth of 20% in 2020.
            VoLTE handsets support grew to 93% of unique 4G devices

            With ~5 hours of daily time spend on smartphones, India is

     5      one of the highest consumers of data per day, surpassing
            China; short videos have emerged as the fastest growing
            content category

            With only 22 mn fixed broadband subscribers, India poses
     6      significant growth opportunities both in terms of FTTx
            and FWA to generate a new revenue stream for operators

2
India Mobile Broadband Index 2021
With 100 mn new additions, 4G subscribers surpassed
700 mn, consuming ~99% of overall mobile data traffic

Pan-India mobile data usage –in Petabytes (PB**) per month, December 1
                 122
      Dec-20                                              9640                                            9762

                                                                                                        2586
                 277
      Dec-19                                   6899                                    7176

                                                                                   2309
                 395
      Dec-18                           4472                           4867                            y-o-y growth*

                                                             2539
                 398
      Dec-17              1930                2328                                                     36%
                                  1402
                 103
      Dec-16       823           926
                                                                                                  40%          -56%
                 82              762

      Dec-15             164
                  82

                           Payload 3G              Payload 4G          Total Payload          y-o-y absolute growth

    4G traffic is 98.7% of overall mobile data traffic. Continued upgradation to 4G &
    increased online traffic due to COVID-19 have driven higher data consumption.

    Post introduction of 4G                    Majority of the data traffic            Increased online
    services in 2016, total                    in 2020 was driven by                   education, remote working
    data traffic increased by                  movement from 3G to 4G                  for professionals and
    ~60 times (2015-2020),                     due to continuous network               higher OTT viewership
    one of the highest in the                  upgradations and closure                have also contributed to
    world.                                     of 3G services.                         the data traffic growth.

Data subscribers by technology, December 2020 2
    In mn       702                                           • 4G data users have increased by 17% (y-o-y)
                                                                with 4G penetration in the country reaching to
                                                                61%
                                              23
                                                              • 3G subscribers exhibited a steep decline of 56%
                                                                in 2020 due to shut down of 3G services by
                 4G                           3G
                                                                major operators
3    Source: 1. Nokia Analysis 2. Operator Quarterly Reports, TRAI
     * Represents y-o-y growth for Dec-19 to Dec-20 ; **1PB=1000 TB
4G constitutes ~99% of total data traffic across all
categories

           4G         3G           4G contribution%              3G contribution%             y-o-y Growth (3G+ 4G)2

Metro payload1 (contributed to 9% of overall 4G payload)

                                                                                                           99%
                4G                   737        97%                             4G                 897
Dec 2019

                                                                   Dec 2020
                                                         23%                                                       19%

                3G                    22        3%                              3G                   4     0.4%

Category A payload1 (contributed to 37% of overall 4G payload)

                                                 96%                                                       99%
                4G                    2504                                      4G                 3597
                                                                   Dec 2020
Dec 2019

                                                           53%                                                     39%

                                                  4%                                                45      1%
                3G                    104                                       3G

Category B payload1 (contributed to 39% of overall 4G payload)

                                                                                                           98%
                4G                    2663                                      4G                  3704
Dec 2019

                                                 96%
                                                                    Dec 2020

                                                           43%                                                     35%

                3G                     123        4%                            3G                   60     2%

Category C payload1 (contributed to 15% of overall 4G payload)

                4G                                                                                         99%
                                      995         97%                           4G                 1442
Dec 2019

                                                                     Dec 2020

                                                           50%                                                     42%
                3G                     28         3%                            3G                   14
                                                                                                            1%

    Circle categories A & B constituted 76% of Pan India traffic.
    Category A, B and C saw higher growth rates in 2020 than metros due to operator focus
    on 4G in these circles.

4      Source: Nokia Analysis
       1. Payload in PB/ Month 2. Represents y-o-y growth; Dec-18 vs Dec-19 and Dec-19 vs Dec-20
Avg. monthly data usage per user has increased almost
17 times over last five years

                                                                                   3G+4G                 Avg. data per user/month (MB)1
                Avg. monthly
                data traffic per
                user increased                                                                                                         CAGR 76%
                by 20.4% (y-o-y)
                in 2020 driven                                                                                                                                                                13,462
                                                                                                                                                                                   11,183
                by increase in                                                                                                                                       9,653
                data subscribers
                                                                                                                                                      5,728
                and mobile video
                consumption.                                                                          2,758
                                                                                    805
                                                                                    2015              2016                                            2017           2018          2019       2020

    Continued increase in data                                                       The combined (3G+4G) avg.                                                          New users from rural areas,
    consumption has resulted in                                                      data usage per month is at                                                         contributed to the rising
    exponential growth in avg.                                                       13.5 GB and 4G data usage                                                          monthly data usage. Rural
    data usage per month; a                                                          has reached to 13.7 GB1.                                                           consumption accounts for
    CAGR of 76% over the last                                                                                                                                           ~45% of overall mobile data
    five years.                                                                                                                                                         usage2.

                Avg. mobile data/ user/ month vs mobile                                                                           Avg. fixed broadband (FBB) data/ user/ month
                broadband (MBB) penetration3                                                                                      vs FBB penetration4

                                                                                        as of 2020 forecast                                                                                    as of 2020 forecast
                                      25                                                                                                        300
    Avg. MBB data/ user/ month (GB)

                                                                                              Finland
                                                                                                              Avg. FBB data/ user/ month (GB)

                                      20                                                                                                        250                                               South Korea
                                                                                                                                                             South Africa
                                                                                                                                                200
                                      15                                                                                                                     India
                                                 India                                                                                          150                                  Russia
                                      10
                                                                          South Korea                                                           100                    Brazil
                                                         China           Indonesia                                                                                                            China
                                       5                         UK                                                                              50
                                                  Brazil                 Germany
                                      0                                                                                                          0
                                           50%   75%       100%       125%    150%       175%      200%                                               0%        25%         50%        75%    100%        125%
                                                                 MBB penetration                                                                                            FBB penetration

                  India’s current MBB penetration is ~63%                                                                            India’s current FBB penetration stands only
                  with avg. usage of 13.5 GB. The usage is                                                                           at dismal 7.5% of households with avg. fixed
                  expected to grow exponentially with 5G.                                                                            data/ user/ month of 178 GB1.

      There is a headroom for growth in data as well as penetration across mobile and fixed domain.

5                          Source: 1. Nokia analysis 2. Press 3. GlobalData, GSMA, Nokia analysis 4. Ovum, Deloitte
4G capable devices grew 1.2 times with 77% penetration
in 2020; ~2 million active 5G devices
    Growth drivers

    2021 promises to witness double-digit growth            Further, launch of low cost 4G smartphones
    for the smartphone industry as people                   will provide the necessary headroom for
    embrace hybrid work models, binge on web                growth with a significant chunk of 2G/3G
    series and other e-learning needs.                      subscribers to upgrade to 4G smartphones.

    4G capable device base in India1
    Despite COVID-19 restrictions, ~150 mn                                                                20%
    smartphones shipped in India. The nation
                                                                                                                       607
    registered highest ever shipment of +53 mn                                           50%
    units2 in Q3’20.                                                                                  501
                                                                           50%

                                                                                       335
    ~100 mn subscribers having LTE capable
    devices are still on 2G/3G services.                             218

    563 mn VoLTE capable devices
    (93% of total LTE capable device base).
                                                                   2017                2018           2019            2020

    4G/ VOLTE capable device penetration by circle category (% of active subscriber base)1
                                                                                                4G      VoLTE          * as of 2020
                                                            83%

                                                                           79%

    4G capable device penetration reached 77%
                                                                  76%

                                                                                          75%
                                                                                 74%

                                                                                                                        77%
                                                                                                        72%

                                                                                                                              71%
                                                                                                69%

                                                                                                               67%

    at a pan-India level in 2020.

    Metros reported the highest 4G capable
    device penetration at 83%.

                                                             Metro         Cat A          Cat B          Cat C         Pan India

    LTE band ecosystem (% LTE-capable devices)1

                                                             LTE 1800                                          99.7%      + 0.1%
    Majority of the LTE devices are across                   LTE 2300                                         96.7%      + 0.7%
    spectrum bands of 1800, 2300, 850 and 2100
                                                              LTE 850                                         96.3%      + 0.3%
    MHz.
                                                             LTE 2100                                     93.2%          + 3.2%
                                                              LTE 900                                 78.1%              + 7.1%
    LTE 2500 showed the highest annual growth                LTE 2500                           69.1%                    + 10.1%
    among all bands.
                                                              LTE 700        26.3%                                       + 4.3%
                                                                           *as of 2020                        Change from 2019 (%)

6    Source:   1. Nokia Analysis 2. Counterpoint Research
4x increase in smartphone usage to ~5 hrs per day
enabling mobile data as primary means for productivity
and entertainment

                                                                              110                                         2020
            725                           970                                                      400 – 425
            mn                            mn                                bn mins                 bn mins               2025

    Multi-fold growth in internet users to 970 mn                    With surging internet users, total time spent/
    by 2025                                                          month on short content to grow by 4x by 2025

                                      46% Others
        9x                            (Fitness, Fin-Tech, Ed-Tech,
                                      E-Tailing eB2B)
                                                                               2020                         Indians
                                                                                                    spend a highest total of
Growth in avg. MAU
  for short video                     54% Content                                                    4hrs 48 mins
content since 2016                    (Youtube, Social Media, OTT Video)                        per smartphone per day, globally

                                                           Key Drivers

         Short Videos                     Smartphones                      Millennials & GenZ          Regional content

     Short curated                  Rise in smartphone               Shorter attention              Enhanced
     videos establishing            sales (9%, y-o-y in              spans of millennials           personalization and
     high attention of              Q3’20) owing to                  and GenZ are                   regional content
     the viewers.                   increasing middle and            enlarging visibility for       moderation, leading
                                    rural spent on data              creators to invest on          to augmented daily
                                    consumption and                  entertainment and              engagement.
                                    digitalization.                  huge dialect libraries.

    With the advent of 5G, in the next few years, India will see significant growth in short
    videos enabled by richer content, consumer curated content and enhanced peer to
    peer communication.

7    Source: Reedseer Consulting, Press , Nokia Analysis
Fixed broadband revenue forecast to grow 1.5 times by
20251
    Indian broadband market is largely dominated by mobile owing to affordable smartphones, low data
    prices and ease in the provisioning of services, similar to other developing countries.

    Just 22 mn FBB subscribers2 present a significant opportunity for growth

     Broadband subscribers2 (mn)                                            FBB revenues will increase at a CAGR
                                        720.2                               of 8.6% during 2020-251,
                      642.1
                                                                            mainly driven by adoption of higher
                                                                            value broadband plans, digitalisation
               21.9
19.1                                                   Nov-2019             and inflated OTT usage, e-learning,
                                                       Nov-2020             and virtual working.
       Fixed                  Mobile

                                   Some of the key trends driving fixed network growth

         Work from home                 Lucrative bundle          Growth in the FTTH       Proposed exemption
         fuelling broadband             packages offering         subscription             of licencing fees
         demand amidst                  unlimited calling, data   supplemented by          from the existing 8%
         COVID-19                       and OTT to cater to       Govt schemes and         AGR to INR1 per year,
                                        the changing              entry of private         spurring investments
                                        consumption pattern       players                  in the fixed networks

COVID-19: ushering a new era of broadband, particularly fixed broadband3
Amid COVID-19, digital services such as e-commerce, online education and entertainment,
and e-payments witnessed a sizeable increase in consumption across the nation.

           E-commerce                             Work from home                          Content consumed

    • Order-volume growth                 • The initial phase of lockdown           • 30% increase in time
      of 17 % as of June                    witnessed a 30% increase in               spent on education
      2020 compared to                      data traffic.                             apps and a 265%
      February 2020                       • Demand for FBB in tier 2-3 cities         increase in April 2020
                                            increased drastically with                OTT traffic since
                                            customers demanding for higher            February 2020
                                            speed and more data allocation in
                                            their plans

    Although, India has marked a sizeable broadband growth in recent years, FBB accessibility
    through FWA and FTTx will offer significant growth opportunities and help generate a new
    revenue stream for operators.

8    Source: 1. GlobalData    2. TRAI    3. Deloitte
FTTx and FWA – boosting broadband connectivity for
digital India
    Growth in FTTx is essential to improve the quality of telecom services and support surging data demand.

                                                                                          FTTH broadband connections 1 (mn)
    FTTx connections are projected                                                                                                                    4.00
                                                                                                                                            3.42
    to increase from less than 15%                                                                                             2.99
    of total FBB connections in 2019                                                          1.27       1.49         1.73
                                                                       0.69        0.83
    to almost 48.3% by 2025.

                                                                       Dec-14     Dec-15     Dec-16     Dec-17       Dec-18    Dec-19    Jun-20      Dec-20

    Fixed broadband technologies revenue share split2

              Other                      DSL+ Cable
            Broadband
                                                               Fiber
                                                                                             Currently, 32% of telecom towers are fiberized
                                                                                             and is forecast to increase to 70% by 2024.
                             FWA

                 4%                                                                          Government plans to connect 6,00,000 villages
                                            35%
                                                              53%                            with the internet, escalating further growth of
                             8%                                                              FTTH subscribers.

                 % Revenue share by applications 2025

    Similar to FTTx, mmWAve spectrum based                                             5G consumer household FWA subscribers by region3
    FWA is also gaining a lot of traction, globally.
                                                                                    20%                                                            Europe
                                                                                                                       31%            31%
    Global consumer 5G FWA is                                       39%
                                                                                10.3                 CAGR:                    459.1                Asia Pacific
    projected to reach over 50 mn                                                                                              mn
                                                                                 mn                  45.19%
    connections by 2025 and                                                                                                                        MEA
    increase to more than 450 mn                                                       36%                               18%      20%
                                                                         5%
    by 2030.                                                                                                                                       Americas
                                                                                2020                                          2030

    5G FWA proposed frequency bands 4 :

    Frequency                                      Bandwidth    FWA - feasibility          Coverage     Throughput            • 5G spectrum auction
                                                                                                                                in 3.3- 3.6 GHz band
    700Mhz (Low band)                                 NA*                 No               Excellent          Poor
                                                                                                                                expected in H2’2021
    3.4 – 3.8 GHz (Mid band)                        100 Mhz              Yes                 Good             Good            • mmWave band will
                                                                                                                                further boost FWA use
    24.25-27.5 GHz (mmWave)                         400 MHz              Yes                 Poor         Excellent
                                                                                                                                cases
    * Not planned to be used in India currently.

    5G FWA5 : A viable alternative to wired broadband, offering more choice, faster speeds and greater reliability

                    Consumers                                                      CSPs                                            Enterprise
       • An alternative to fast, gigabit-                       • 5G FWA as a backup or                                  • Fast, reliable gigabit-capable
         capable broadband where                                  enhancement for fixed-line                               connectivity for SMBs
         fiber is not available                                   services
                                                                                                                         • Very low latency for mission
       • Small lag for ultra-fast gaming                        • Mobile-only operators can use                            critical applications
         and streaming experiences                                5G-FWA to enter the fixed
                                                                                                                         • An alternative or backup to
                                                                  broadband market
       • Easy self-installation                                                                                            fixed broadband connectivity
                                                                • Faster time to market with                               for remote campus locations
                                                                  existing RAN footprint

9    Source: 1. IDATE/ Digiworld 2. Omdia, Nokia Analysis                       3.Counterpoint research
     4.Opnet solutions       5.Nokia
Way Forward

                              Pandemic has led to demographic shifts in

                      01      demand while accelerating digitalization that
                              include fixed broadband and significantly more
                              data consumption

                          Demand for enhanced broadband and
                          fixed access for more capacity and
                          coverage would further establish the
                          need for 5G in future
                                                                         02
                              CSPs would transform into DSP’s (Digital

                      03      Service providers) by offering digital
                              products and services towards
                              consumers and enterprise

                          Industry 4.0 enabled by Private Networks
                          with various IoT and Enterprise use cases
                          would spur LTE, 5G growth and data
                          usage*
                                                                         04
                              Most attractive applications expected to skyrocket

                      05
                              data usage would include video surveillance, video
                              capture and detection applications, immersive
                              applications experience (AR/VR), smart home,
                              factory and public safety

10   *Nokia   MBiT 2020
11
Nokia India
7th Floor, Building No 9A, DLF Cyber City, DLF Phase III
Gurugram -122002, Haryana, India
Tel. +91 124 4504000

Document code: CID210321

About Nokia
We create the critical networks and technologies to bring together the world’s intelligence,
across businesses, cities, supply chains and societies.
With our commitment to innovation and technology leadership, driven by the award-winning
Nokia Bell Labs, we deliver networks at the limits of science across mobile, infrastructure,
cloud, and enabling technologies.
Adhering to the highest standards of integrity and security, we help build the capabilities we
need for a more productive, sustainable and inclusive world.
For our latest updates, please visit us online www.nokia.com and follow us on Twitter @nokia.
© 2021 Nokia
You can also read