Analyzing Amazon's Customer Reviews using SAS Text Miner for
←
→
Page content transcription
If your browser does not render page correctly, please read the page content below
MWSUG 2018 - Paper SB-089
Analyzing Amazon’s Customer Reviews using SAS® Text Miner for
Devising Successful Product Launch Strategies
Manideep Mellachervu, Oklahoma State University;
Anvesh Reddy Minukuri, Comcast Corporation
ABSTRACT
Digital economy is showing a tremendous growth in the 21st century and it is having a massive impact in
the current society. E-commerce is one element of the Internet of Things and its worldwide retail sales
amounted to 2.3 trillion US dollars.1 This shows the popularity of online shopping and it indicates an
evolution of retailers in this industry. A recent study conducted by GE Capital Retail Bank has found that
81% of consumers perform online research before buying products.2 This tells that consumers rely
heavily on others' opinions and experiences in order to buy a product. Businesses need to understand
customers' view of their products and competitors' products for strategic marketing. E-commerce
businesses provide a platform to generate user-experience content through customer reviews, which are
vital for a buyer to choose the best product out of numerous similar products available in the market.
Companies need to analyze the customers' perspective through reviews for a better business, evaluate
customer engagement, and devise strategies for the launch of their products. This paper focuses on
analyzing the customer reviews primarily on Amazon using Python, SAS® Text Miner, SAS® Sentiment
Analysis and SAS® Visual Studio. This project will determine which product features are given high-
ratings/low-ratings, how the high-rating features of a best-selling product are performing compared to a
similar product that is sold by a different vendor; and how to account for the customers' perception to
product price of different brands while launching a similar new product.
INTRODUCTION
The rapid evolution of online market sale helps customers to find the good product, based on online
reviews in e-commerce websites like Amazon. These reviews suggest to determine high and low rating
features of any individual product and thereby provide access to compare high rating features of a
bestselling product with that of other similar products available in the market. It is often important for any
business to understand the customer opinion about a product. The reviews from e-commerce websites
help companies to determine the customer engagement and plan strategies for future products to gain
better business value. Textual data in the form of reviews from Amazon have been gathered to extract the
features of a product.
For the purpose of analysis, five different Bluetooth speakers with a price range of $150-$200, each of
which belongs to different vendors have been chosen. Reviews are obtained from the Amazon website
for each of these products and these reviews are used for further analysis using SAS® Enterprise Miner.
The speakers which are used for analysis are:
Beats Pill 2.0 Portable Speaker – Black
JBL Charge 3 JBLCHARGE3BLKAM Waterproof Portable Bluetooth Speaker (Black)
Ultimate Ears MEGABOOM Charcoal Wireless Mobile Bluetooth Speaker (Waterproof and
Shockproof)
Bose Sound Link Color Bluetooth Speaker (Black)
Altec Lansing iM227 Orbit MP3 Speaker
DATA PREPARATION
Each product in Amazon is assigned to a unique 10 digits Hexadecimal ASIN code. ASIN is an acronym
for Amazon Standard Identification Number. Reviews are collected by navigating to multiple pages from
the product page. Each page consists of a maximum of 10 reviews. ASIN code and range of pages are
used to extract reviews for all products using Python. The extracted amazon reviews for each product are
stored in an Excel workbook. The excel data is then converted to a SAS data set and used for further
1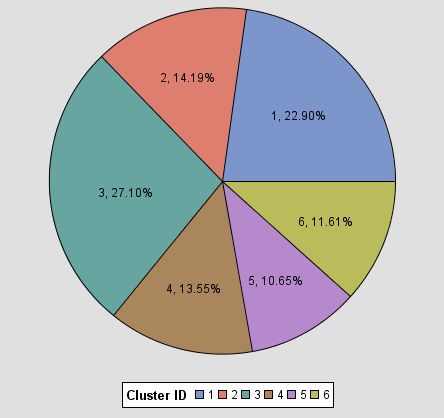
analysis. The variables included in the data set are Author, Comment Header, Posted Date, User Rating
and Comment. But variables used for analysis are only User Rating and Comment.

DATA DICTIONARY
Below are the variables present in the data set after scrapping the data from Amazon.
              Variable                                Description                         Datatype

               Author                             Name of the Reviewer                     Nominal

          Comment Header                       Initial few words of comment                  Text

            Posted Date                Date when comment posted in Amazon                  Ordinal

             User Rating               Rating given by Reviewer on 1 to 5 scale            Interval

              Comment                        Full comment given by Reviewer                  Text

Table 1. Variables Present in the Data Set
Sample extracted data can be seen below.

Figure 1. Partial Data Set Used for Analysis

METHODOLOGY
The SAS data set for each product is then imported into SAS Enterprise Miner 14.2, which is then
partitioned into two data sets using the filter node, one for 1 & 2 ratings and other for 4 & 5 ratings. Here
in the current paper, analysis outputs are displayed only for Beats speakers. Similarly, analysis for
speakers of other 4 brands can be interpreted.
The following figure shows the methodology used for the analysis:

                                                         2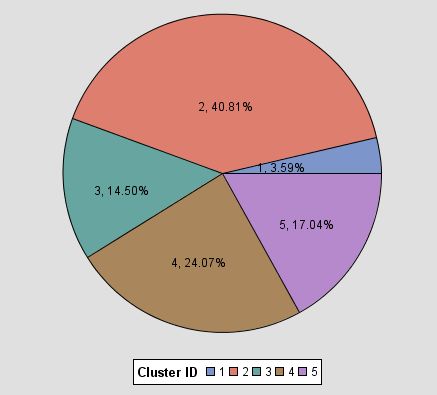
Figure 2. Node Diagram to Generate Clusters
DATA SETS
SAS data sets have been created for each of the products and above methodology is applied individually
for all the products. The data sets used in this analysis are:
Beats.sas7bdat
JBL.sas7bdat
UltimateEars.sas7bdat
Bose.sas7bdat
AltecLansing.sas7bdat
TEXT PARSING
The text parsing node was connected to the data node and default settings are modified using properties
panel before running the node. Following parameters are used in properties panel:
The ‘detect different parts of speech option’ is set to ‘yes’ to be able to treat the same words of
different parts of speech as different.
‘Abbr’, ‘Aux’, ‘Conj’, ‘Det’, ‘Interj’, ‘Num’, ‘Part’, ‘Prep’, ‘Pron’, ‘Prop’ parts of speech have been
ignored.
‘Num’, ‘Punct’ types of attributes have been ignored.
Then each of these data sets is attached to text parse node which is used for ignoring selected parts
of speech. Here Abbr, Aux, Conj, Det, Interj, Num, Part, Prep, Pron, Prop were ignored.
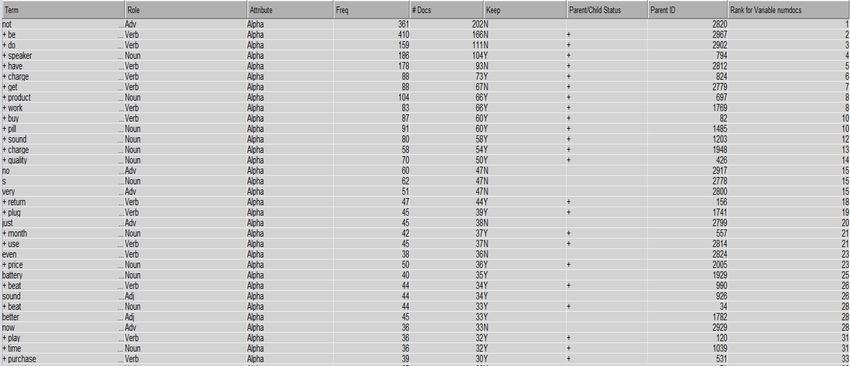
The text parsing node generated a term by document matrix helps to identify the most frequently
occurring words and the number of comments in which each word occurred. Figure 3. displays partial
term by document matrix for Beats speakers having 1 & 2 ratings.
Figure 3. Text Parsing Results for Beats Speakers’ Data Having 1 & 2 Ratings
3Some of the most commonly used words by reviewers in the comments are speaker, not, charge, sound,
quality, which is expected as these words relate to the features of speakers.
TEXT FILTER
Further, parsing node is then connected to text filter node as shown in figure 4. This node filters out words
that occur least number of times specified in the properties panel. Following parameters are changed
from default settings in properties panel:
The minimum number of documents is set to 4.
Check spelling option is set to ‘yes’, which enables SAS to create correctly spelled words in place of
misspelled words.
Figure 4. Grouping of Word Forms and Misspelled Words in Beats Speakers’ Data Having 1 & 2 Ratings
Figure 4 from interactive filter viewer shows various forms of words ‘button’, ‘buy’, ‘cable’, ‘call’, which are
formed into groups along with misspelled words with the help of English dictionary.
Concept Links
Concept links can be viewed in the interactive filter viewer from the properties panel of text filter node.
Concept links are the type of association analysis between the terms used. They can be created for all
the terms that are present in the comments, however, it is meaningful to create links for only a few
important terms. Concept link diagram shows the word to be analyzed at the center and the words which
4are associated with that word are connected to it using links. The thickness of the link explains the
strength of association between the two words in reviewer comments. Below are the Concept links for
some of the most frequent terms:
Concept Links for words in Beats Speakers’ data having 1 & 2 Ratings
Figure 5. Concept Link Diagram for Word CHARGE
Concept link diagram in figure 5 shows word CHARGE is highly associated with word PORT which is
associated with word PROBLEM. Hence, one of the reasons for customer dissatisfaction could be
charging port issues.
Figure 6. Concept Link Diagram for Word PRICE
Concept link diagram in figure 6 shows word PRICE is highly associated with words QUALITY, BASS,
SPEAKER, SOUND which suggests that customers relate these parameters to the price of the product.
5Concept Links for words in Beats Speakers’ data having 4 & 5 Ratings
Figure 7. Concept Link Diagram for Word SOUND
Concept link diagram in figure 7 shows word SOUND is strongly associated with word GREAT, indicates
that Beats speaker is a great product with the good sound quality feature.
Figure 8. Concept Link Diagram for Word PRODUCT
Concept link diagram in figure 8 shows word PRODUCT is highly associated with words GREAT,
RECOMMENDED, EXCELLENT, AWESOME. It tells that Beats speaker is a good product and reviewers
highly recommend this product to other customers.
TEXT TOPIC
After connecting the Text Filter node in SAS Enterprise Miner to Text Parsing node, Text topic node is
joined to the Text Filter node, which enables SAS to combine terms into topics for obtaining valuable
insights from data. The number of Multi-Term Topics has been set to 20 in properties panel to understand
data and get the features that reviewers are more interested to comment about the products.
6Figure 9. Text Topic Node Output for Beats Speakers’ Data Having 1 & 2 Ratings
Figure 9 shows 20 different topics with corresponding IDs. Topic 1 states that product stops working
within few weeks of buying whereas Topic 2 suggests that sound quality of Beats speakers is poor but
this topic is of less intense than Topic 3 which explains that battery discharges quickly. Similarly, the other
topics can be interpreted. From topic 6, the other major concern that reviewers express is regarding price
which could be better.
Figure 10. Text Topic Node Output for Beats Speakers’ Data Having 4 & 5 Ratings
Figure 10 shows 20 different topics highlighting the best features of Beats speakers. From topics 2, 6, 11,
20, adjectives excellent, good, great, awesome can be seen which states that product is great with
respect to sound quality.
TEXT CLUSTER
Once the Text Topic node generates the topics, Text Cluster node is connected to the Text Topic node to
know the best and worst features of products based on ratings given by the reviewers. SAS Enterprise
miner allows for grouping terms that closely relate to each other into separate clusters of related terms.
After some trial-and-error, the properties settings for the Text Cluster node are set to generate well-
separated clusters in the cluster space. Default settings are used in the properties panel which results in
the solution with 40 as the maximum number of clusters and 15 as the number of descriptive terms to
describe clusters using Expectation-Maximization Cluster Algorithm.
7Figure 11. Text Cluster Node Output for Beats Speakers’ Data Having 1 & 2 Ratings
Figure 12. Pie Chart Distribution of Clusters Obtained from Figure 11
Text cluster node generates 6 clusters from Beats 1 & 2 reviews data set as shown in figure 11. Cluster 3
has the highest frequency from figure 12. Words in this cluster occur together, the maximum number of
times in comments extracted from Amazon. The worst features of Beats speakers from above cluster
analysis could be charge port affecting the battery and the price of the product.
Figure 13. Text Cluster Node Output for Beats Speakers’ Data Having 4 & 5 Ratings
8Figure 14. Pie Chart Distribution of Clusters Obtained from Figure 13
Text cluster node generates 5 clusters from Beats 4 & 5 reviews data set as shown in figure 13. Cluster 2
has the highest frequency from figure 14. This cluster states that the speaker is portable due to its size.
Clusters 3 and 5 talks about the good sound quality of the speaker. Hence, the best features of Beats
speakers from above cluster analysis could be portability and sound quality.
For remaining four speakers namely JBL, Ultimate Ears, Bose and Altec Lansing, the above process has
been followed starting from Text Filter node till Text Cluster node for both 1&2 as well as 3&4 rating data.
Below screen capture shows the diagram in SAS Enterprise Miner used for whole analysis.
Figure 15. Node Diagram
9JBL Speakers Data Analysis:
Figure 16. Text Cluster Node Output for JBL Speakers’ Data Having 1 & 2 ratings
Nine clusters are generated for JBL speakers 1 & 2 rating data as shown in figure 16. Cluster 3 has the
highest frequency of 31. Cluster analysis shows that JBL has the bad Bluetooth connection
Figure 17. Text Cluster Node Output for JBL Speakers’ Data Having 4 & 5 Ratings
Eleven clusters are formed from JBL speakers 4 & 5 rating data as shown in figure 17. Cluster 3 has the
highest frequency of 245. Cluster analysis shows that JBL speakers have awesome waterproof, great
sound quality and longer battery life.
Ultimate Ears Speakers Data Analysis:
Figure 18. Text Cluster Node Output for Ultimate Ears Speakers’ Data Having 1 & 2 Ratings
Five clusters are generated for Ultimate Ears speakers 1 & 2 rating data as shown in figure 18. Cluster 4
has the highest frequency of 79. Cluster analysis shows that Ultimate ears speakers come with a bad
charger and many people returned them as charger has been damaged within a few days of delivery.
Figure 19. Text Cluster Node Output for Ultimate Ears Speakers’ Data Having 4 & 5 Ratings
Fourteen clusters are formed from Ultimate Ears speakers 4 & 5 rating data as shown in figure 19. Cluster
3 has the highest frequency of 284. Cluster analysis tells that Ultimate ears speakers have the good
waterproof capability, excellent sound quality, good Bass, longer Battery life.
10Bose Speakers Data Analysis:
Figure 20. Text Cluster Node Output for Bose Speakers’ Data Having 1 & 2 Ratings
Five clusters are generated for Bose speakers 1 & 2 rating data as shown in figure 20. Cluster 2 has the
highest frequency of 89. Cluster analysis shows these speakers have issues with battery and Bluetooth.
Figure 21. Text Cluster Node Output for Bose Speakers’ Data Having 4 & 5 Ratings
Nine clusters are generated for Bose speakers 4 & 5 rating data as shown in figure 21. Cluster 5 has the
highest frequency of 630. The highlighted feature for these speakers could be sound quality.
Altec Lansing Speakers Data Analysis:
Figure 22. Text Cluster Node Output for Altec Lansing Speakers’ Data Having 1 & 2 Ratings
Ten clusters are generated for Altec Lansing speakers 1 & 2 rating data as shown in figure 22. Cluster 2
has the highest frequency of 37. From cluster analysis, these speakers have the noise problem, cheap
material.
Figure 23. Text Cluster Node Output for Altec Lansing Speakers’ Data Having 4 & 5 Ratings
Twelve clusters are formed from Altec Lansing speakers 4 & 5 rating data as shown in figure 23. Cluster
8 has the highest frequency of 212. Cluster analysis shows that these speakers have great sound quality,
longer battery life.
11COMPARISION OF FEATURES OF 5 SPEAKERS
Product High Rating Features Low Rating Features Average Rating Price
Beats Portability, Sound Quality Charge Port , Price 3.6 170
Waterproof, Sound
JBL Bluetooth 4.5 149
Quality, Battery life
Waterproof, Sound Charger, Speaker
Ultimate Ears 4 146
Quality, Bass, Battery life Material
Bose Sound Quality Battery, Bluetooth 4.4 160
Altec Lansing Sound Quality, Battery life Noise, Outer Material 3.9 160
Table 2. Ratings and Features of all Speakers
CONCLUSION
Bestselling product in the market is JBL with average rating 4.5 whereas Beats has the least average
rating of 3.6. This would let us understand the features that we need to incorporate while launching a
similar product in the market to withstand the competitor strategies.
Sound Quality, Battery life, Waterproofness, Bass are the features responsible for the higher rating by
the customers. This kind of topics extraction for high ratings will let us know how to message the
products to customers, and this would quickly establish the positive emotional connection with
customers.
● Noise and Price are the primary causes for lower rating by the consumers. We could clearly be cautioned
that we should try to overcome these lower rating features that avoid customer dissatisfaction on the
new launches.
Further, Price could be one of the attributes for customer satisfaction as in most of the products, the
Average rating is inversely correlated to the Price and vice-versa
According to the analysis above, customers focus on buying speakers with a good Bluetooth connection,
has a good battery life, better noise control, includes speaker material, is affordably priced while having
excellent sound quality, is waterproof and has good bass. Hence, this feature analysis helps retailers and
companies to understand customer expectations to create future products that meet the needs of their
customers and gain business value. Additionally, this analysis prototype also benefits the amazon
retailers to constantly view and evaluate the customer’s reviews and increase their brand loyalty by
following the above recommendations.
REFERENCES
1. Retail e-commerce sales worldwide from 2014 to 2021, Statista 2018. Accessed August 2018.
“https://www.statista.com/statistics/379046/worldwide-retail-e-commerce-sales/”.
2. Study: 81% research online before making big purchases: CSA STAFF. Accessed July 12, 2013.
https://sourceforge.net/projects/winmerge/postdownload.
3. Goutam Chakraborty, Murali Pagolu, Satish Garla, Text Mining and Analysis: Practical Methods,
Examples, and Case Studies Using SAS® by SAS Institute Inc 2014, Accessed 20 Mar 2017.
4. Getting Started with SAS® Text Miner 13.2. Cary, NC: SAS Institute Inc., Accessed 20 Mar 2017.
125. Goutam Chakraborty, Jiawen Liu and Mantosh Kumar Sarkar. April 2013. “Feature-Based Sentiment
Analysis on Android App Reviews Using SAS® Text Miner and SAS® Sentiment Analysis Studio.’’
Proceedings of the SAS Global Forum.
6. Jin Meizi, Jiawen Liu, Goutam Chakraborty. March 2014. “A Way to Fetch User Reviews from iTunes
Using SAS®.” Proceedings of the SAS Global Forum, Washington D.C.
7. Goutam Chakraborty, Jiawen Liu and Mantosh Kumar Sarkar. 2016. “Feature-Based Sentiment
Analysis on Android App Reviews Using SAS® Text Miner and SAS® Sentiment Analysis Studio.”
Proceedings of the SAS Global Forum, Las Vegas.
ACKNOWLEDGEMENTS
I sincerely thank my professors Dr. Miriam McGaugh and Dr. Goutam Chakraborty for their constant
support and guidance through every phase of this project
CONTACT INFORMATION
Your comments and questions are valued and encouraged. Contact the author at:
Manideep Mellachervu
Oklahoma State University
(405) 614 9964
manideep.mellachervu@okstate.edu
www.linkedin.com/in/mm2310
Anvesh Reddy Minukuri
Comcast Corporation
(405) 780-5346
anveshreddy_minukuri@comcast.com
https://www.linkedin.com/in/anvesh-reddy-minukuri-4a5a6160/
SAS and all other SAS Institute Inc. product or service names are registered trademarks or trademarks of
SAS Institute Inc. in the USA and other countries. ® indicates USA registration.
Other brand and product names are trademarks of their respective companies.
13You can also read