London Borough of Lambeth: Railton LTN Monitoring Stage 2 Report - Lambeth Council
←
→
Page content transcription
If your browser does not render page correctly, please read the page content below
London Borough of Lambeth: Railton LTN Monitoring Stage 2 Report
Executive
                                   Summary

LA CONFIANCE TRANSPORTE LE MONDE
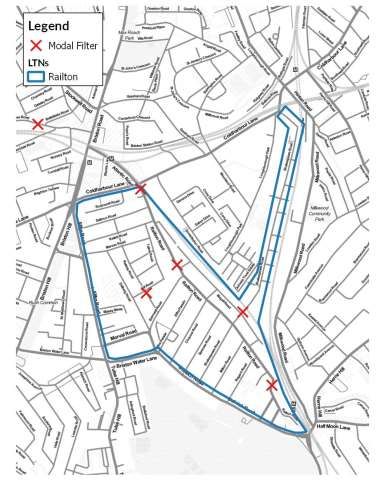
Executive Summary (1)
▪ This stage 2 monitoring report presents data reviewing the
  impact of the Railton Low Traffic Neighbourhood (LTN) on local
  traffic flows, with count sites spread across the inside of the LTN
  and on its boundary roads. This report follows from the stage 1
  interim report published in early 2021.
▪ For analysis, count sites have been classed as “internal” or
  “external”, as represented on the map to the right. Of the 17
  total sites, 10 sites were internal (blue) and 7 were external
  (red).
▪ Throughout the report, data collected before the LTN was
  introduced has been referred to as “pre-implementation” and
  data collected after the LTN was introduced has been referred
  to as “post-implementation.”

  3

Executive Summary (2)
▪ As pre-implementation data was sourced from studies taking place across several years, and post-
  implementation data was collected during 2020-2021 (a time of significant fluctuation in general traffic
  flows), a normalisation adjustment has been made to ensure a fairer comparison of pre- and post-
  implementation data.
▪ For the Railton LTN, the average adjustment to vehicle flows is -4% (i.e. 96% of pre-COVID flows), which is
  more conservative than a direct comparison of pre- and post-implementation flows.
▪ The following impacts have been observed between normalised pre-COVID data and data from April 2021:
  ▪ The overall volume of motor traffic recorded across all streets has decreased by -18%, equating to
      almost 19,000 fewer vehicles counted.
  ▪ The volume of cars counted on internal streets has decreased by -66%, and has changed by roughly -
      2% on external streets.
  ▪ Cycle volumes on internal streets have increased by +62% and by +18% on external streets.
  ▪ Across all streets, the volume of HGVs has decreased by -6% whilst the volume of LGVs has decreased
      by -4%
  ▪ The volume of motorcycles on internal streets has decreased by -33% and increased by +11% on
      external streets, with a 0% change overall.

  4
Executive Summary (3)
 ▪ The total number of cars, cycles and all motor traffic recorded on internal and external roads
   (for pre- and post-implementation) are provided below. Details of further data (collected in
   September 2020) are provided within the main report.

                                Cars                                 Cycles                          All Motor Vehicles

                       Post –         % Change                  Post –         % Change              Post –         % Change
              Pre     May 2021 Change May 2021         Pre     May 2021 Change May 2021    Pre      May 2021 Change May 2021

Internal     26,230    8,950       -17,280      -66%   3,275    5,313     2,038     62%   30,406     11,165    -19,242    -63%

External     69,243    67,257          -1,985   -3%    4,490    5,287         798   18%   79,264     78,765      -500     -1%

All Counts   95,473    76,207      -19,265      -20%   7,764    10,600    2,836     37%   109,671    89,929    -19,741    -18%

   5
Scheme
                                   Introduction

LA CONFIANCE TRANSPORTE LE MONDE
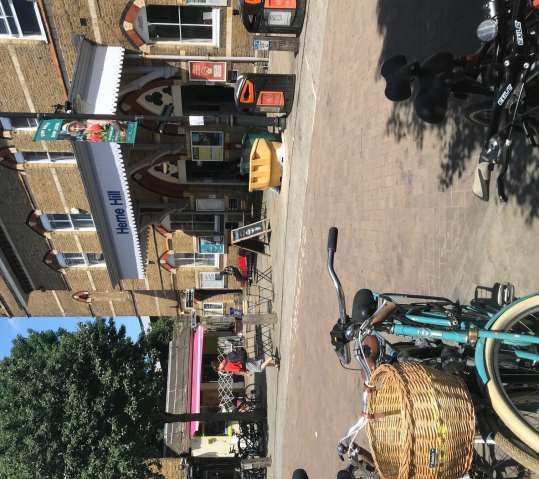
Railton LTN Background
•   The Railton Low Traffic Neighbourhood stretches between
    Herne Hill and Brixton, and is bounded by Coldharbour Lane
    to the north, the A204/Dulwich Road to the east & southeast,
    and the rail line to the west.
•   This LTN is centred around Railton Road, a narrow, yet busy
    route often used by drivers for direct access to Brixton or
    Herne Hill – there are also a number of other feeder streets
    which are often busy as a result.
•   On July 13th 2020, four modal filters were introduced to form
    the Railton Low Traffic Neighbourhood. Further filters were
    added at the junction of Jelf Road and Rattray Road/Dalberg
    Road in Spring 2021.

                                                                    Basemap: Stamen

7
Monitoring Study

LA CONFIANCE TRANSPORTE LE MONDE
Scheme Background
•   LB Lambeth implemented a number of measures as part of its emergency COVID-19 transport response.
    These included Low Traffic Neighbourhoods (LTNs), in accordance with national and regional guidance. In
    the short term, these measures were intended to:
      •   Assist residents in social distancing
      •   Enable essential journeys to be made safely
•   Now, over the longer term, the introduction of the Lambeth LTNs aims to promote a wider change away
    from motor vehicle use towards active travel (walking and cycling) and public transport, improving
    air quality and safety, and reducing greenhouse gas emissions in line with the Lambeth Transport
    Strategy 2019
•   These measures have been implemented as trials
    under Experimental Traffic Orders (ETOs), with data
    collection and analysis completed to inform future
    decisions about their permanence.
•   This data collection and analysis will form the basis
    of the monitoring study.

                                                                      Source: TfL

9
Monitoring Programme
•    SYSTRA is leading the traffic monitoring programme for LB Lambeth’s new Low Traffic Neighbourhoods
     to understand the effectiveness of the schemes at reducing vehicular traffic flows, with data collection
     completed by survey company MHTC.
•    Across the Borough, data has been collected at a large number of individual points using mostly
     Automatic Traffic Counters (ATCs) (and occasionally radar surveys) for a full seven-day week, providing
     flows and speeds by vehicle type. This has then been compared to historic data from those sites or a
     suitable proxy site to understand the impact of the LTNs on different modes during different time
     periods.
•    Monitoring for the LTNs will be completed over three stages:
       •   Stage 1: Initial adjustment (September 2020)
       •   Stage 2: Settling down (May 2021) - current stage
       •   Stage 3: Regular use (if scheme unsuccessful at stage 2)
•    For qualitative feedback from residents, LB Lambeth is also running a separate Commonplace
     consultation and representations and objections can also be made in response to the traffic order.
•    Further independent air quality modelling is also being conducted.

10
Data Collection
• For this Stage 2 report, data was collected at 17 sites, which have
been classed as “internal” or “external”, as represented on the map
to the right.
• Of the 17 total sites, 10 sites were internal (blue) and 7 were
external (red).
• Details for individual sites and their locations can be found in
Appendix C.
Basemap: Stamen
11Data Collection
• As the LTN was introduced as a response to COVID-19, no
comprehensive dataset existed to represent pre-implementation
data. Instead, data was drawn from the following studies
commissioned by LB Lambeth since 2017:
• Healthy Routes: two rounds of data collection to support development
of Healthy Cycling Routes (Nov 2019-Mar 2020)
• 20mph Study: data collected to underpin analysis on the 20mph
Borough-wide speed limit (Jan 2017)
• The Floow: GPS telemetry data, providing detail on vehicle routing
through neighbourhood cells; this data will be used alongside Healthy
Routes data for roads where no historic data was collected to
approximate vehicle flows
• Of the ATC sites, 8 sites use Healthy Routes as a baseline, 6 sites
use the 20mph study and 3 utilise both The Floow data and Healthy
Routes.
Basemap: Stamen
12COVID-19 Impacts
on traffic flows
LA CONFIANCE TRANSPORTE LE MONDEImpact of COVID-19 on vehicular traffic
▪ Since the onset of the pandemic, people’s travel behaviour has changed significantly, with the majority making
far fewer trips, particularly during national lockdowns. This has led to reductions in vehicle traffic throughout
the country. Therefore in analysing the data collected, it will be important to consider these impacts. The chart
below compares traffic across South London, Lambeth, within 2km of the Railton LTN and the closest count site
(Brixton Hill), to volumes in January 2017, according to continuous Automated Traffic Counter (ATC) counts
collected by TfL.
▪ Traffic has been consistently lower than pre-pandemic,
Difference in Traffic Volume vs. Jan-19
120% with particularly pronounced drops during lockdowns. To
account for this a process of normalisation has been
100%
applied to all data collected.
80%
▪ The normalisation process adjusts the data collected to
60% the month when the most recent data was recorded (i.e.
April 2021), and can therefore represent “what would be
40%
expected without the LTN” so all data can be compared
20% on a like-for-like basis.
0% ▪ Further detail on the normalisation process is provided
in Appendix C. All car, LGV and HGV volumes have been
normalised in the same manner.
South London All Lambeth Railton 2km Brixton Hill
14Impact of COVID-19 on cycle flows
▪ As with motor traffic volumes, the number of people cycling has also been affected by the pandemic. The
Department for Transport’s Road Traffic Statistics estimate a 38% increase in cycling in London in 2020,
relative to the average for 2017-2019. Other estimates include:
▪ a 35% increase in London from 2019 to 2020 among Strava users;
▪ a 7% increase in Inner London and a 22% increase in Outer London from 2019 to 2020 as measured by
the company Eco-Counter.
▪ The chart below shows the volume of cycle trips compared to a pre-COVID, March baseline across
England1. A large increase is shown in 2020, although levels appear to have reverted to below or similar to
pre-COVID levels in the latter part of the year and 2021. During the study period, national cycling levels
were only 3% higher than in March 2021, likely due to poor weather throughout May 2021.
Cycle Volumes in England Compared to National ▪ Unlike for motor vehicles, a continuous
March Baseline data set does not exist that is sufficiently
250% comparable to cycling in Lambeth to allow
200% for normalisation of cycle trips. Therefore
150%
100% such a process has not been completed, so
50%
0%
changes in cycle flows observed should be
considered in the context of the changes
described.
15 1https://www.gov.uk/government/statistics/transport-use-during-the-coronavirus-covid-19-pandemicPre-
Implementation
Flows
LA CONFIANCE TRANSPORTE LE MONDEPre-Implementation Flows ▪ Pre-implementation flow data was drawn from a range of studies which took place between 2017 and early 2020. These are presented to the right. All data has been normalised using background flow data from ATCs within 2km of the LTN. ▪ Cycle flow data has not been normalised, reflecting the absence of an appropriate data set with which to perform this process. Similarly, motorcycle flow data shown in the appendices has also not been normalised, as the impact of COVID-19 on motorcycles is likely to have been significantly different to that of general traffic, due to the changes in factors such as take-away food deliveries. However, a historic dataset for these alone is not available. ▪ HGV and LGV data has been normalised, although notes are provided to help understand these numbers in context of wider traffic patterns. Basemap: Stamen 17
Pre-Implementation Flows – Cars
▪ As previously outlined, calculated pre-implementation
  flows are those that would be projected based on
  background TfL data.
▪ On the inside of the LTN, Railton Road previously carried
  a high number of daily car trips (>5,000), whilst
  Shakespeare Road, Barnwell Road and Hurst Street all had
  flows over 2,000 per day.
▪ Outside the LTN, daily flows were highest on Effra Road
  (>18,000), Coldharbour Lane East (near 14,000), Dulwich
  Road (>9,000) and Coldharbour Lane West (near 9,000).

                                                              Basemap: Stamen

18
Pre-Implementation Flows – Cycles
▪ As cycle travel does not follow the same patterns as
car usage and varies significantly based on local
conditions, cycle flows have not been normalised.
The map to the right shows daily flows.
▪ Before the LTN was installed, cycle flows were
significantly higher on Effra Road than anywhere
else (>1,300), although Railton Road and
Coldharbour Lane also carried relatively high
volumes of cyclists.
Basemap: Stamen
19Pre-Implementation Flows – HGVs ▪ The map to the right plots pre-implementation HGV flows. ▪ HGV flows were fairly minimal across the LTN, except on Coldharbour Lane East (>600). There were, however, over 100 such movements a day on Railton Road. ▪ Notably, HGV flows were very low on Effra Road (
Pre-Implementation Flows – LGVs
▪ The map to the right plots pre-implementation
  LGV flows.
▪ Within the LTN, LGV flows were highest along
  Railton Road (>500 daily), whilst on the outside,
  flows were highest on Effra Road and Dulwich Road
  (both >1,000 daily).
▪ On other peripheral roads such as Coldharbour
  Lane and Milkwood Road, LGV flows were between
  500-700 per day.

                                                      Basemap: Stamen

21
Pre-Implementation Flows – Motorcycle
▪ As motorcycle travel does not follow the same
patterns as car usage and delivery trends have
significantly changes throughout 2020-21, flows
have not been normalised. The map to the right
shows daily flows.
▪ Inside the LTN, only Railton Road carried a notable
number of motorcycles before scheme
implementation (261). On boundary roads, Effra
Road carried a much higher number (1,314).
Basemap: Stamen
22Post-
Implementation
Monitoring
Stage 1/September
2020
LA CONFIANCE TRANSPORTE LE MONDESeptember 2020 Flow Change – Cars
▪ The map to the right outlines changes in counts of cars
compared to those pre-implementation, at sites where data was
collected in September 2020.
▪ Inside the LTN, car volumes are down significantly. On Railton
Road, such trips have decreased between 62% and 85% (-4,446
vehicles), whilst on Shakespeare Road volumes have roughly
halved (-1,743 vehicles).
▪ Car volumes on external roads are more mixed. On Effra Road,
Brixton Water Lane and Milkwood Road, volumes have also
decreased (-3,600, -433 and -121 vehicles, respectively), whilst
on Coldharbour Lane West and Dulwich Road volumes are
slightly up (+490 and +160 vehicles, respectively).
▪ Notably, car volumes are up 110% on Rattray Road,
representing an increase of 660 vehicles per day – however, this
is still well within TfL-defined parameters for safely mixing cycles
and cars.
Basemap: Stamen
24September 2020 Flow Change – Cycles
▪ The map to the right outlines changes in counts of cycles
compared to pre-implementation, at sites where data was
collected in September 2020.
▪ In almost all locations, cycle flows are significantly up compared
to pre-implementation.
▪ On Railton Road, cycle flows have increased by around 400 per
day (+39% to 65%), and volumes on external roads have also
almost doubled on Dulwich Road, Brixton Water Lane and
Hinton Road.
▪ Cycle flows are lower, most notably on Effra Road, although it is
noted that previous cycle flows here were the highest in the
area and it is likely that some demand has switched to travelling
through the LTN via Railton Road.
Basemap: Stamen
25September 2020 Flow Change– HGVs
▪ The map to the right outlines changes in counts of HGVs
compared to pre-implementation, at sites where data was
collected in September 2020.
▪ Changes in HGV flows were very mixed across the LTN, although it
should be noted that in almost all cases the baseline volumes
were very low.
▪ The interior of the LTN saw limited change in terms of total HGV
movements, even if some percentage changes were high. For
example, the ~1,700% increase on Rattray Road corresponds to
an additional 32 daily vehicles and ~1,400% increase on Regent
Road to 25 additional vehicles.
▪ This compares to larger changes on external roads, such as the
772% increase (+423 vehicles) on Effra Road and 64% increase
(+75 vehicles) on Dulwich Road. There was also a moderate
decrease in HGV flows on Coldharbour Lane East (-26% or -155
vehicles).
Basemap: Stamen
26September 2020 Flow Change– LGVs
▪ The map to the right outlines changes in counts of LGVs
compared to pre-implementation, at sites where data was
collected in September 2020.
▪ Similarly to HGVs, changes in LGV flows were somewhat mixed
across the LTN due to lower baseline volumes.
▪ Flows along Railton Road significantly decreased (~ -80% on
average, or around -400 vehicles), with generally more moderate
decreases elsewhere within the LTN.
▪ On some boundary roads, LGV flows are down somewhat (-13%
or -162 vehicles on Dulwich Road and -24% or -351 on Effra
Road), but on others they are moderately to significantly higher
than pre-implementation (+56% or +384 vehicles on Coldharbour
Lane East, for example).
Basemap: Stamen
27September 2020 Flow Change– Motorcycles
▪ The map to the right outlines changes in counts of motorcycles
compared to pre-implementation, at sites where data was
collected in September 2020.
▪ Changes in motorcycle volumes are generally minimal throughout
the LTN, with most changes being of fewer than 250 daily vehicles.
▪ The largest change is a significant reduction of motorcycle traffic
on Effra Road (-59% or -773 vehicles).
Basemap: Stamen
28Post-
Implementation
Monitoring
Stage 2/May 2021
LA CONFIANCE TRANSPORTE LE MONDEMay 2021 Flow Change – Cars
▪ The map to the right outlines changes in counts of cars compared
to pre-implementation, at sites where data was collected in May
2021.
▪ Car volumes have continued to decrease in most areas throughout
the LTN, namely on Railton Road where volumes are ~75% or
more lower (>3,000 fewer cars) than they were pre-
implementation .
▪ However, since the September tranche of monitoring, traffic
volumes have increased on a number of boundary roads, namely
Coldharbour Lane West (+16%, ~1,400 vehicles), Milkwood Road
(+35%, ~2,000 vehicles) and Dulwich Road (+9%, ~900 vehicles).
Flows are down on Effra Road, however (-20%, ~3,700 vehicles)
▪ Car volumes on Rattray Road, which saw a jump in traffic after the
opening of the LTN, have returned to pre-implementation levels
with the addition of a new road filter.
Basemap: Stamen
30May 2021 Flow Change – Cycles
▪ The map to the right outlines changes in cycle counts compared
to pre-implementation, at sites where data was collected in May
2021.
▪ Cycle volumes have remained high when compared to those pre-
implementation, particularly on Railton Road where they have
nearly doubled (>500 additional daily cycles).
▪ Cycle flows are also moderately up on boundary roads such as
Milkwood Road, Dulwich Road and Brixton Water Lane. However,
they are significantly down on Effra Road, although baseline cycle
flows here were very high (>1,500).
Basemap: Stamen
31Healthy Cycle Routes ▪ Healthy Routes are those which have the right conditions to enable more people to walk and cycle. They link people with key destinations, and are convenient, attractive and safe for all. ▪ For a Healthy Route to be designated as such in Lambeth, it must have certain key characteristics: ▪ Fewer than 200 vehicles per hour in the average weekday peak hour. ▪ Under 5% of vehicles using the route can be classified as HGVs. ▪ Average vehicle speeds must be
Baseline - Healthy Cycle Routes
▪ Pre-implementation, none of the Healthy Routes sections within
  the LTN would pass LB Lambeth’s criteria.
▪ Railton Road itself has average peak hour flows of over 500
  vehicles per hour, over double the threshold, whilst flows on
  Shakespeare Road are near 350 vehicles per hour in the average
  peak. Barnwell Road also sees average weekly peaks of around
  300 vehicles per hour.

 33
May 2021– Healthy Cycle Routes
▪ Inside the Railton LTN, evidence from May 2021 suggest that
  both the Shakespeare Road and Barnwell Road portions of the
  Healthy Routes now pass based on the aforementioned criteria.
▪ On Railton Road itself, the very low volumes of vehicle flows
  remaining on Railton Road create a higher % share of HGVs than
  would typically be appropriate for a Healthy Route; however, as
  these are mostly TfL buses (and drivers have likely completed Safe
  Urban Driving cycle training as part of their ongoing professional
  development) and are few in number, it is considered that Railton
  Road is still very much safe for cycling and its uses are aligned
  with the Mayor’s Transport Strategy.

 34
May 2021 Flow Change– HGVs
▪ The map to the right outlines changes in HGV counts compared
  to pre-implementation, at sites where data was collected in May
  2021.
▪ Changes in HGV flows were very mixed across the LTN, although
  it should be noted that in almost all cases the baseline volumes
  were very low.
▪ The interior of the LTN saw limited change in terms of total HGV
  movements, even if some percentage changes were high. For
  example, the ~1,000% increase on Rattray Road corresponds to
  an additional 18 daily vehicles, whilst the 126% increase on
  Shakespeare Road North equals to 36 additional vehicles.
▪ This compares to larger changes on external roads, such as the
  57% decrease (-342 vehicles) on Coldharbour Lane East and 347%
  increase (+190 vehicles) on Effra Road.
▪ It should be noted that in May 2021, national levels of HGV
  movements were at 105% - normalisation of flows may therefore
  mean that reported increases in HGV flows are overstated1.
                                                                                                                                            Basemap: Stamen

 35                                      1https://www.gov.uk/government/statistics/transport-use-during-the-coronavirus-covid-19-pandemic
May 2021 Flow Change– LGVs
▪ The map to the right outlines changes in LGV counts compared to
pre-implementation, at sites where data was collected in May
2021.
▪ Similarly to HGVs, changes in LGV flows were somewhat mixed
across the LTN due to lower baseline volumes.
▪ Flows along Railton Road significantly decreased (-80% on
average, or -450 vehicles), with generally more moderate
decreases elsewhere within the LTN.
▪ On some boundary roads, LGV flows are down somewhat (-26%
or -314 vehicles on Dulwich Road), but on others they are
moderately to significantly higher than pre-implementation
(+91% or +618 vehicles on Coldharbour Lane East and +23% or
+340 vehicles on Effra Road).
▪ It should be noted that in May 2021, national levels of LGV
movements were at 107% - normalisation of flows may therefore
mean that reported increases in LGV flows are overstated1.
Basemap: Stamen
36 1https://www.gov.uk/government/statistics/transport-use-during-the-coronavirus-covid-19-pandemicMay 2021 Flow Change– Motorcycles
▪ The map to the right outlines changes in motorcycle counts
compared to pre-implementation, at sites where data was
collected in May 2021.
▪ Changes in motorcycle volumes are generally minimal throughout
the LTN, with most changes being of fewer than 250 daily
vehicles.
▪ The largest change is a significant reduction of motorcycle traffic
on Effra Road (-57% or -748 vehicles).
Basemap: Stamen
37About SYSTRA LA CONFIANCE TRANSPORTE LE MONDE
Introducing SYSTRA
▪ SYSTRA is a global leader in mass transportation and mobility, employing over 7,000
  global employees across 80 countries.
▪ SYSTRA has the unique advantage of being not only a Transport Consultancy, but also Social
  and Market Research Consultancy. Our team members have an in-depth understanding of
  both the transport sector and of social and market research techniques, providing expert
  support in monitoring and evaluation both direct to clients and also in a peer review
  capacity.
▪ We provide a wealth of experience in conducting both qualitative and quantitative transport
  research with stakeholders to help understand their priorities and to inform options for
  future investment and policy development.

39
Contact Us

LA CONFIANCE TRANSPORTE LE MONDE
Contact details:
For enquiries about this report* – Iinfo_uk@systra.com
For Lambeth Council media enquiries – communications@Lambeth.gov.uk

To provide feedback on the Railton Low Traffic Neighbourhood,
please contact the Lambeth Transport Team via the following channels:
           Commonplace engagement site – https://rtstreets.commonplace.is/
           Email – LowTrafficNeighbourhoods@Lambeth.gov.uk

*Please note that due to the volume of questions we are unable to respond to individual queries;
however, we are working with LB Lambeth to create an FAQ document in relation to this
reporting.
              CONFIDENCE MOVES THE WORLD
You can also read