MOVIES ON OTT ANALYSIS USING MULTIPLE REGRESSION AND RANDOM FOREST IN R - IJCRT
←
→
Page content transcription
If your browser does not render page correctly, please read the page content below
www.ijcrt.org © 2021 IJCRT | Volume 9, Issue 6 June 2021 | ISSN: 2320-2882

 MOVIES ON OTT ANALYSIS USING
 MULTIPLE REGRESSION AND RANDOM
 FOREST IN R
 1
 Ms. Deepali Patil, 2Mrs. Aarti Puthran
 1
 Assistant Professor, 2Assistant Professor
 1
 Department of Information Technology,
 1
 Shree L. R. Tiwari College Of Engineering, Mira road

Abstract: Movies are a worldwide source of entertainment, and a powerful medium for educating or indoctrinating citizens. As far
as the current pandemic situation is concerned, OTT platforms act as one of the most entertaining factors and a significant stress
reliever for people around the globe. This project aims to explore all the movies in popular OTT platforms, in order to gain
interesting insights. This is carried out with the aid of a Kaggle dataset, collected from Netflix, Prime Video, Hulu and Disney+
API. Dataset contains the complete information of all the movies, their ratings and the corresponding OTT platforms in which they
are available. It provides detailed information such as Year of release, Genre, IMDb rating, Director and the Language of each
movie. Here in this project we are using Multiple linear regression and Random forest to analyse our data and to get meaning full
insights from the data collected from different OTT platforms collected from Netflix, Prime Video, Hulu and Disney+. Furthermore,
the result obtained from each of these algorithms are compared to understand their respective suitability under varied conditions.
Keywords: Multiple linear regression, Random forest Algorithms, OTT Platform Analysis, Netflix, Disney, Prime Video, Hulu , R
programming

Introduction
Traditionally TV has been the source of entertainment along with recording it within CDs ,after the boom of technology and internet there have
been many OTT ( Over The Top) apps available in the market which has now a days almost replaced the traditional ways of consuming content,
OTT apps like Netflix, Prime Video, Disney Plus, Hulu have emerged and are preferred more due to their ease and self paced content consumption
[4]. Here the data is analysed and some visualization and manipulation are carried to get a more precise and a graphical picture of the entire dataset
and this will help to shed views of a particular product or topic. If people find topics relevant or interesting, then they would desire to share their
opinion about the topic. The topic could be a product or any other object. Understanding this can help us decide and OTT platforms the type of
movies that are popular among the people rather it be depending on reviews, rating or age group. In this project we are also using algorithms like
Multiple linear regression [2] and Random forest [3] to analyse our data and to get meaning full insights from the data collected from different OTT
platforms collected from Netflix, Prime Video, Hulu and Disney+. Furthermore, the result obtained from each of these algorithms are compared to
understand their respective suitability under varied conditions
 These days, technology has got its new and higher pace. This development has changed human‟s way of watching or consuming content now
people can also rate the content or movie according to their views about the movies their opinions, sentiments and views can be expressed on various
platforms like IMDb, Rotten Tomatoes in which they do so these review and rating platforms are nothing but a way through which people express
their thoughts or views regarding the movie. The platforms like IMDb, Rotten Tomatoes will help people to express and others to judge the movie
based on the review of people. So to check how ratings are affected by other factors like runtime, directors etc. there is a need of data which is
required to basically process and analyse the data based the dataset obtained from kaggle we can further process the data depending upon the data
we can find possible ways to do this. R is an open-source approach used for analyzing on-line reviews to perform analysis and visualization on our
data.
Comments, reviews, and opinion of the people about the movie play an important role to determine whether a given population is satisfied with the
movie or not. It helps in predicting the popularity of the movie among a wide range and a wide variety of people on a particular event of interest
like the review of a movie roaming around the world. These data are essential for OTT platforms to perform analysis. This analysis can help us and
the OTT platforms to perform and improve on various aspects like movie recommendation or to judge the type of movie that they push on their
platforms, the popularity of the movie and so on. This analysis can help the OTT platforms to cater a new range of audience and will help their
audience to get better experience ,better movies and will also help them to decide which genres movie will work the best among the audiance.
Twitter generates huge data that cannot be handled manually to extract some useful information and therefore, the ingredients of automatic
classification are required to handle those data. This gain interesting insights. This is carried out with the aid of a Kaggle dataset [4], collected from
Netflix, Prime Video, Hulu and Disney+ API. This interesting insights will help us better understand the current situation or trends of movies that
are extremely popular among the OTT platforms.
The proposed solution is to perform analysis on movie data present on different ott platforms. Analysis can be performed using a number of Machine
Learning Algorithms. This project leverages the concepts of Multiple linear regression and Random forest algorithm to achieve the results.
Furthermore, the result obtained from each of these algorithms are compared to understand their respective suitability under varied conditions.

 IJCRT2106760 International Journal of Creative Research Thoughts (IJCRT) www.ijcrt.org g405
www.ijcrt.org © 2021 IJCRT | Volume 9, Issue 6 June 2021 | ISSN: 2320-2882 Analyzing the Movie data is important for many applications such as OTT platforms trying to find out the response of their movies in the market, predicting popularity of the movie. Pushing movies on platforms based on the current trends in the market. This Analysis on Movie Dataset has a number of applications: Business: OTT platforms like Netflix, Prime Video, Hulu and Disney+ they all use this data to judge the popularity of the movie based on the current trends and thus helps them get insights and push such movies. Recommendation: Recommendation is one of the most important and popular techniques to engage users with their content and this is what OTT platforms look for and through this insights they can easily help them recommend. Reviews :These reviews and rating can help us understand the how the movie is and we get to decide whether to go for it or not. I. EARLIER WORK In the paper [1] Movies Reviews Sentiment Analysis and Classification the authors main focus is how sentimental is performed here goal of this work is to address SA by constructing an approach that can classify movie reviews and then compare the results in an inclusive study of eight well known classifiers. To evaluate the proposed model, IMDB reviews real dataset was utilized. Tokenization was applied on the dataset to transfer strings into word vector, then stemming was used to extract the root of the words, afterwards gain ratio was applied on the dataset as an attribute selection algorithm. Then, the data was split into training and testing datasets using the percentages 66%, 34% respectively. In order to compare the eight different classifiers, five different evaluation metrics are utilized. The results show that Random Forest outperforms the other classifiers. Furthermore, Ripper Rule Learning performed the worst on the dataset according to the results attained from the evaluation metrics. Here we followed paper [2] based on The Performance Comparison of Multiple Linear Regression, Random Forest the paper gave us an detailed classification about the processes . For comparison of there are several data mining techniques, the power production data from a Photovoltaic Module was used in the research. In this study, the model was constituted from seven variables. The highest correlation coefficient was obtained in Artificial Neural Network architecture (R = 0.997). The study by author also showed the importance of data mining method. If this study had been evaluated by MLR then the findings of the study would have been obtained biased and non-robust. So, a study must be evaluated by robust statistical methods in order to estimate a model in a high accuracy rate. This study showed that the MLP-ANN architecture has the best performance when compared with MLR and RF II. PROBLEM STATEMENT Comments, reviews, and opinion of the people about the movie play an important role to determine whether a given population is satisfied with the movie or not. It helps in predicting the popularity of the movie among a wide range and a wide variety of people on a particular event of interest like the review of a movie roaming around the world. These data are essential for OTT platforms to perform analysis. This project leverages the concepts of Multiple linear regression and Random forest algorithm to achieve the results. Furthermore, the results obtained from each of these algorithms are compared to understand their respective suitability under varied conditions. 3.1 Multiple linear regression Regression models are used to describe relationships between variables by fitting a line to the observed data. Regression allows you to estimate how a dependent variable changes as the independent variable(s) change. Multiple linear regression[1] is used to estimate the relationship between two or more independent variables and one dependent variable. You can use multiple linear regression when you want to know: 1. How strong the relationship is between two or more independent variables and one dependent variable (e.g. how rainfall, temperature, and amount of fertilizer added affect crop growth). 2. The value of the dependent variable at a certain value of the independent variables (e.g. the expected yield of a crop at certain levels of rainfall, temperature, and fertilizer addition). The formula for a multiple linear regression is: y = the predicted value of the dependent variable B0 = the y-intercept (value of y when all other parameters are set to 0) B1X1= the regression coefficient (B1) of the first independent variable (X1) (a.k.a. the effect that increasing the value of the independent variable has on the predicted y value) … = do the same for however many independent variables you are testing BnXn = the regression coefficient of the last independent variable e = model error (a.k.a. how much variation there is in our estimate of y) To find the best-fit line for each independent variable, multiple linear regression calculates three things: The regression coefficients that lead to the smallest overall model error. The t-statistic of the overall model. The associated p-value (how likely it is that the t-statistic would have occurred by chance if the null hypothesis of no relationship between the independent and dependent variables was true). It then calculates the t-statistic and p-value for each regression coefficient in the model. IJCRT2106760 International Journal of Creative Research Thoughts (IJCRT) www.ijcrt.org g406
www.ijcrt.org © 2021 IJCRT | Volume 9, Issue 6 June 2021 | ISSN: 2320-2882
The basic syntax for lm() function in multiple regression is −
lm(y ~ x1+x2+x3...,data)
Following is the description of the parameters used −
formula is a symbol presenting the relation between the response variable and predictor variables.
data is the vector on which the formula will be applied.
3.2 Random Forest algorithm
Random Forest [3] is a popular machine learning algorithm that belongs to the supervised learning technique. It can be used
for both Classification and Regression problems in ML. It is based on the concept of ensemble learning, which is a process
of combining multiple classifiers to solve a complex problem and to improve the performance of the model.
As the name suggests, "Random Forest is a classifier that contains a number of decision trees on various subsets of the given
dataset and takes the average to improve the predictive accuracy of that dataset." Instead of relying on one decision tree, the
random forest takes the prediction from each tree and based on the majority votes of predictions, and it predicts the final
output.
The greater number of trees in the forest leads to higher accuracy and prevents the problem of over fitting.
“The spirit is willing, but the flesh is weak.”
Here is the result when the sentence was translated to Russian and back to English:
“The vodka is good, but the meat is rotten.”
This algorihm is implemented using library randomForest in R. This will implements Breiman's random forest algorithm
(based on Breiman and Cutler's original Fortran code) for classification and regression. It can also be used in unsupervised
mode for assessing proximities among data points.
3.3 Performance measure
RMS Error (RMSE) is used to measure the performance of both the algorithms, it can be calculated as:
∑ =1( − )2
= √
III. RESULTS AND DISCUSSION
4.1 Dataset
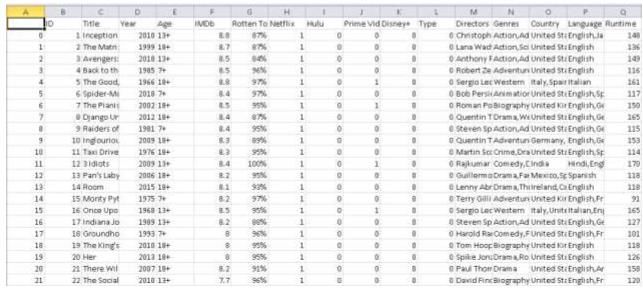
Here, we have used the dataset called movieonstreaming platform from kaggale [4] which contains 16,744 rows and 17
columns
Fig. 1 Dataset of movie on streaming platform
4.1.1 Read Data from csv:
To read data from csv file we can use read.csv
dp1= read.csv("E:\\MoviesOnStreamingPlatforms_updated.csv", stringsAsFactors = FALSE)
The dataset used here basically consists detail about movies like its Streaming service, Rating, Genres it belong to,
Directors etc. related to the movie.
IJCRT2106760 International Journal of Creative Research Thoughts (IJCRT) www.ijcrt.org g407
www.ijcrt.org © 2021 IJCRT | Volume 9, Issue 6 June 2021 | ISSN: 2320-2882
 4.1.2 Data preprocessing before training
 This data was cleaned and further duplicate values were removed so that accuracy of data is maintained and is not
 disturbed due to presence of null or NA values. After cleaning and removal, we got around 15,819 rows in total which
 was further used for processes.

 4.1.3 Data visualization
 Here, we are performing data visualization using ggplot.

 a) Visualizing Number of titles by each country
 Figure 2 display the number of titles presents by each country

 Fig. 2 Visualizing Number of titles by each country

 b) IMDB Trends On Netflix

 Fig. 3 IMDB Trends On Netflix

 IJCRT2106760 International Journal of Creative Research Thoughts (IJCRT) www.ijcrt.org g408
www.ijcrt.org © 2021 IJCRT | Volume 9, Issue 6 June 2021 | ISSN: 2320-2882
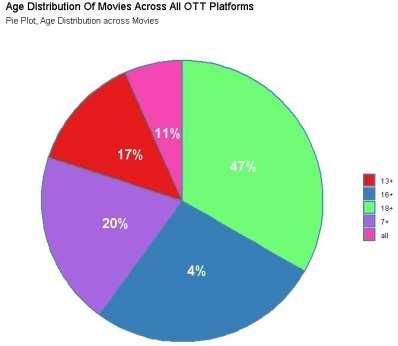
c) Age Distribution Of Movies
Fig. 4 Age distribution of movies
Fig 4 describes 11% shows has no restriction in the age group in the above dataset. I t is clearly visible
that most of the shows in the OTT platforms are targeted for age group greater than 18. An age group of
7 and 13 which may include movies of kid genre.
d) Runtime Analysis of platforms:
ggplot(data = Netflix,aes(x=Runtime))+geom_histogram(fill='red',col='black')+ggtitle("Netflix
Runtime")
ggplot(data = Disney,aes(x=Runtime))+geom_histogram(fill='Blue',col='black')+ggtitle("Disney
Runtime")
Fig 5. Runtime analysis on Disney
Fig 6. Runtime analysis on Netflix
4.1.4 Splitting data for training and testing training and testing set
After preprocessing data is divided into training and testing set using split and subset function in R.
4.2 Multiple Linear Regression
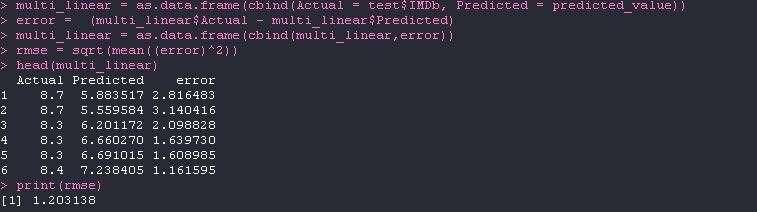
For applying Multiple Linear regression we are considering IMDb ratings as dependent on various independent values such
as Age, Runtime, Year, Genres. Based on these independent values a predicted value is generated for the algorithms that they
are applied on and also a root mean error is generated for the algorithms
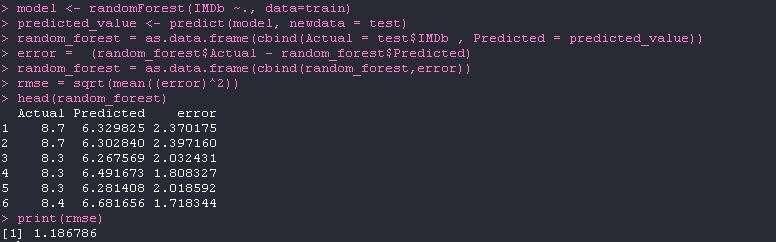
modelwww.ijcrt.org © 2021 IJCRT | Volume 9, Issue 6 June 2021 | ISSN: 2320-2882 error = (multi_linear$Actual - multi_linear$Predicted) multi_linear = as.data.frame(cbind(multi_linear,error)) rmse = sqrt(mean((error)^2)) head(multi_linear) print(rmse) Fig. 7 Output of Multiple linear regression 4.3 Random Forest For applying Random forest we are considering IMDb ratings as dependent on various independent values such as Age, Runtime, Year, Genres. model
www.ijcrt.org © 2021 IJCRT | Volume 9, Issue 6 June 2021 | ISSN: 2320-2882
 V. CONCLUSION AND FUTURE WORK
 6.1 Conclusion
 Herein, I after cleaning and removing duplicate values from data analyzed the data with respect to its IMDb ratings which I
 predicted using many other independent parameters . The aim of this experiment was movies on OTT analysis wherein I
 predict the IMDb ratings based on various other parameters using Multiple Linear Regression Algorithm and Random Forest
 Algorithm. For the data we used kaggle which provided us with the data the data was around 16,744 which was later
 processed and manipulated to get meaning full insights .From results It is clear that the accuracy of Random Forest
 Algorithm with root mean square error = 1.186786 is a bit higher as compared to Multiple Linear Regression Algorithm
 with root mean square error = 1.203138 but as the data will increase the accuracy of the algorithms will also change. Hence
 the addition of more data will help us in better prediction for actual values.

 6.2 Future Scope
 The Existing Database is of around 16k data which is not sufficient to get meaningful insights from the data that accurately.
 Also, this type of database is limited for processing of structured data and has a limitation when dealing with a large amount
 of data. So, the use of Big Data technologies like Hadoop can be used to achieve better results. We could further improve
 our analysis by using various different algorithms and see which gives us better accuracy.
REFERENCES
[1] Yasen, M., & Tedmori, S. (2019). Movies Reviews Sentiment Analysis and Classification. 2019 IEEE Jordan International Joint
 Conference on Electrical Engineering and Information Technology (JEEIT). doi:10.1109/jeeit.2019.8717422.
[2] Kayri, M., Kayri, I., & Gencoglu, M. T. (2017). The performance comparison of Multiple Linear Regression, Random Forest
 and Artificial Neural Network by using photovoltaic and atmospheric data. 2017 14th International Conference on Engineering
 of Modern Electric Systems (EMES). doi:10.1109/emes.2017.7980368
[3] L. Breiman, “Random Forests,” Machine Learning, October 2001, 45, pp. 5–32.
[4] https://www.kaggle.com/anishwarammayappan/data-analysis-of-movies-on-ott-platforms

 IJCRT2106760 International Journal of Creative Research Thoughts (IJCRT) www.ijcrt.org g411
You can also read