PV Smart Grid Monitoring System Based on Hybrid
←
→
Page content transcription
If your browser does not render page correctly, please read the page content below
Indonesian Journal of Electrical Engineering and Computer Science
Vol. 10, No. 3, June 2018, pp. 1061~1069
ISSN: 2502-4752, DOI: 10.11591/ijeecs.v10.i3.pp1061-1069 1061
PV Smart Grid Monitoring System Based on Hybrid
Telepot and Web Server
Eka Maulana1, Ramadhani Kurniawan Subroto2, Lunde Ardhenta3
1,2,3Departement of Electrical Engineering, Brawijaya University, Indonesia
1Collaborative Research Center for Advanced System and Material Technology, Brawijaya University, Indonesia
Article Info ABSTRACT
Article history: Monitoring system in the smart grid is a key aspect that determines the
reliability of transmission and communication systems in the power grid. The
Received Jan 15, 2018 aim of this research is to conduct monitoring in smart grid easier and
Revised Mar 12, 2018 obiquitous remotely. Measured electrical parameters in smart gird are
Accepted Mar 28, 2018 monitored through Telegram social media and webservice internet-based
wirelessly. The role of web service and telepot in the smart grid monitoring
system are installed in Raspberry Pi 3 which responsible to receive and
Keywords: process data from sensor module on each nodes and saved in database. The
MySQL database accommodates amounts of data containing information on
Database the value of current, voltage, power and time stamp which deliver by sensor
PV smart grid node. Web programming is designed using PHP to generate connection to the
Raspberry Pi database and node sensor status that runs continuously. Processed data are
Telegram social media conducted in telepot and it is converted in to *.csv file type before sent to the
Telepot telegram user. The information were also shown in web site as well as in
Wireless monitoring telegram over graph display form that utilize the Highcharts library. Graphs
that shows information on voltage, current, and power values can be accessed
through a browser using IP address from the Raspberry Pi 3 server. When the
users request information to the server, they only need certain command
through Telegram social media or open the web broser to access the
information from the smart grid system.
Copyright © 2018 Institute of Advanced Engineering and Science.
All rights reserved.
Corresponding Author:
Eka Maulana,
Department of Electrical Engineering,
Brawijaya University,
Jalan Veteran No. 11, Malang, 65145, Indonesia.
Email: ekamaulana@ub.ac.id
1. INTRODUCTION
Utilization of renewable energy resources can be conducted using smart grid to provide renewable
energy in Indonesia utilizing solar energy converted [1]-[5] into electrical energy to improve the efficiency of
electricity use and build a micro-scale generator system. Indonesia has abundant renewable energy, but its
utilization is relative small. In addition solar cells implementation, to build micro-scale systems can also
combine wind turbines. The solar cell module is combined with a wind turbine generator and each section or
node consists of generator, storage, control, and load elements supported by converter or inverter [6].
Interconnected nodes are connected to build DC power buses and equipped with communication lines to
transmit monitored data directly or using smart control devices applied [7]-[8]. The use of electric energy
continues to increase every year. This is due to inefficient use of electrical energy, especially in the
household sector. This is shown in the data of sales of the largest electricity energy in Indonesia in 2014
occurred in the household sector which amounted to 42.34% of the total electricity sales. The growing
demand for electrical energy is not proportional to the availability of electrical energy in Indonesia.
Therefore, it takes a solution by utilizing renewable energy using hybrid experimental approximation [9].
Journal homepage: http://iaescore.com/journals/index.php/ijeecs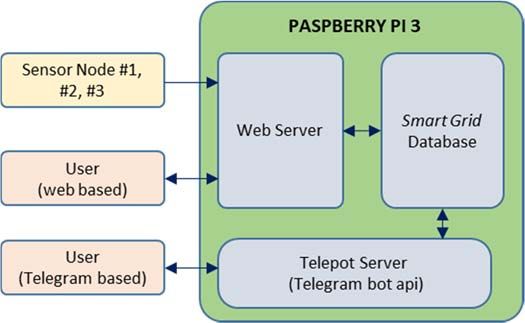
1062 ISSN: 2502-4752
Smart grid is a computerized and automated power grid. In the smart grid, it allows two-way
communication between users and energy providers. In addition, transfer of electrical energy that occurs not
only from the manufacturer to the user, but also vice versa [10]. Smart grid is one solution that uses
renewable electrical energy. The use of smart grid as a renewable energy source needs a way to monitor the
smart grid of each node to find out whether the smart grid is installed properly or not. Real time monitoring
and display of power system components and performance, along the connection and in large geographic
areas, helps operators to understand and optimize the behavior and performance of smart grid system
components [11]-[16]. Smart grid monitoring process can be accessed wirelessly by using internet, so
electrical parameters value can be monitored remotely through social media. This system is designed using
smart grid monitoring system internet-based and application of the IoT for the smart grid system[17]-[19].
The aim of this paper is to provide a technical overview of realizable techniques for monitoring and
control of smart grids based on real time information, actions and monitoring for efficient, applied design and
information access easier. These techniques are analyzed in detail and their effectiveness has been
demonstrated with internet based via web service and telepot bot api. This system requires a server that role
to receive and process data sensors installed on each node, so the data can be sent to the user through social
media especially Telegram and through a web page. Smart grid monitoring via Telegram social media and
the web employ a server run by Raspberry Pi 3 to make cheaper one. The data from the sensor module will
be stored in the MySQL database through the PHP program and will be presented in graphical form through a
website page. Meanwhile, the server in charge of receiving command from user and sending file (*.csv) via
Telegram will be run by Python program. The file sent will contain all the information stored in the database.
It is expected that this study will provide an improvement in the problems found in the design of smart grid
monitoring systems that can be done remotely through Telegram's social media and websites.
2. RESEARCH METHOD
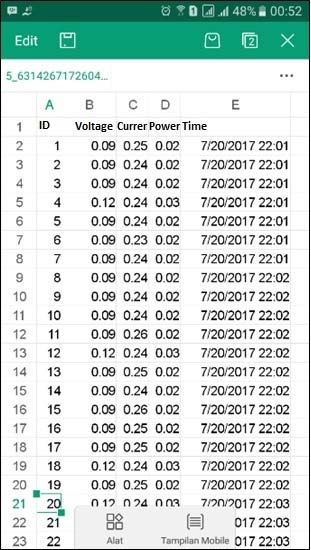
2.1. System Block Diagram
The wireless smart grid monitoring system active when the sensor module on each smart grid node
receive the data of voltage and current values in which the data will be sent to the server via internet. The
internet connection is used as a transfer media for smart grid monitoring data. By using the internet,
monitoring process can be done remotely. in other hand, the server acts as a center to process data received
from each sensor module on the smart grid. Processed data will be displayed on the website and can be
accessed through social media telegram. Users can perform smart grid monitoring through social media
Telegram by sending certain commands so the data received in accordance with the orders sent message. In
general, the overall system design block diagram is shown in Figure 1.
Figure 1. Block Diagram of Smart Grid Monitoring System
2.2. System Specification
Device specification consist of Raspberry Pi 3 which used as a server that receives and processes
data readings of sensors. Monitoring system using social media Telegram and website are combined to access
Indonesian J Elec Eng & Comp Sci, Vol. 10, No. 3, June 2018: 1061 – 1069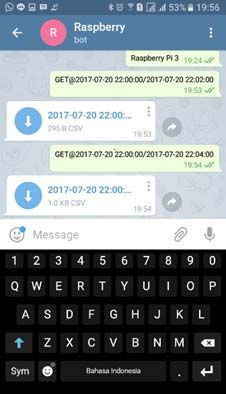
Indonesian J Elec Eng & Comp Sci ISSN: 2502-4752 1063
the information. The process of sending data to social media Telegram is done by sending certain commands
to the Python server. The bandwidth used is 15 Mbps of internet connection and the system send to the user
(smartphone) in *.csv format by request automaticaly.
2.3. Software Design
The design of the software is used to control and manage the work of the tool as a whole. Server is
designed by Phyton and Bot Api Telegram. Phyton software design works to run programs that are able to
read the database, receive the command from the user, create a * .csv file, and send it to the user. The design
of PHP software is used to receive data from the smart grid sensor module and put it into the MySQL
database. In addition, the PHP program is used to create graphical views of data stored in the MySQL
database. Data delivery process of each block is done wirelessly. The proposed smart grid monitoring system
is used 3 sensor nodes and the data transmit wirelessly. Each node will transmit data of measured voltage,
current, and power in the tables in the database that have been created. Smart grid monitoring is done through
social media Telegram through Python program. Python will send files that can be opened with android
applications such as Excel or WPS Office. Block diagram of transmitting data to MySQL database shown in
Figure 2.
Figure 2. Block Diagram of data transmission from sensor nodes and users to the database
The database is created to hold all data of sensor readings on each node-1, node-2, node-3. The
database for each node is constructed with a 5 column structure that will contain the information id, voltage,
current, power, and time as shown in Table 1.
Table 1. Smart grid database table structure
Column name Data Type Extra Primary Key
ID Integer Auto_Increment √
Voltage Decimal (5,2) - -
Current Decimal (5,2) - -
Power Decimal (5,2) - -
Time Datetime - -
3. RESULTS AND ANALYSIS
3.1. Sensor Data Transmitting
The purpose of testing is to know the data received MySQL database is the same as that sent by the
sensor module installed on the smart grid node. Transmitted data were constructed through PHP
programming is shown in Table 2. The data delivery is sent by node-1 to the server directly. In this test, a
packed of data was sent to the database that has been provided through the web by determining local IP
address in Rapberry Pi 3.
PV Smart Grid Monitoring System Based on Hybrid Telepot and Web Server (Eka Maulana)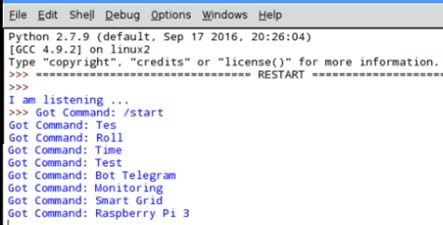
1064 ISSN: 2502-4752
Table 2. Data transmission sensor node 1 to the database
Data in Database
V I P
0,3 0,42 0,12
1,7 0,4 0,68
3,29 0,42 1,37
4,9 0,43 2,11
6,3 0,5 3,13
7,95 0,62 4,89
9,41 0,74 7
10,99 0,89 9,82
12,51 1,05 13,17
3.2. Database Test
The purpose of testing is to determine the duration of data transmission from the smart grid sensor
module to the MySQL database. Testing the speed of delivery is done by providing a delay (delay time) that
varies on the sensor module to send data to the MySQL database. Delay given is 5 seconds, 8 seconds, 10
seconds, and 15 seconds. Obtained a stable delay is 10 seconds. Table 3 shows the most stable delay is 10
seconds with an average of 10.3 seconds.
Tabel 3 Kecepatan pengiriman data ke database
Delay Time (H:M:S) Delay at Database average
(ms) (s) Delay (s)
15:59:23 -
15:59:29 6
15:59:35 6
15:59:56 21
16:00:19 23
5000 10.5
16:00:25 6
16:00:39 14
16:00:46 7
16:00:52 6
16:00:58 6
16:30:06 -
16:30:16 10
16:30:25 9
16:30:35 10
16:30:45 10
8000 9.5
16:30:54 9
16:31:04 10
16:31:13 9
16:31:23 10
16:31:32 9
16:05:57 -
16:06:09 12
16:06:20 11
16:06:31 11
16:06:43 12
10000 10.3
16:06:54 11
16:07:05 11
16:07:17 12
16:07:28 11
16:07:40 12
16:12:53 -
16:13:10 17
16:13:26 16
16:13:42 16
16:13:59 17
15000 16.4
16:14:15 16
16:14:31 16
16:14:48 17
16:15:04 16
16:15:21 17
Indonesian J Elec Eng & Comp Sci, Vol. 10, No. 3, June 2018: 1061 – 1069
Indonesian J Elec Eng & Comp Sci ISSN: 2502-4752 1065
3.2. Graph Display
The purpose of this test is to determine whether the data presented on the graph in accordance with
the data stored on the database. The test displays the graph shown in Figure 3. Based on Figure 3, we get the
values of voltage, current, and power respectively of 2.24 V, 0.25 A, and 0.56 W. The values appear on the
graph correspond to the values contained in the MySQL database. But the time shown is different from the
time stored in the database.
(a)
(b)
(c)
Figure 3. Monitoring graph of smart grid on website (a) node #1 (b). node #2 (c). node #3.
3.4. Command Testing
Testing the delivery of commands from social media Telegram is to determine whether the
messages sent users through social media Telegram can be accepted by Python program. Testing is
conducted by typing messages through social media Telegram and sending to the server run by Python
program.
Table 4. Testing Result of Sent Command
Sent message Received message Respon Server Python
/start /start -
Tes Tes Test
Roll Roll Random value 1-100
Time Time Current time
Test Test -
Bot Telegram Bot Telegram -
Monitoring Monitoring -
Smart Grid Smart Grid -
Raspberry Pi 3 Raspberry Pi 3 -
PV Smart Grid Monitoring System Based on Hybrid Telepot and Web Server (Eka Maulana)
1066 ISSN: 2502-4752
Based on Table 4, it can be concluded that the process of sending messages from social media
Telegram can run well. All messages can be received in accordance with the sent by the user is shown in
Figure 4.
Figure 4. Phython Shell Program Window
Messages sent by the user will get a response from the server if the message is defined in the Python
program. If the message sent is not in the program definision then the server will not respond or reply.
3.5. Testing of Data
This test aims to determine whether the file (*.csv) can be sent by the server to the user or not. This
test is performed with the user sending messages with a specific format that contains date and time
information. So the Python program will execute the function to read the data in the database in accordance
with the desired time range. The data transmission tests are shown in Figure 5.
Figure 5. Telegram Message and File Delivery *.csv to User on Telegram
Database test aims to determine the capacity (size) of data stored in the database. Testing is
observed by filling the database of 100 to 1000 lines containing the information values of voltage, current,
power and time when the data is stored in the database. The memory zise testing in shown in Table 5.
Indonesian J Elec Eng & Comp Sci, Vol. 10, No. 3, June 2018: 1061 – 1069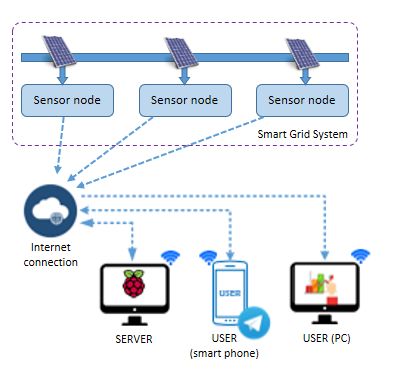
Indonesian J Elec Eng & Comp Sci ISSN: 2502-4752 1067
Table 5. Memory size on database
Row (Database) Memory
100 16 KB
200 16 KB
300 16 KB
400 48 KB
500 48 KB
600 64 KB
700 64 KB
800 64 KB
900 64 KB
1000 64 KB
The overall test is performed to determine the performance of the system that has been designed.
Tests conducted include:
1. Deliver messages from the user to the server to send * .csv files. The result of sending message and files
are shown if Table 6.
Table 6. Testing the sending of commands and files
Test No Telegram Messages File delivery
Sent Not Sent Sent Not Sent
1 √ - √ -
2 √ - √ -
3 √ - √ -
4 √ - √ -
5 √ - √ -
6 √ - √ -
7 √ - √ -
8 √ - √ -
9 √ - √ -
10 √ - √ -
Error 0% 0%
2. Testing file size * .csv and long delivery time. The result of testing file zise and delivery time are shown
in Table 7.
Table 7. File size * .csv and long delivery time
Row Memory Time (s)
100 3,8 KB 5.18
200 7,7 KB 7.24
300 11,7 KB 9.69
400 15.6 KB 11.36
500 19,5 KB 14.79
600 23,4 KB 17.01
700 27,3 KB 20.29
800 31,2 KB 23.69
900 35,1 KB 25.64
1000 39.0 KB 30.12
According to the Table 6, it is obtained the test results sending *.csv file to the user that the largest
file size that is 39.0 KB with 30.12 seconds of delivery time. The transmitted file contains 1000 lines of smart
grid sensor reading module data. As for the file containing 100 rows of data has a size of 3.8 KB and the
required delivery time is 5.18 seconds. This is proportional to the amount of data read by the server and
stored in the file. The result of sending * .csv file to user can be opened with android application such as MS
Excel or WPS Office.
PV Smart Grid Monitoring System Based on Hybrid Telepot and Web Server (Eka Maulana)1068 ISSN: 2502-4752
4. CONCLUSION
According to the design on PV smart grid monitoring system, all of the parts have been successfully
implementated and characterized. The designed PHP program successfully receives data from the sensor
module and stores it into the table of each node in the MySQL database. The time required by the sensor
module to send data to the database wirelessly requires a 10 second with an average time of 10.3 seconds.
MySQL database reading through Python program works well. The database read has 3 tables which each
has 5 columns. Smart grid monitoring graphs successfully display data in accordance with the data stored in
the database. The message delivery and file delivery *.csv are working with 100% success rate.
ACKNOWLEDGEMENTS
This work is supported by LPPM Universitas Brawijaya and Collaborative Research Center for
Andvanced System and Material Technology, Brawijaya University.
REFERENCES
[1] E. Maulana, S.H. Pramono, D. Fanditya, M. Julius, “Effect of Chlorophyll Concentration Variations from Extract
of Papaya Leaves on Dye-Sensitized Solar Cell”. World Academy of Science, Engineering and Technology,
International Journal of Electrical, Computer, Energetic, Electronic and Communication Engineering, vol. 9(1),
pp. 49-52, 2015.
[2] Muslichin, A. Mu’minin, A.H.Y. Fridasavema, M.A.R. Sembiring, C.M. Septani, E. Maulana, “The Thickness and
Firing Duration Dependence of Titanium Dioxide (TiO2) Nanoparticle Against to the Output Power of Dye-
sensitized Solar Cell (DSSC)”. International Journal of Applied Engineering Research, vol. 10(18), pp. 38774-
38777, 2015.
[3] S.H. Pramono, E. Maulana, “Organic Solar Cell based on extraction of Papaya (Carica papaya) and jatropha
(Ricinus communis) leaves in DSSC (Dye Sensitized Solar Cell)”. International Conf. on Edu. Tech and Science
2013 (pp. 248-251), 2013.
[4] S.H. Pramono, et al., “The effect of photoelectrode TiO2 layer thickness to the output power of chlorophyll-based
Dye-Sensitized Solar Cell (DSSC). Intelligent Technology and Its Applications (ISITIA), International Seminar on,
pp. 107-112. IEEE. 2015.
[5] S.H. Pramono, E. Maulana, A.F. Prayogo, R. Djatmika, “Characterization of Dye-Sensitized Solar Cell (DSSC)
based on Chlorophyll Dye”, International Journal of Applied Engineering Research, vol. 10(1), pp. 193-205, 2015.
[6] M. Satyanarayana, P. Satish Kumar. “Analysis and Design of Solar Photo Voltaic Grid Connected Inverter”.
Indonesian Journal of Electrical Engineering and Informatics (IJEEI), Vol. 3, No. 4, pp. 199-208, December 2015.
[7] S.H. Pramono, E. Maulana, H. Suyono, A. Zainuri, “Analytical Design of Low Voltage DC Micro-Grid System”.
ARPN Journal of Enginerring and Applied Science. Vol. 11, No. 5, pp. 2841-2848. 2016.
[8] J.O. Petinrin, M. Shaaban, "Overcoming Challenges of Renewable Energy on Future Smart Grid", TELKOMNIKA,
Vol.10, No.2, June 2012, pp. 229-234
[9] M.N. Lakhoua, N. Walid, C. Atef, "System Analysis of a Hybrid Renewable Energy System", International
Journal of Electrical and Computer Engineering (IJECE), Vol. 4, No. 3, pp. 343-350, June 2014.
[10] C.He-Rui, P. Xu, "Study on Smart Grid System Based on System Dynamics", TELKOMNIKA Indonesian Journal
of Electrical Engineering Vol. 12, No. 12, pp. 7979-7986, December 2014.
[11] R.K. Subroto, L. Ardhenta, and E. Maulana, "A Novel of Adaptive Sliding Mode Controller with Observer for
DC/DC Boost Converters in Photovoltaic System", The 5th International Conference on Electrical, Electronics,
and Information Engineering, pp. 1-7, 2017.
[12] R.K. Subroto and K.L. Lian, "Modeling of a Multilevel Voltage Source Converter using the Fast Time-Domain
Method", IEEE Journal of Emerging and Selected Topics in Power Electronics, vol. 2, no. 4, pp. 1117-1126, Dec.
2014.
[13] E. Maulana, L. Ardhenta, R.K Subroto, P. Mudjiraharjo, H. Suyono, “Wireless Smart Grid Monitoring System
Based on Internet of Things (IoT) via Telegram and Website", Renewable Energy and Green Technology
International Conference (REEGETECH 2017), pp.1-5, 2017.
[14] S.H. Pramono, S.N. Sari, E. Maulana, “Internet-Based Monitoring and Protection on PV Smart Grid System”.
Sustainable Information and Engineering Technology (SIET 2017) International Conference. pp. 1-6, 2017.
[15] S. Jaloudi, E. Ortjohann, A. Schmelter, P. Wirasanti, D. Morton.Communication strategy for grid control and
monitoring of distributed generators in Smart Grids using IEC and IEEE standards. 2011 2nd IEEE PES
International Conference and Exhibition on Innovative Smart Grid Technologies, pp. 1-6, 2011.
[16] N. Saputro, K. Akkaya, “Investigation of Smart Meter Data Reporting Strategies for Optimized Performance in
Smart Grid AMI Networks”. IEEE Internet of Things Journal, vol. 4(4), pp. 894-904, 2017.
[17] J.E.S. de Haan, P.H. Nguyen, W.L. Kling, P.F. Ribeiro, “Social interaction interface for performance analysis of
smart grids”, IEEE First International Workshop on Smart Grid Modeling and Simulation (SGMS), pp. 79-83,
2011.
[18] R.V. Jadhav, S.S. Lokhande, V.N. Gohokar, “Energy Management System in Smart Grid using Internet of Things”,
2016 IEEE 1st International Conference on Power Electronics, Intelligent Control and Energy Systems
(ICPEICES), pp. 1-4, 2016.
Indonesian J Elec Eng & Comp Sci, Vol. 10, No. 3, June 2018: 1061 – 1069Indonesian J Elec Eng & Comp Sci ISSN: 2502-4752 1069
[19] S. Ciavarella, J.Y. Joo, S. Silvestri, “Managing Contingencies in Smart Grids via the Internet of Things”, IEEE
Transactions on Smart Grid, vol. 7(4), pp. 2134-2141, 2016.
BIOGRAPHIES OF AUTHORS
Eka Maulana received the B.Eng. (2009), M.Eng. (2011), degrees in Electrical Engineering
from Brawijaya University (Indonesia) and University of Miyazaki (Japan), respectively.
Currently he is a Lecturer and researcher in Department of Electrical Engineering, Brawijaya
University. His researches are in fields of electronics, power electronics, smart grids, renewable
energy and energy harversting devices, molecular electronics, sensors and photonic applications.
His affiliations are member of IEEE, PSeeM-RG (Power System Engineering and Energy
Management Research Group) and CRC-ASMAT (Collaborative Research Center for Advanced
System and Material Technology) Brawijaya University. Further info on his homepage:
http://maulana.lecture.ub.ac.id
Ramadhani Kurniawan Subroto received B.Eng. degree in electrical engineering from Institut
Teknologi Sepuluh Nopember in 2012 and the M.Eng. and M.Sc. degrees from Institut
Teknologi Sepuluh Nopember and the National Taiwan University of Science and Technology,
Taiwan in 2014. He is currently a Lecturer in Electrical Engineering Department with the
Brawijaya University, Malang, Indonesia. His main interest research includes harmonics
analysis, harmonics modeling of power converters, control of power electronics, nonlinear
control, sliding mode control, and observer design.
Lunde Ardhenta received the M.S. degree in Department of Electrical Engineering, National
ChiaYi University, Taiwan in 2015. He completed his Bachelor degree in Department of
Electrical Engineering, University of Brawijaya, Indonesia in 2011. He is a Lecturer in
Department of Electrical Engineering, Brawijaya University. His research interests include
renewable energy applications, digitalized control techniques for power electronics apparatus and
systems, and optimal control theory.
PV Smart Grid Monitoring System Based on Hybrid Telepot and Web Server (Eka Maulana)You can also read