ONS Methodology Working Paper Series No 7 Comparing counts of electricity meters and addresses by postcode in England and Wales - Alessandra Sozzi ...
←
→
Page content transcription
If your browser does not render page correctly, please read the page content below
ONS Methodology
Working Paper Series No 7

Comparing counts of
electricity meters and
addresses by postcode in
England and Wales

Alessandra Sozzi
May 2016

Abstract
This paper presents an initial investigation into aggregated electricity meters count data
published by the Department of Energy and Climate Change (DECC) for 2013.

The objective of the investigation is to evaluate if counts of electricity meters can give insight
about areas with complex household arrangements such as multi-occupancy properties or
flats. On the assumption that any single address will most likely have one electricity meter,
this analysis compares England and Wales (E&W) postcode data about the number of
domestic electricity meters with the number of residential addresses and examines
postcodes where these two data sources differ greatly. Understanding why there are
differences between meters and addresses counts will help ONS to enhance the quality
assessment of the AddressBase, ultimately resulting in a better assistance for activities that
rely on addresses information such as Census field operations.

First a description of the research data is given, highlighting some of the issues that have
been found while assessing its quality for the purpose of linking this data to the ONS
AddressBase. Then electricity meters count data at postcode and output area level are
combined with the information known about addresses and the information given from the
Output Area classification created using Census variables. Some case studies are then
presented to show the findings acquired during the analysis.

The research indicates that counts of electricity meters might provide some intelligence on
postcode areas where there are complex housing arrangements such as high proportions of
flats and second/holiday homes.

    1.    Introduction
An electricity meter, electric meter, or energy meter is a device that measures the amount of
electric energy consumed by a residence, business, or an electrically powered device (e.g.
meters that power street lighting or traffic lights rather than a property). Electricity data is
divided between domestic and non-domestic categories according to the meter’s profile type.

In E&W1 it is normal for a single residential address to have one domestic electricity meter.

The analysis presented here looks at postcode level counts of domestic electricity meters for
E&W and compares them with postcode level counts of residential addresses from
AddressBase.

Postcodes where these counts are significantly different may identify areas with complex
household arrangements such as multi-occupancy buildings, holiday homes, park homes
and caravans. Differences may also be attributable to new or demolished homes that may
not have been updated in either dataset.

1
    For more information see DECC Methodology and guidance note.
This information would be useful to a Census operation as areas with complex housing can
be difficult for a Census to enumerate2.

    2.    Data
         2.1.    Electricity meter data

DECC has recently published data on domestic electricity meters for all postcodes across
Great Britain (England, Scotland, and Wales). The data relates to the year 2013 and
contains, for each postcode, an estimate of the total yearly electricity consumption, number
of meters, average and median consumption estimates.

This data has been pooled from individual meter information provided by the six major UK
energy companies, Eon, Scottish Power, Scottish and Southern Energy, Npower, British Gas
and EDF Energy. These so called ‘Big 6’ companies registered in early 2014 a collective
coverage of 95% of all domestic meters. The data is available for 8 different ‘profiles’ of
meter, with domestic consumption based on meters with profiles 1 and 2 (these are the
standard domestic and economy 7 type tariffs respectively). Industrial and commercial
consumption data are based on meters with profiles 3 to 8 and thus excluded from the
analysis.

In addition it should be noted that profile 1 and 2 meters are reallocated by DECC to the
industrial and commercial sector if annual consumption is greater than 100,000 kWh. Also
re-allocated to the industrial and commercial sector are those consuming over 50,000 kWh
with address information indicating non-domestic consumption (for example, if an address
contains ‘plc’ or ‘ltd’).

As a consequence, cases such as small businesses may have been included in the
domestic figures while some other high use meters belonging to residential households may
have been excluded.

Table 1 presents an extract of the initial data. The data is provided at postcode district
(indicated by the first 2 to 4 characters before space in the full postcode string) and for
individual postcodes with 6 or more meters. The postcode district aggregates together those
postcodes with less than 6 meters. This is done by DECC to protect individual household
data and eliminate the risk of identification. For example Table 1 shows the first row, the
postcode district AB10, contains an aggregate count of 257 meters. There is no indication of
how many postcodes have been masked and grouped together. Individual postcodes that
have more than 6 meters (AB10 1AU, AB10 1BA, AB10 1BB) are listed individually.

2
    See Abbott and Compton (2014)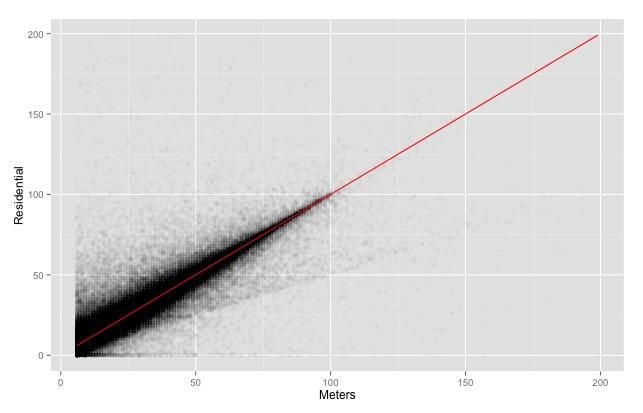
Table 1:      A snapshot of the initial data

 Postcode             Total           Number of           Mean             Median
                  consumption          Meters
                     (kWh)                                (kWh)            (kWh)

   AB10             1,303,518            257              5,072             3,269
 AB10 1AU            109,478             40               2,737             2,067
 AB10 1BA             81,214             40               2,030             1,461
 AB10 1BB             47,361              9               5,262             2,481

During the cleaning phase all postcode districts were removed as well as postcodes in
Scotland so that the data was left with valid postcodes from E&W only.

From the original 1,156,791 records in the dataset, the final number of observations for this
dataset resulted in 1,044,112 postcodes (90.3%). First five rows are presented in Table 2.

Table 2:      First five rows of electricity meter data

 Postcode             Total           Number of           Mean             Median
                  consumption          Meters
                     (kWh)                                (kWh)            (kWh)

  AL1 1AJ            150,789              52              2,900             2,583
  AL1 1AR             68,275              22              3,103             2,719
  AL1 1AS             37,551              13              2,889             2,731
  AL1 1BH            314,336              52              6,045             6,577
  AL1 1BX            100,361              17              5,904             5,500

      2.2.    Address data

Data about residential addresses against which the electricity data was compared was
sourced by ONS from AddressBase. AddressBase is a product which combines address and
location information from various different sources, including from Ordnance Survey, Royal
Mail and others.

The data used for this analysis is a snapshot of AddressBase extracted in June 2015.
Addresses in each postcode are classified into several categories according to their use
(e.g. residential, commercial, communal establishment and so on). Information about the
number of residential addresses in E&W were extracted from AddressBase and aggregated
to postcode level, providing a count of the number of these addresses per postcode.

The dataset contains a total of 1,451,641 postcodes and the first five rows of the extract are
illustrated in Table 3.
Table 3: First five rows of the extract from AddressBase
Postcode Residential
addresses
AL1 1AG 6
AL1 1AJ 52
AL1 1AR 20
AL1 1AS 13
AL1 1BH 48
2.3. 2011 Area Classification for Output Areas
Area classifications group together geographic areas according to key demographic
characteristics common to the population in that area. The ONS 2011 Area Classification for
Output Areas (2011 OAC) is built for small geographic areas known as output areas and was
created entirely from 2011 Census data.
The classification places each E&W output area, as defined following the 2011 Census, into
a group with those other output areas that are most similar in terms of census variables. This
enables similar areas to be classified according to their particular combination of
characteristics and to gain more of an appreciation of the composition of the individual
areas.
The 2011 OAC is a hierarchical classification, consisting of three tiers: Supergroups, Groups
and Subgroups.
In this analysis the eight Supergroups are used.
2.4. Postcodes
A full postcode such as AL1 1AG is known as a "postcode unit" and designates an area with
a number of addresses or a single major delivery point. Unit postcodes are the base unit of
postal geography and fall into two types:
● Large user postcodes: allocated to single addresses receiving at least 500 mail
items per day (e.g. business addresses).
● Small user postcodes: collections of (usually) adjacent addresses. A single small
user postcode may contain up to 100 addresses, but 15 is a more typical number.
It should be noted that it is possible for large buildings with many separate delivery points
(for example, a tower block) to have more than one unit postcode within the building.
The following analysis uses the postcode units as the base unit of spatial aggregation for the
data.3. Analysis
For E&W postcodes the electricity meter data was merged with the AddressBase snapshot.
The merged dataset had a total of 1,041,672 observations.
There were 409,969 more postcodes in the AddressBase snapshot than in the electricity
dataset.
Some of the key reasons for this are:
The difference in timing of the two datasets. Some postcodes that were created after
2013 were in the 2015 AddressBase snapshot but not in the 2013 electricity data.
This accounted for 5,590 postcodes.
Postcodes having less than 6 meters were suppressed and aggregated at postcode
district level in the electricity data by DECC. This accounts for 379,513 postcodes.
Different classifications of ‘residential’ between the two data sources. For example
student accommodation such as Graduate College Porter Lodge in Lancaster or
Booth Hall at Manchester Metropolitan University are classed as postcodes with high
numbers of residential addresses in the AddressBase snapshot, yet classed as
having non-domestic meters in the electricity data.
There were also 2,440 postcodes in the electricity data that could not be matched to a
postcode in the AddressBase snapshot. Around 90% of these (2,183 postcodes) are no
longer in use. Some of these postcodes ceased being operational as far back as the 1990s.
A Venn diagram in Figure 1 shows the intersection between the two datasets.
Figure 1: Venn diagram of the matching between the AddressBase snapshot data
and the electricity data3.1. Number of meters versus number of addresses
There are several reasons why the number of domestic meters from the electricity
companies data may not exactly equal the number of residential addresses ONS have
identified from AddressBase:
1. Misclassification between domestic and non-domestic meters as described above
2. An apartment building may have a meter for the building complex (used to power
building-wide appliances) in addition to each individual apartment having its own
meter.
3. Some meters power street lighting or traffic lights rather than a property.
4. Differences in timing between the two datasets as one is for 2013 and one 2015.
5. New/demolished buildings which may not have been updated in either data.
The relationship between the number of addresses and the number of meters shows a
strong positive correlation of 0.94.
Figure 2: Scatter plot of number of domestic electricity meters 2013 vs. number of
residential addresses in 2015 for E&W.
The red line indicates where the number of addresses equals the
number of meters.
Figure 2 shows that the majority of points are clustered around the red line, where the
number of meters is equal to the number of addresses. The plot area covers postcodes with
up to 200 residential addresses or meters, although there are postcodes with higher
numbers in the data. The starting point for the Meters axis (x axis) is 6, because postcodes
with less than 6 meters are omitted by DECC.The difference between the number of meters and the number of residential addresses was
first calculated.
Figure 3: Distribution of the difference between number of meters and number of
residential addresses for each postcode
Figure 3 indicates that the distribution of the difference between the number of meters and
the number of residential addresses appears to be normally distributed. This could be
expected since the majority are postcodes which are generally small.
It is seen that 87% of postcodes have a difference between 2 and -2, and 98% of postcodes
have a difference between 10 and -10. There are a small number of postcodes with very
large differences between meter counts and addresses.
3.2. Outliers
By definition an outlier is an observation point that is distant from other observations. There
is no rigid mathematical definition of what constitutes an outlier; determining whether or not
an observation is an outlier is ultimately a subjective exercise.
In this analysis, outliers are defined as those points greater than plus or minus 2.58 standard
deviations of the mean. This effectively sets an outlier to be in the 1% of postcodes with the
largest difference between meters and address counts.
The total number of outliers detected was 15,808.It is possible to distinguish two distinct types of outliers:
● Negatives: the number of residential addresses is greater than the number of meters:
9,531 postcodes.
● Positives: the number of meters is greater than the number of residential addresses:
6,277 postcodes.
Figure 4: Geographical distribution of the outliers in E&W. Negative outliers are
shown in red and Positives outliers in blue.
The geographical distribution of both types of outlier, illustrated in Figure 4, resembles the
geographical distribution of the residential population, with greater outlier density in highly
densely populated areas such as London. However, it is possible to see a clear delimitation
of the coastal areas, where we may expect to find a higher occurrence of holiday homes and
caravan parks.
Table 4 illustrates some descriptive statistics for the two groups.Table 4: Average values for negative outliers where the number of residential
addresses is significantly greater than the number of meters and
positive outliers where the number of meters is significantly greater
than the number of residential addresses.
Summary Negatives Positives
statistics Outliers Outliers
Average total consumption 105,011 218,229
Average number of meters 28 58
Average consumption per meter 3,979 3,783
Average number of residential addresses 57 31
Average deviation from 0 -29 27
3.3. Case studies
There are a high number of outliers in the areas of Hounslow, Isleworth, Twickenham,
Brentford and Feltham and this is examined further in Figure 5.
Figure 5: Geographical distribution of the outliers amongst the areas of
Hounslow, Isleworth, Twickenham, Brentford and Feltham.
Negatives and Positives outliers are shown in different colours.
The size of the bubble refers to the magnitude of the difference from the
mean.Figure 5 highlights the dominance of Negatives outliers, where the number of residential
addresses is significantly greater than the number of meters.
The Local Authorities broadly covering this area are Ealing, Hounslow and Richmond upon
Thames.
We can categorise each Output Area (OA) to be found within these three LAs into one of
four different categories:
Positive – if it contains at least one postcode positive outlier
Negative – if it contains at least one postcode negative outlier
Mixed – if it contains at least one positive and one negative outlier
Normal – if it doesn’t have any outliers
84% of the OAs in these LAs are categorised as Normal, whereas the percentages of OA
that belong to Positive, Negative and Mixed are respectively 1.7%, 13.8% and 0.7%.
Using 2011 Census data, the housing composition for the OAs and categories represented
are shown in Figure 6 and
Table 5.
This analysis reveals that output areas with outliers have much higher proportions of
households living in flats than average.
Figure 6: Housing composition for Ealing, Hounslow and Richmond upon
Thames. Output Areas by category: Positive, Negative, Mixed and
Normal.%
70
60
50
40
30
20
10
0
Positive Negative Mixed Normal
% Households who live in a detached house or bungalow
% Households who live in a semi-detached house or bungalow
% Households who live in a terrace or end-terrace house
% Households who live in a flat
Table 5: 2011 Census housing data for Ealing, Hounslow and Richmond upon
Thames.
Housing Type composition
Households Households Households Households
who live in a who live in a who live in a who live in a
detached semi-detached terrace or flat
house or house or end-terrace
bungalow bungalow house
Category (%) (%) (%) (%)
Positive 2.6 9.6 19.2 68.5
Negative 4.7 19.4 18.2 57.3
Mixed 2.6 11.7 9.9 75.8
Normal 6.3 26.6 26.9 40.0
Another area of interest is Leeds as it is characterised by a high number of positive outliers
(significantly higher number of meters than addresses). Figure 7 shows how the outliers are
geographically distributed, distinguishing between Negatives and Positives.
Figure 7: Geographical distribution of the outliers amongst the areas of
Leeds.
Negatives and Positives outliers are shown in different colours.
The size of the bubble refers to the magnitude of the difference from the
mean.Using the same analysis as before, it is found that 96% of OAs in Leeds are categorised as
Normal. There are 2.9% Positives, 0.8% Negatives and 0.4% Mixed.
The housing composition for the different categories of OA represented is shown in Figure 8.
Figure 8: Housing composition in Leeds.
Output Areas by category: Positive, Negative, Mixed and Normal.%
70
60
50
40
30
20
10
0
Positive Negative Mixed Normal
% Households who live in a detached house or bungalow
% Households who live in a semi-detached house or bungalow
% Households who live in a terrace or end-terrace house
% Households who live in a flat
Table 6: 2011 Census housing data for Leeds.
Housing Type composition
Households Households Households Households
who live in a who live in a who live in a who live in a
detached semi-detached terrace or flat
house or house or end-terrace
bungalow bungalow house
Category (%) (%) (%) (%)
Positive 6.1 15.9 27.7 50.3
Negative 6.2 8.1 36.6 47.8
Mixed 3.4 7.3 29.3 60.0
Normal 15.0 38.1 26.7 20.2
We can see that again the OAs categorised as containing outliers have high proportions of
households living in flats.
3.4. 2011 Area Classification for Output Areas
The following section investigates the characteristics of OAs with outliers using the Census
2011 area classification.
Across the whole country, each postcode was first assigned to an OA and then to one of the
following eight Supergroup categories:● Constrained City Dwellers
● Cosmopolitans
● Ethnicity Central
● Hard-Pressed Living
● Multicultural Metropolitans
● Rural Residents
● Suburbanites
● Urbanites
Figure 9 shows, for each Supergroup category:
● the percentage of all postcodes contained in the Supergroup
● the percentage of all positive outliers that lie in postcodes belonging to the
Supergroup.
● the percentage of all negative outliers that lie in postcodes of the Supergroup
Figure 9: Percentage of postcodes in each Supergroup categories for:
- Total postcode population
- Positive Outliers (more meters than residential addresses)
- Negative Outliers (more residential addresses than meters)
A key message from Figure 9 is that postcodes assigned to the Supergroup categories of
Constrained City Dwellers, Cosmopolitans and Ethnicity Central collectively represent
around only 16% of all postcodes but have a much higher proportion of all negative and
positive outliers (42% and 40% respectively). Conversely, the Supergroup categories of
Hard-Pressed Living and Suburbanites represent approximately 38% of all postcodes but
only 18% of all negative and 15% of positive outliers.The area classification is created by grouping similar areas together based on a variety of
data about each area from the Census, including data about housing types and tenure. The
centroid for each Supergroup category represents the average of all areas within the
Supergroup and can be used to understand the types of areas in the Supergroup. Here we
analyse the different housing types and ownership arrangements for each Supergroup.
3.4.1. Housing Type
The Housing Type composition is described in four variables, listed as columns in Table 7.
We analysed how much the mean for each Supergroup deviates from the national mean.
Table 7: Deviation from the E&W mean for 2011 Census Housing Type
composition.
Households Households Households Households
who live in a who live in a who live in a who live in a
detached semi-detached terrace or flat
house or house or end-terrace
bungalow bungalow house
(% deviation (% deviation (% deviation (% deviation
from from from from
Supergroup E&W mean) E&W mean) E&W mean) E&W mean)
Constrained City Dwellers -25 -9 7 35
Cosmopolitans -35 -36 -9 42
Ethnicity Central -34 -33 -9 44
Hard-Pressed Living -10 11 15 -11
Multicultural Metropolitans -13 2 16 11
Rural Residents 30 3 -8 -21
Suburbanites 23 8 -24 -31
Urbanites 5 2 8 12
From Table 7, it is seen that the three Supergroups that contain high number of outliers
(Constrained City Dwellers, Cosmopolitans and Ethnicity Central) have much higher
proportions of ‘% Households who live in a flat’ compared with the national mean and with
other Supergroups.
The Supergroups of Hard-Pressed Living, Rural Residents and Suburbanites all have much
lower proportions of flats than the national mean.
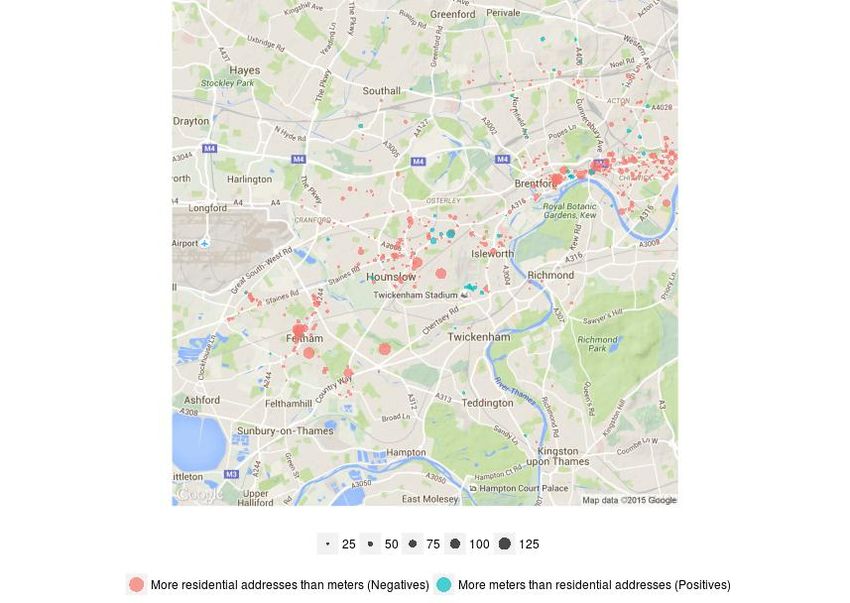
3.5. Analysis of Cornwall region
Finally as Figure 4 has shown there appear to be many outliers at the coast. As a result
Cornwall was examined further.
Figure 10 shows how the outliers are distributed in Cornwall local authority, distinguishing
between negative and positive outliers. The size of the bubble refers to the magnitude of theoutlier, so the bigger the size the bigger the difference between the number of meters and
the number of residential addresses.
Figure 10: Geographical distribution of the outliers among the Cornwall region.
Negative and positive outliers are shown in different colours.
The size of the bubble refers to the magnitude of the absolute
difference.
By sampling some of the outliers in Cornwall it was observed that many of these postcodes
are dominated by the presence of caravan parks, camping parks, holiday apartments and
holiday homes.
Table 8: Sample from Cornwall region.
Postcode Description Case N. of N. of
residential electricity
addresses metersEX23 9QY Self Catering Holiday Park Negative 98 16
PL26 8QN Static caravans and chalets Positive 234 22
PL28 8PY Holiday Park, caravan park Negative 72 165
PL30 3PL Holiday Park, caravan park Positive 18 128
Seaside self-catering
TR27 5AF Positive 280 364
caravans
4. Conclusion
The target of this examination is to assess if counts of electricity meters can give insight
about areas with complex household arrangements such as multi-occupancy properties or
flats. On the assumption that any single address will most likely have one electricity meter,
this analysis compares E&W postcode data about the number of domestic electricity meters
with the number of addresses and examines postcodes where these two data sources differ
greatly. This intelligence would be valuable for ONS to optimize activities that rely on
addresses information such as Census field operations.
Using the postcode as match key, a total of 1,041,672 records in the 2013 electricity data
were matched to postcodes showing the number of addresses from a snapshot of the 2015
AddressBase. Significantly, around 410,000 postcodes were missing from the electricity data
provided to ONS by DECC, mainly because the data did not contain postcodes with six or
less meters which could not be provided to ONS for data protection reasons.
For the majority of matched postcodes, the difference between the number of meters and
number of residential addresses is around zero as expected. A correlation of 0.94 suggests
a strong positive relationship between the number of meters and the number of addresses.
The distribution of these differences is approximately normal.
Postcodes where the difference between the two counts is found to be significantly different
are labelled as either a negative outlier (where the number of residential addresses is
greater than the number of meters or a positive outlier (where the number of meters is
greater than residential addresses). These two types of outlier contain 9,524 and 5,853
postcodes respectively.
An investigation into two areas having high numbers of either positive or negative outliers
revealed that these areas have high proportions of households living in flats. The number of
addresses may be greater than the number of meters if an apartment complex has only one
meter for a group of flats. Alternatively, the number of meters may be greater than the
number of flats where there is one meter per flat plus others for communal areas used for
lighting, for example in student halls of residence.
Another analysis involved using the 2011 Census Output Area Classification to see whether
the output areas in which the postcode outliers lie present some distinctive characteristics
with respect to the Housing Type composition. It was found that outliers are more likely to be
in the Supergroup categories Constrained City Dwellers, Cosmopolitans and EthnicityCentral, areas which are more likely to contain flats. Correspondingly, outliers are found in
far fewer proportions in areas where there is a lower prevalence of flats.
Finally, an investigation into the high level of outliers to be found in Cornwall revealed that
these outliers are often postcodes dominated by the presence of caravan parks, camping
parks, holiday apartments and holiday homes.
There are a number of considerations to be had regarding the comparability between the two
data:
Timestamp The electricity meter data is dated to the annual year
2013 and might include some sort of averaging of
numbers. The data is also provided to DECC at a lag.
This means that these counts will not be current, and
changes due to new builds or demolitions not
accounted for.
Classification of domestic and Electricity meters are categorised as being domestic
non-domestic meters or non-domestic according to the amount of electricity
they use. It is possible that meters may be incorrectly
categorised.
However, it is thought that AddressBase may not capture caravan parks well, sometimes
showing only a few addresses for a large caravan site. In such circumstances, the number of
meters is likely to be greater than the number of addresses. Alternatively, such properties
may have non-domestic meters, leading to a greater number of addresses than meters.
The overall indication is that counts of electricity meters might provide some intelligence on
the areas where there are more complex housing arrangements, most notably with flats and
second/holiday homes.
It needs to be tested whether standard meter count data might improve census or survey
fieldwork. This can be achieved by a closer look at postcodes with anomalies, for example
by looking at all addresses in the postcode on AddressBase. Another piece of work would be
to look at census test outcomes and interview observations for some affected postcodes,
comparing counts of electricity meters, at postcode level, with the addresses to be used
within tests for the 2021 Census. These tests will run in certain areas in 2016 and 2017.
Postcodes with large differences in counts might then be investigated using feedback from
the fieldworkers to help identify any value added from using meter counts prior to sending
out forms or from follow-up. An additional option would be supplement the above by directly
including some of these postcodes in the 2016 address check in Telford & Wrekin.
Finally, it is also acknowledged that the government has a policy to roll out smart meters to
over 26 million households across Wales, Scotland and England by the end of 2020. Counts
of standard meters will fall whilst active electricity smart meters will rise over this time;
potentially leading to more accurate and timely counts overall.You can also read