Implementation of ATLAS Distributed Computing monitoring dashboards using InfluxDB and Grafana - CERN ...
←
→
Page content transcription
If your browser does not render page correctly, please read the page content below
Implementation of ATLAS Distributed Computing monitor-
                                         ing dashboards using InfluxDB and Grafana

                                         Thomas Beermann1,∗ , Aleksandr Alekseev2 , Dario Baberis3 , Sabine Crépé-Renaudin4 , Jo-
                                         hannes Elmsheuser5 , Ivan Glushkov6 , Michal Svatos7 , Armen Vartapetian6 , Petr Vokac8 , and
                                         Helmut Wolters9
                                         1
                                           Bergische Universität Wuppertal
                                         2
                                           Universidad Andrés Bello
                                         3
                                           Università e INFN Genova
                                         4
                                           LPSC-Grenoble, CNRS/UGA
                                         5
                                           Brookhaven National Laboratory
                                         6
                                           University of Texas at Arlington
                                         7
                                           Acad. of Sciences of the Czech Rep.
                                         8
                                           Czech Technical University
                                         9
                                           LIP Coimbra

                                                      Abstract. For the last 10 years, the ATLAS Distributed Computing project
                                                      has based its monitoring infrastructure on a set of custom designed dashboards
                                                      provided by CERN. This system functioned very well for LHC Runs 1
                                                      and 2, but its maintenance has progressively become more difficult and the
                                                      conditions for Run 3, starting in 2021, will be even more demanding; hence a
                                                      more standard code base and more automatic operations are needed. A new
ATL-SOFT-PROC-2020-019

                                                      infrastructure has been provided by CERN, based on InfluxDB as the data
                                                      store and Grafana as the display environment. ATLAS has adapted and further
                                                      developed its monitoring tools to use this infrastructure for data and workflow
                                                      management monitoring and accounting dashboards, expanding the range of
                                                      previous possibilities with the aim to achieve a single, simpler, environment for
                         05 March 2020

                                                      all monitoring applications. This document describes these tools and the data
                                                      flows for monitoring and accounting.

                                                      c 2020 CERN for the benefit of the ATLAS Collaboration. CC-BY-4.0 license.

                                         1 Introduction
                                         The ATLAS [1] Distributed Computing (ADC) uses two core-systems to run jobs on the grid
                                         and manage the data - the workflow management system PanDA [2] and the distributed data
                                         management system Rucio [3]. For efficient use of these systems and the available resources
                                         it is important to have extensive and coherent monitoring available. During LHC Run 1 and
                                         Run2 the monitoring and accounting systems were based on custom frameworks developed
                                         by CERN IT and ADC more than 10 years ago. These systems served well during that time
                                         but they started to show their age in several areas; in particular, the data retrieval was slow
                                             ∗ e-mail: thomas.beermann@cern.ch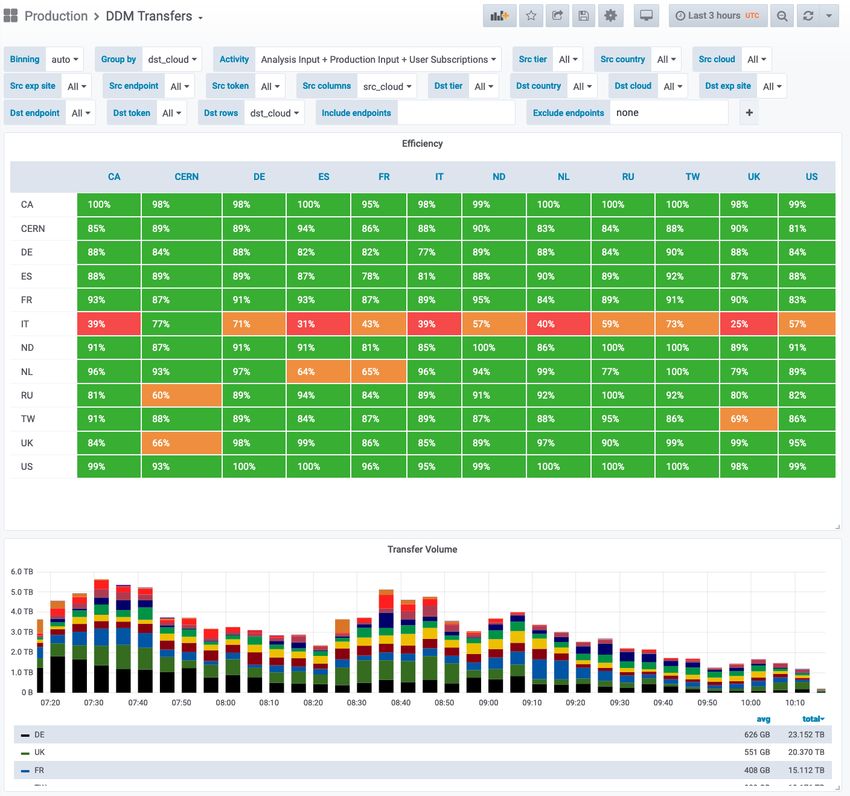
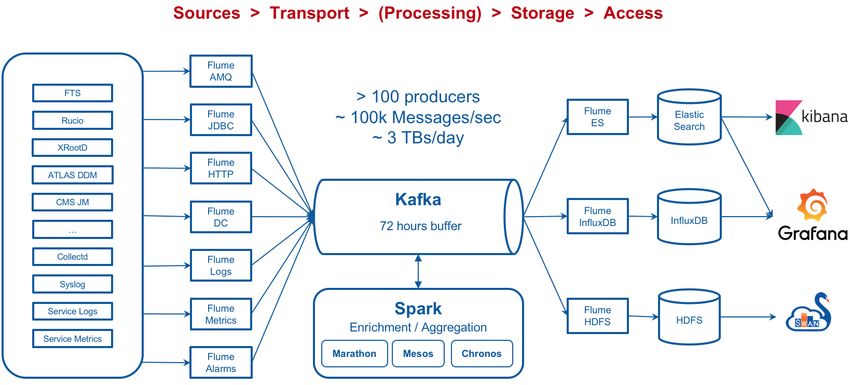
because of the large amount of data stored in Oracle databases. The original developers had
long left and with them a lot of the in-depth knowledge necessary to further optimise the
system and the ability to quickly add new features to the monitoring. Therefore, an overhaul
of the monitoring systems was necessary. In 2016 the CERN MonIT group started to build
a new Unified Monitoring Infrastructure (UMA) based on open source technology [4]. The
data collection, processing and display presented in this document are based on UMA.

2 The CERN MonIT Infrastructure

The CERN MonIT UMA as shown in Figure 1 is based around Apache Kafka [7] and Spark
[8] for data processing. Kafka is an open-source stream-processing platform and Spark is a
distributed cluster-computing framework. Together they can be used to process data in real-
time as it is streamed through the system. Various collectors are available, including some for
standard protocols like Stomp, HTTP, Java Database Connectivity (JDBC), as well as custom
collectors if necessary. The collectors ingest the data into the processing pipeline. The data
are buffered in Kafka up to 72 hours and then Spark is used to enrich and aggregate the data.
The processed data in turn are also written back to Kafka. From there Flume collects and
writes the data to the different available backends including InfluxDB [9], Elasticsearch [10]
and the Hadoop File System (HDFS) [11]. Grafana [12] is the main tool used to create visu-
alisation based on these data but there is also the possibility to use Kibana [13] or the CERN
Service for Web based Analysis (SWAN) [14]. Three types of dashboards are described in
the next sections of this document, all with different data sources, processing and backends.

Figure 1. The CERN MonIT Unified Monitoring Architecture [6]

2.1 Data Sources for the ADC Dashboards

The first dashboard is the Distributed Data Management (DDM) transfer dashboard. For this
the data are coming directly from Rucio or the Pilot [5]. For each successful or failed FTS file
transfer Rucio sends out an event. The event includes information like filename, size, source /
destination site, etc. It also includes an error description in case of failure. The events are sent
to a central ActiveMQ (AMQ) [15] message broker. Furthermore, the PanDA Pilot creates
traces for every file that has been used as input or output for a grid job. For simplicity for
the sender the traces are first sent to a central HTTP server which then in turn forwards them
to AMQ. On the monitoring side a Flume [16] AMQ collector is used to ingest the data into
Kakfa.
     The second dashboard is the DDM accounting dashboard. For this dashboard the data
are again coming from Rucio. Here, a daily accounting job runs on Oracle to create a de-
tailed report of the types of data currently registered in the Rucio catalogue, split by endpoint
and metadata including project, datatype, physics stream, etc. Furthermore, the volume as
reported by the storage is collected. All together this is then sent again to AMQ.
     The last dashboard is the job accounting dashboard. In this case the data are collected
directly from the different job tables in the PanDA database with the JDBC collector. This
collector runs every 10 minutes and fetches a snapshot of the currently submitted, pend-
ing, running, finalising and completed jobs and sends then directly to Kafka. Depending on
whether the database table represents a transient job state like submitted, pending, running
and finalising or final states, either a full snapshot of the database table is collected or just the
most recently finished jobs.
     In addition, data are also collected from the ATLAS Grid Information System (AGIS)
that is used to enrich the data for all three dashboards. The data are collected regularly from
the AGIS Rest API in JSON and fed into Kafka.

2.2 Processing

All the processing is done using Spark Streaming on the data in Kafka. For the DDM transfer
dashboard the events and traces are first unified to a common data format. After that each
transfer is enriched with topology information from AGIS to get the source and destination
site, cloud, country and tier. In the next step the data are aggregated in one minute bins by
source and destination, activity, FTS host and protocol. Then, the number of successful and
failed files and bytes is computed.
    For the DDM accounting all aggregations are already done before the data are sent to
UMA. The Spark job only enriches the accounting data with topology information similar to
the DDM transfer data.
    For job accounting the Spark job computes a lot of additional information for each job.
This includes classifications into ADC activities, calculation of wall times, mapping of error
codes to actual error messages and again enrichment with topology and PanDA queue infor-
mation from AGIS. In the next step the jobs are then aggregated in ten minute bins based on
different fields such as the computing site, topology, job type, status, activity, error category,
etc. This is again written back to Kafka. Due to delays in the reporting for completed jobs,
the corresponding bins are continually updated for up to two hours.

2.3 Backends

For the ATLAS dashboard all three of the previously introduced data backends are used de-
pending on the type of data and the use case. The DDM transfer dashboard uses both In-
fluxDB and Elasticsearch. InfluxDB is used for the aggregated time-series data. The original
one minute granularity is kept for 30 days. Then, the InfluxDB downsampling is used to
create larger bins from one hour up to 30 days which in turn is kept for up to five years. In
addition to the aggregated data, the raw Rucio events and traces enriched with topology are
written to Elasticsearch. These are kept for 30 days.
    The DDM accounting data are not spread out over the course of a day but rather for
each reported day a set of up to three million entry is sent to UMA. This was shown to be
problematic for InfluxDB and therefore Elasticsearch has been selected as the backend. The
data are kept there without any further aggregation over time for up to five years.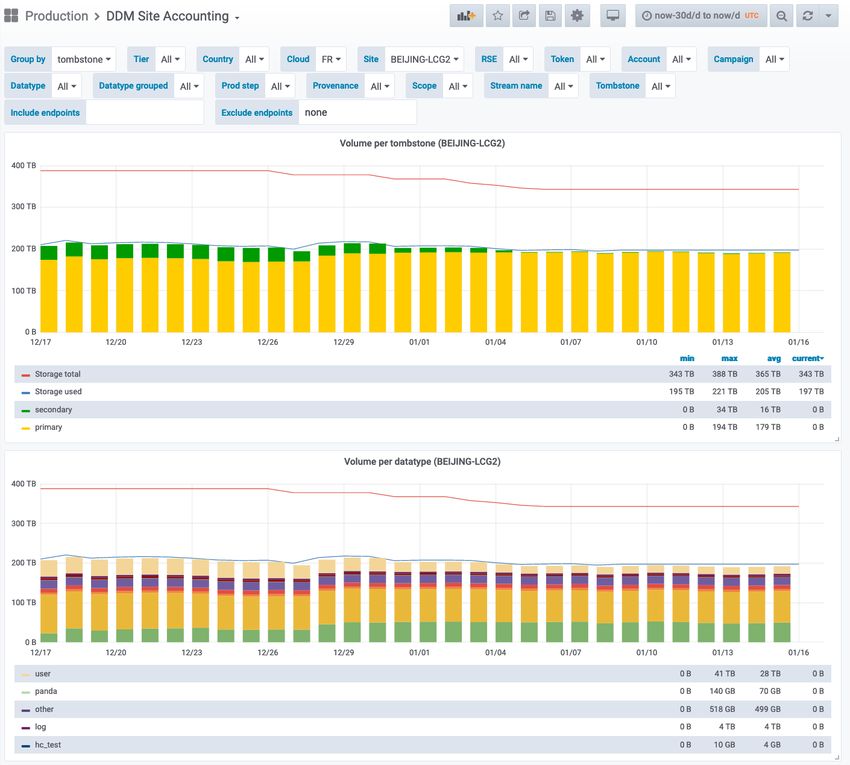
The job accounting dashboard again uses InfluxDB with different databases for the dif-
ferent job states. Similar to the DDM dashboard the data are automatically aggregated.
Complementary to InfluxDB and Elasticsearch, all data are also written to HDFS for long
term storage. The data are stored in JSON format and kept forever. It can be used for batch
and data-intensive analytics workflow.
3 Dashboards
This section describes the dashboards that are built using the processed data described ear-
lier. All dashboards are available in a central Grafana instance provided by CERN MonIT.
Grafana provides the functionality to organise dashboards in separate folders, where a folder
can have different permissions for viewing and editing. For ADC there are three different
folders: production, development and playground. The production folder contains the official
and stable dashboards that should be used by the experts and shifters in daily operations or
by management for reporting needs. These dashboards can be viewed by everyone but can
only be changed by the admins of the ATLAS Grafana organisation. The development folder
contains a copy of the production dashboards as well as completely new dashboards that can
be used to test new features. If everything has been tested it can be added to the production
dashboards. Development dashboards can be changed by anyone with an editor role. Fi-
nally, the playground folder is open to anyone in the ATLAS organisation. All the same data
sources as for production and development are available and users can either modify existing
dashboards to fit their specific needs or create completely new ones.
3.1 Transfer Dashboard
The DDM transfer dashboard is mainly used by shifters and experts to monitor the world-
wide transfer on the grid and spot problems. Figure 2 shows an overview of this dashboard.
The main entry point to the dashboard is the matrix showing the transfer efficiency between
all source and destination clouds. A lot of grouping and selection variables are available to
drill down and find problems. Besides the entry matrix a lot of further visualisations are avail-
able including histograms with the transfer volume, number of successful and failed files and
transfer throughput. All of them are also available for staging requests and deletion. Besides
those visualisations, tables with detailed information for each transfer are also available, in-
cluding direct links to the specific Rucio and FTS monitoring sites with information about the
transferred file. Furthermore, the error messages for failed transfers are cleaned from specific
information like hostname or IP so that they can be grouped to find common problems.
3.2 Site Accounting
The DDM site accounting dashboards are mainly interesting for operations and site admins.
They basically provide histograms with the space usage evolution over time as shown in
Figure 3. It is possible to overlay the information from the Rucio catalogue with the total
and used space as reported by the storage system in order to measure storage occupancy and
also to find possible consistency problems. Furthermore, it is possible to group the data by
metadata like the datatype, physics streams, account, etc, to identify the type of data stored on
a site. Additionally, these plots can be shown for single storage elements, all storage elements
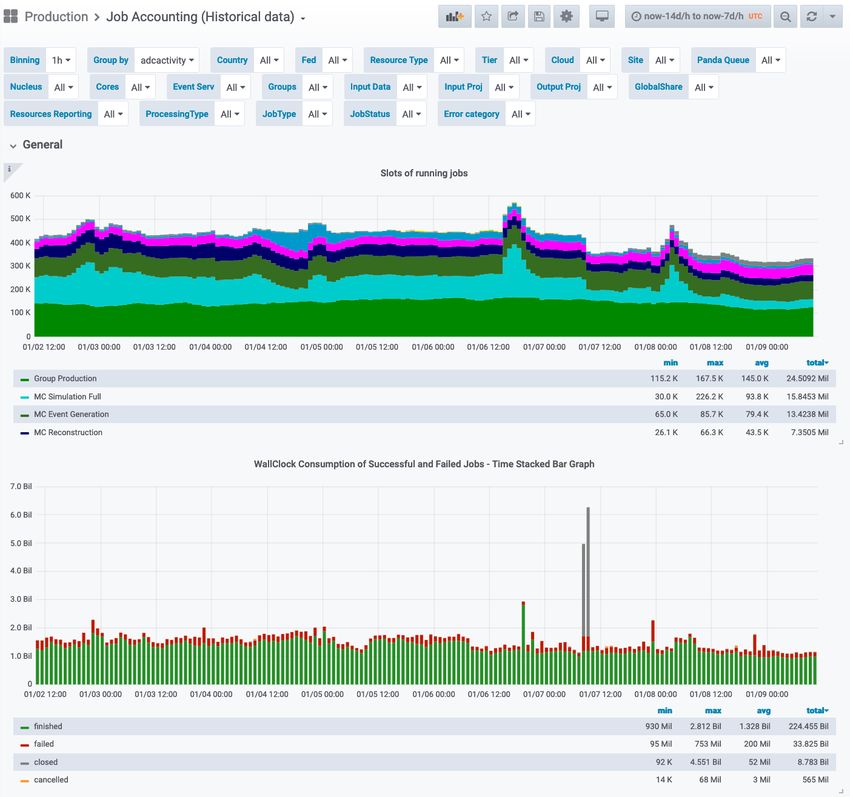
at a site, a cloud / country, tier or just an arbitrary set of sites.Figure 2. Overview of the DDM Transfer Dashboard 3.3 Job Accounting The job accounting dashboard is used by shifters, experts and management. It is useful to spot problems with the workflow management system as well as computing sites and to get the necessary plots for management reporting. The entry point as shown in Figure 4 is an overview of the currently running jobs and the wall clock consumption of successful and failed jobs, which allows problems to be quickly identified. Further plots for the submitted, pending, finalising and completed jobs with grouping and selections are available similarly to the other two dashboards. Furthermore, there is information available regarding the feder- ation pledges, HEP-SPEC06 1 numbers, CPU consumption and efficiency, the processed data and the resource utilization. 1 HEP-wide benchmark for measuring CPU performance: https://w3.hepix.org/benchmarking.html
Figure 3. Overview of the DDM Site Accounting Dashboard

Figure 4. Overview of the Job Accounting Dashboard
4 Summary
The work presented in this document was made possible by a joint effort of the CERN IT
monitoring team and ADC. Removing the custom-built tools and relying on widely-used
open source technologies brings several advantages: better scalability, better maintainability
and an easier development of new features. But the new dashboards do not come without
their own issues, such as the limited set of visualizations available in Grafana. Overall the
new dashboards are a good improvement from the old ones and they will serve well in the
upcoming LHC Run 3.

References
[1] ATLAS Collaboration, JINST 3, S08003 (2008)
[2] Pavlo Svirin et al., EPJ Web Conf. 214, 2019 (03050)
[3] Martin Barisits et al., Comput. Softw. Big Sci. 3, 2019 (11)
[4] Alberto Aimar et al., EPJ Web Conf. 214, 2019 (08031)
[5] Paul Nilsson et al., EPJ Web Conf. 214, 2019 (03054)
[6] CERN IT Monitoring Documentation: https://monitdocs.web.cern.ch/monitdocs/
   overview/architecture.html
[7] Apache Kafka: https://kafka.apache.org/
[8] Apache Spark: https://spark.apache.org/
[9] Influxdb: https://www.influxdata.com/
[10] Elasticsearch: https://www.elastic.co/elasticsearch
[11] Apache Hadoop: http://hadoop.apache.org/
[12] Grafana: https://grafana.com/
[13] Kibana: https://www.elastic.co/kibana
[14] CERN SWAN service: https://swan.web.cern.ch/
[15] Apache ActiveMQ: https://activemq.apache.org/
[16] Apache Flume: https://flume.apache.org/
You can also read