Fibre Optic Blade Load Monitoring (FOBM) - FBGs

Page created by Betty Brooks
 
CONTINUE READING
Fibre Optic Blade Load Monitoring (FOBM) - FBGs
Fibre Optic Blade Load Monitoring (FOBM)

           Why Blade Load Monitoring?
           Condition based maintenance is becoming more and more a means to better control the O&M costs of wind
           turbines, especially offshore where site visits are very expensive. Condition based maintenance as a
           replacement of corrective maintenance leads to less downtime, less consequence damage, better planning
           of activities, better use of resources and equipment, and thus lower costs. Many systems are already on the
           market to monitor the health of components. SCADA data, drive train monitoring, visual inspections, oil
           samples, etc. are all common practice in wind energy and have proven their added value. However, all these
           techniques have in common that they start providing useful information not before the degradation of the
           components really starts to occur. Since the degradation of the components is strongly related to the loads
           acting on the components, ECN has been seeking for a solution to monitor the mechanical loads. Since
           most of the loads are introduced via the rotor blades, ECN’s development have been focusing on a low cost
           method to monitor the blade root bending moments and process the data in such a way that it is useful for
           turbine operators to decide e.g. if and which maintenance action is required to avoid failures from
           happening, to postpone or prioritise visits, or to decide on extension of the turbine life.

           How does the FOBM system look like?
           The system is based on optical fibres with
           Bragg gratings to measure the strain in the                                                     W-Lan

           blade roots. As opposed to the commonly
           used copper strain gauges for measuring
           the blade root bending measurements, the
                                                                                                                                           strain
           optical fibres in theory should have less                                  Read out
                                                                                                                                             &
                                                                                                                                        Temperature
                                                                                        unit                                               optical
           drift over time, longer lifetimes, and provide                                                                                 sensors

           reproducible data. In the last decade, many
           attempts have been made to demonstrate
           the advantages of optical fibres for strain
           measurements in rotor blades but most of
           them failed. The technology was not mature                                                                           W-Lan

           enough, the influence of temperature was                                                                Turbine
                                                                                                                    PLC
           under estimated, installation of sensors and                                                             data

                                                                                                 Turbine                          Data
           measurement equipment led to too long                                                 control
                                                                                                 system
                                                                                                                             synchronisation
                                                                                                                                  and
                                                                                                                                                       Human
                                                                                                                                                      Interface
                                                                                                                               processing
           turbine standstill, and the final result looked
           far from professional. Finally, once the
           measured data was obtained, it was
           unclear what to do with it; it could only be
           added to the large amount of data that was
           already available to the operators.
           ECN has now developed the FOBM system that makes use of the benefits of the optical fibre technology
           but overcomes its negative aspects. The system consists of:
           1. a newly and patented sensor assembly that is easy to install and replace, that requires no calibration,
               and provides reliable, accurate and reproducible strain data over a very long period;
           2. a commercially available interrogator to read out the fibre optic sensors;
           3. a measurement computer that derives loads data from strain data and combines the blade loads data
               with turbine PLC data;
           4. wireless-LAN to enable communication between the rotor and the turbine base;
           5. software for data processing that filters and cleans up the time series, categorises the data per design
b-10-050

               load case, and provides key figures, statistics, and graphs to the operator for O&M optimisation.

                                                                                                                                                                  www.ecn.nl
The entire system can be installed by regular maintenance technicians in less than one day and requires no
further skills on fibre optics.

                                                                  Load monitoring system set up

                           Rotor                                                                                          User location

         Blade strain                     Data
                                                                                                                                User
        measurement                   transmission

                                                                                      Turbine Base
                                      Turbine PLC                     Calibration and                    Validation and    Reporting and
                                      measurement                        merging                          processing        data acces

To measure the blade bending moments in flapwise and edgewise direction, four sensors need to be
installed in each blade root. All four sensors are connected to one string and one string per blade is
connected to the interrogator. The measured data can be obtained remotely.

Innovative algorithms for data cleaning and filtering
In general, operators want to understand if the turbine operates within its design envelope or not. If not,
adequate measures should be taken. Next, operators want to understand if certain turbines are more heavily
loaded than others. If so, O&M activities can be prioritised, as well as the analyses of condition monitoring
data and inspection results; if not, maintenance could be postponed for some time.

                                                                                Monthly report

   Begin of life                Accumulated data             Added      New                                                            End of life

    1          2     ….. Previous months …..         x         x+1       x+2       x+3       x+4         x+5         ……   238    239        240

                     Capture statistics                                 Capture statistics
            Load spectra with external references        Equivalent loads with finger print references
                                                              Load spectra with finger print spectra
                                                                       Frequency spectra

Time scheduling for monthly reporting and data approval

ECN has implemented the data analysis as follows. From the beginning on, the software starts building up a
capture matrix with statistically sufficient data that can be used as a reference data set further on. All time
series relevant for the capture matrix are being stored (a.o. for traceability purposes). The time series are
also being used to derive finger prints, envelopes, and criteria for rejection. Once the measurement
campaign is running, the software determines every 10 minutes which load case has occurred (normal
operation, start-up, shutdown, emergency shutdown, etc.) and filters out erroneous data (extensive and
automated quality checks!). Next the software determines statistical data (a.o. min, max, mean, standard
deviation and equivalent loads), updates the load spectra plots, and analyses the frequencies. Time series
themselves are only stored if they are used for finger print information or when the processing is not finished
successfully.

The software provides reports every month and with information about the captured data, the deviations
with respect to the long term statistics, and a comparison with the finger print data. Furthermore, the
monthly reports contain information about extreme loading conditions and possible errors of the
measurement system. On the longer term, the operator can ask for reports with information about the
cumulative loading of the blades and rotor (equivalent loads, fatigue spectra) to monitor the consumed
lifetime. The information can be used for comparison with design data or for comparison with data of other
turbines.

                                                                                                                                                     www.ecn.nl
Statistics:
After every month an overview is generated about the                                                  Turbine ID:                                                                                                                                           Month                                                                                                                                   Lifetime
performance of the measurement system. This report                                                    Start:                                                                                                                   Files                                 Time [hour]                                                                                       Files                                      Time [hour]
                                                                                                      Elapsed time                                                                                                                                                                                         744                                                                                                                         39850
provides details about the measurements as                                                            1 Start                                                                                                                           20                                                                   3                                                      1071                                                                 134
processed during the last month and about the                                                         2 Power production                                                                                                   4400                                                                            700                                         230672                                                                          36660
measurements during the life time.                                                                    3 Emergency shut down                                                                                                                       2                                                                    2                                                      107                                                                             98
                                                                                                      4 Normal shut down                                                                                                                18                                                                            2                                                       964                                                                             80
The data processing performs checks on the data
                                                                                                      5 Idling at high wind                                                                                                             10                                                                            0                                                       536                                                                             11
quality, which implies that data might be rejected due                                                6 Parked at high wind                                                                                                                       5                                                                   1                                                       268                                                                             27
to measurement faults or unidentified operational                                                     7 Idling at low wind                                                                                                              50                                                                  10                                                      2678                                                                            536
modes. These time series are put in quarantiaine.                                                     8 Parked at low wind                                                                                                                        1                                                                   2                                                                54                                                           107
                                                                                                      9 Waiting for wind                                                                                                                50                                                                            1                                             2678                                                                                27
These files are stored for further analysis as required.                                                                                                                                                                   4556                                                                            719                                         239028                                                                          37679
The results with respect to the encountered loads can                                                 Quarantaine                                                                                                                       80                                                                  25                                                      4285                                                                        2171
be adjusted with respect to the loss of data.                                                         Time covering                                                                                                                                              96.6%                                                                                                                                94.6%

Equivalent loads:
The equivalent loads are calculated for all single mode files. For the stationary operational modes (e.g.
power production), the equivalent loads are plotted as a function of the wind speed.
                                            EQL10 Operation                                                                                                                                                           EQL Transitions
                                                                                                                                                                                                            EQL10 start                                                                      EQL10 stop                                                                           EQL10 Emerg
                   9000.0                                                                                               16000
                   8000.0                                                                                               14000
                   7000.0
                                                                                                                        12000
Equivalent load

                                                                                                     Equivakent load

                   6000.0
                                                                                                                        10000
                   5000.0
                                                                                                                         8000
                   4000.0
                                                                                                                         6000
                   3000.0
                   2000.0                                                                                                4000
                   1000.0                                                                                                2000
                      0.0                                                                                                   0
                                                                                                                                2009-11-01 -0853
                                                                                                                                                   2009-11-01 -1798
                                                                                                                                                                      2009-11-02 -0076
                                                                                                                                                                                         2009-11-02 -1042
                                                                                                                                                                                                            2009-11-02 -1547
                                                                                                                                                                                                                               2009-11-03 -1847
                                                                                                                                                                                                                                                  2009-11-04 -1276
                                                                                                                                                                                                                                                                     2009-11-04 -1827
                                                                                                                                                                                                                                                                                        2009-11-06 -0256
                                                                                                                                                                                                                                                                                                           2009-11-06 -0334
                                                                                                                                                                                                                                                                                                                              2009-11-06 -1513
                                                                                                                                                                                                                                                                                                                                                 2009-11-07 -1952
                                                                                                                                                                                                                                                                                                                                                                    2009-11-08 -1930
                                                                                                                                                                                                                                                                                                                                                                                       2009-11-10 -2071
                                                                                                                                                                                                                                                                                                                                                                                                          2009-11-12 -0079
                                                                                                                                                                                                                                                                                                                                                                                                                             2009-11-12 -1374
                                                                                                                                                                                                                                                                                                                                                                                                                                                2009-11-12 -2309
                                                                                                                                                                                                                                                                                                                                                                                                                                                                    2009-11-13 -1131
                                                                                                                                                                                                                                                                                                                                                                                                                                                                                       2009-11-13 -1979
                            0.0       5.0           10.0            15.0             20.0

                                                 Wind speed

                                                                                                                                                                                                                                                      Single mode file
Equivalent loads during turbine operation                                                                 Equivalent loads during starts and stops

For the transient, the values are plotted for all individual single mode files. The values should be within the
limits as determined based on the capture matrix. Based on these plots, extreme values can easily be
identified.

Load spectra:
In order to give the user information about the encountered loads efficiently, the load spectra are plotted for
the reporting month as well as for the life time. For the monthly spectra, a reference is used based upon the
capture matrix. For the life time an external reference should be used.

                                    External reference                                                                                              Accumulated spectrum and reference
                   6000                                                                              6000
                                                                Scaled reference                                                                                                                                                                                                                                                                                                   Measured loads
                   5000                                                                              5000
                                                                Reference life me                                                                                                                                                                                                                                                                                                 Scaled reference
                   4000                                                                              4000
                                                                                        Load range
      Load range

                   3000                                                                              3000

                   2000                                                                              2000

                   1000                                                                              1000

                       0                                                                                               0
                       1.E+00     1.E+02       1.E+04      1.E+06          1.E+08                                      1.E+00   1.E+01                                                   1.E+02                                              1.E+03                                             1.E+04                                             1.E+05                                                 1.E+06                                                   1.E+07
                                                  Cycles                                                                                                                                                                                                              Cycles

Example of measured load spectrum and reference values over measuring period

In the example a design spectrum is used, which is scaled with respect to the measuring period.
Comparison with the measured spectrum gives an impression about the encountered loads compared with
the design spectrum. When the user is interested in the consumed life time, a design spectrum is the most
obvious choice. For prioritising maintenance, other references can be more useful. E.g. a measured load
spectrum of a turbine of the same farm could be used so that the encountered loads on the turbines can be
compared. This information can be used for maintenance planning.

                                                                                                                                                                                                                                                                                                                                                                                                                                                                                                          www.ecn.nl
APSD
Frequency plots (Average Power Spectral Density):                           10000000000
Under certain conditions, spectra of the blade loads                                          1000000000
                                                                                                                                    APSD Edge
                                                                                                                                    APSD flap
are made. Changes in the structural properties of the

                                                             Average Power Spectral Density
                                                                                               100000000
blade affects the spectrum. Shifts in frequency or                                              10000000
changes of the amplitudes can be detected.
                                                                                                 1000000
In the first period of operation, finger prints are made
                                                                                                  100000
and stored in a capture matrix. For these finger prints,
                                                                                                   10000
time series are selected within wind speeds bins of 1
                                                                                                    1000
m/s and with small rotor speed variations.
                                                                                                     100
In the figure, the frequency plots for two directions are
                                                                                                      10
given. As a function of time, these plots can also be                                                      0   0.5   1    1.5   2   2.5         3
                                                                                                                                      Frequency
presented by a rain fall plot.

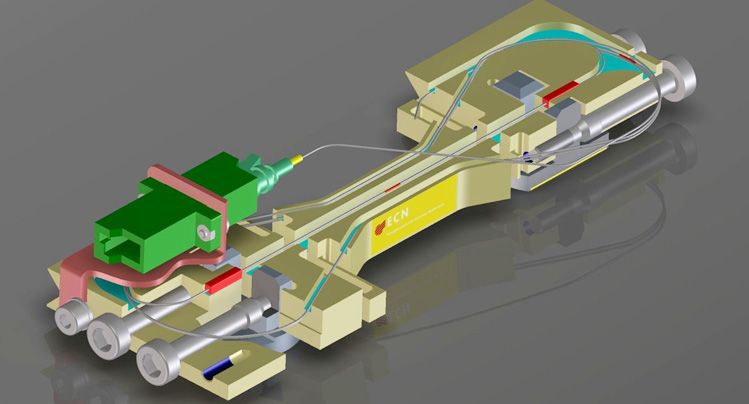
Optical Sensor Assembly
The FOBM system requires four sensors per blade to determine the blade load bending moments in
edgewise and flapwise direction. ECN has developed a special sensor assembly for strain measurement in
wind turbine blades as a “plug-and-play device”. The sensor consists of a fibre with a Bragg grating
mounted between two studs via a carrier. The studs are mounted on the inner side of the blade root at a
distance of 10 cm. The carrier ensures that the fibre follows the displacements of the studs and with this
approach the strain in the blade root is measured over a sufficient length to avoid local effects of the blade
material. The carrier protects the fibre for sharp bending and also accommodates a second Bragg grating
for temperature compensation. Each strain sensor can be compensated by a local temperature sensor
which avoids the effects of temperature differences over the blade.
To install a sensor, the technicians need to glue the studs on the blade with the help of a dedicated
mounting tool. After a short curing time, they can mount the carrier on the studs, tighten the screws, and
plug-in the patch cables to the two connectors. The carrier with the fibre and connectors is assembled in
the factory under well defined conditions and is already calibrated.
During operation, the sensor provides strain data under both tension and compression with high accuracy
(5 με) over a long period of time. Re-calibration is not necessary, because the sensor itself it very stable. If,
for what so ever reason, the sensor should fail it can be replaced by taking off the failed sensor assembly
from the studs and put on a new one. Since all assemblies are calibrated in the factory, on-site calibration is
not necessary.
This innovative and patented sensor assembly has proven to work reliable, to provide strain data with high
accuracy, and to offer easy installation and replacement.

The fibre itself has a very high ultimate strain and can easily survive the life time of the turbine. The most
critical element is the connection between the blades and the studs. This connection is chosen for
application in existing turbines. The design of the sensor is suitable for application of other fastening
methods which match in the manufacturing process of the blades.

                                                                                                                                                    www.ecn.nl
System Architecture
Apart from the sensor and the software for data analysis, the system consists of a commercially available
interrogator to read out the fibre optic sensors, a measurement computer that derives loads data from strain
data and combines the blade loads data with turbine PLC data and wireless-LAN to enable communication
between the rotor and the turbine base.

Interrogator:
The interrogator, which meets the requirements for wind turbine applications are available at the market,
although robustness, price level and performance still requires additional development. Although several
types of gratings can be used in our sensor, we prefer to use Draw Tower Grating with Ormocer coating in
combination with an WDM interrogator with three channels. This approach ensures a robust and stable
measurement system, while the disadvantages of
wavelength gratings is minor due a the well controlled
production process of complete measurement strings. In         Turbine
                                                                                              Sensors
this case four different sensor assemblies are sufficient                                        And
                                                                                            Interrogator
to cover the whole measurement range for one blade,                                       (Strain & Temp.)
while the configuration for each blade can be kept
identical.

Measurement PC:
                                                                                               W-LAN
The measurement PC is a standard device with windows
operating system. Data is imported from the turbine PLC
as well as from the blade load measurement system. The
measurement software combines these data, and
processes the data which results in single mode files.                                     Tower base PC
                                                                                          Data merging and
Based on these files, a data base is filled with statistical      Turbine standard        quality checks
                                                                   measurements           Mode detection and
data, load spectra frequency plots and a capture matrix                                   data processing
                                                                                          Data storage
with finger print information. The amount of data to be
stored is limited, because the original time series are
thrown away after successful processing. Only time
series which are used as finger print information (capture
matrix) are stored in the system.                                                          User interface

User interface and remote access:
The user can get access to the system in order to retrieve the information required. This can be realised via
standard communication provisions. During the development phase, the reporting module is running on the
remote computer. For commercial implementation other configurations will be more consistent with the
application.

Contact

ECN Wind energy
P.O. Box 1
1755 ZG PETTEN
The Netherlands

L.W.M.M. Rademakers
   +31 224 56 4046
   rademakers@ecn.nl

T.W. Verbruggen
    +31 224 56 4046
    verbruggen@ecn.nl

                                                                                                                www.ecn.nl
You can also read