Next-Generation KPIs for Next-Generation Voice Services - Voipfuture
←
→
Page content transcription
If your browser does not render page correctly, please read the page content below
W H I T EPAP ER

                                                      2021

Next-Generation
    KPIs for
Next-Generation
 Voice Services
   The European Telecommunications Standards In-
   stitute ETSI – known for globally adopted stan-
   dards, such as UMTS, 4G and TETRA - has pub-
   lished TR 103 639. It describes a framework for
   timeslice measurement methodologies and me-
   trics assessing the characteristics of RTP-based
   voice communications. The well-known and wi-
   dely used SIP signaling KPIs defined in IETF RFC
   6076 can now be complemented by meaningful
   RTP media KPIs to obtain a complete picture of
   voice service quality.
© 2021 Voipfuture Wendenstr. 4 +49 40 688 90 01 0 All rights reserved, 20097 Hamburg info@voipfuture.com v1.4 Germany www.voipfuture.com
VO I P FU T U R E : NEXT GENERATION KPIs

The key performance indicators defined

in IETF RFC 6076 and in ETSI TR 103 639

(for RTP media) jointly provide a means

to fully assess a network’s VoIP service

performance. RFC 6076 KPIs summarize

SIP signaling performance, i.e. the general

ability to set up and tear down calls, the

ability of users to register, the associated

delays, durations, etc. In addition, ETSI’s

new Technical Report fills a long-standing

gap in the telecommunications industry by

enabling the definition of timeslice KPIs,

i.e. media performance metrics based on

fixed duration time intervals. Voipfuture's

Qrystal combines both approaches into

one powerful tool.

                              3
VO I P FU T U R E : NEXT GENERATION KPIs
It is safe to say that the RFC 6076 KPIs define the de-facto standard in terms of
control plane monitoring for VoIP services and Voipfuture Qrystal supports all of them.
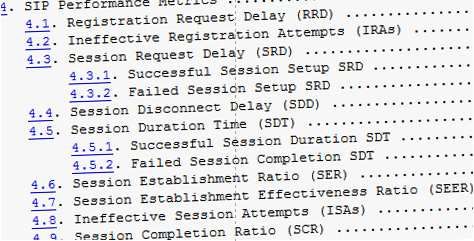
Key performance Indicators (KPI) as defined in IETF’s RFC 6076
What about voice quality?
The media plane quality somehow has to do with the MOS, but it cannot be easily
applied to VoIP service monitoring. The MOS is originally an empirical measurement
of subjective voice quality. The ITU-T Recommendation P.800 defines a procedure for
how ‘subjects’, i.e. real people, should score the quality of a conversation or an audio
stream on a scale of 1 (‘Bad’) to 5 (‘Excellent’). The average of a series of tests with
different subjects constitutes the MOS. The entire process is well-defined down to see-
mingly odd details, such as the decoration of the cabinets where the subjects should
be seated.
Passive monitoring systems try to estimate this empirical MOS for actual phone
calls. Unfortunately, the process of this estimation is not so well-defined. For example,
P.800 suggests that listening tests should be done using audio samples with a duration
between 4 and 15 seconds. How can this be transferred to the automatic analysis of
calls which last minutes or even hours? The Voipfuture whitepaper ‘MOS Calculation
& Aggregation’ describes how we address this question through our fixed time slicing
technology.
The ETSI media KPI system
ETSI TR 103 639 describes a framework for timeslice measurement methodologies
and metrics assessing the characteristics of RTP-based voice communications. Timesli-
cing creates uniform blocks of measurement data with high detail and uniform durati-
on. Timeslice KPIs let voice service providers create accurate statistics per mobile net-
work cell, enterprise customer trunk, route, destination or any other entity of interest.
4VO I P FU T U R E : NEXT GENERATION KPIs
A recap: time slicing the media plane
To asses accurate listening quality we have to calculate estimates for fixed 5 second
time slices of every RTP stream. The MOS estimates are based on the E-Model defined
in ITU-T G.107 using a number of input parameters, such as
The codec
Information about burst loss, i.e. consecutive packet loss
Information about the critical loss density, i.e. the number
of packets received in between loss events
Information about individual packet interarrival times
All quality data of a time slice is summarized in a quality data record (QDR). On
top of the MOS each QDRs contains information about the transport quality, policy
conformance and standard conformance as well as automatic root cause indicators.
This makes QDRs atomic units of quality summarizing all relevant characteristics of
each RTP stream segment.
The fixed time slicing approach has been recommended by the TM Forum to ac-
count for the varying nature of voice quality in IP networks. Simple averaging per call
leads to a significant loss of information.
For example, the average quality of a perfect 5-minute call that suffers from severe
impairments in the last 10 seconds will be close to perfect.
Nevertheless, the parties will hang up and complain about bad user experience.
Averaged metric data does not help to troubleshoot or even just confirm any prob-
lems. Obviously, statistics based on such inaccurate data are hardly useful.
RTP stream 5 seconds 5 seconds 5 seconds
… … …
QDR QDR QDR
Codecs Codecs Codecs
IP, MAC,VLAN, DSCP IP, MAC,VLAN, DSCP IP, MAC,VLAN, DSCP
Transport Indicators Transport Indicators Transport Indicators
Packet Loss Packet Loss Packet Loss
Jitter Jitter Jitter
Network Overload Network Overload Network Overload
Policy Conformance Policy Conformance Policy Conformance
MOSLQE, R-Factor MOSLQE, R-Factor MOSLQE, R-Factor
5W
Atomic units of RTP quality
offer different perspectives
on the media plane:
End-to-end vs. mid-point
Service vs. network
Volume vs. session
GSR
GSR
GCR
GMR GCR
GMR
CMR CCR
CSR
End-to-End Perspective
CMR CCR GSR
GMR GCR
CSR CMR CCR
CSR
Mid-point Perspective
GSR GSR GSR GSR
GMR GCR GMR GCR GMR GCR GMR GCR
CMR CCR CMR CCR CMR CCR CMR CCR
CSR CSR CSR CSR
Service Perspective Network Perspective Volume Perspective Session PerspectiveVO I P FU T U R E : NEXT GENERATION KPIs
ETSI's new KPI system offers different perspectives on the media quality of a VoIP
service. For example, it offers two types of media plane KPIs defined by their scope:
mid-point KPIs and end-to-end KPIs. The former provide a view on the quality as mea-
sured at a specific point in the network, e.g. at an interconnection. The latter describe
the quality of entire calls using the measurements closest to the calling parties, thereby
giving insights into the actual user experience.
Another perspective is given by the definition of ‘media quality’. Since each time
slice contains information about the MOS as well as technical parameters, such as
packet loss and jitter, one can independently assess the estimated user experience
and the network’s transport quality. This is useful as technical issues may not always
have an impact on the user experience, but frequently serve as an early warning of
upcoming issues.
Finally, time slices can be aggregated to different levels, e.g. to fixed time units
such as minutes, to the level of an RTP stream or to the level of a call. This dimension
provides insights into the distribution of quality across a group of streams and allows
to compare the overall traffic quality versus degradation of individual calls.
Together the dimensions of scope, quality definition and aggregation level offer
different views on the service quality:
End-to-end Perspective: Focused view on the quality on a call-level, i.e. as percei-
ved by the endpoints of communication
Mid-point Perspective: Focused view on the quality at specific points in the net-
work, e.g. at network boundaries
Service Perspective: Focused view on the media quality of the service in terms of
the customer experience
Network Perspective: Focus on the technical quality of service or network transport
performance
Volume Perspective: Focus on quality per minute (relying on time slices) indicating
overall quality of the observed traffic
Session Perspective: Focus on quality for entire streams indicating distribution of
quality across call sessions.
The Voipfuture media KPI system provides exactly these views on the media plane
thereby complementing standard control plane KPIs.
GMR Good Minute Ratio CMR Critical Minute Ratio
GSR Good Stream Ratio CSR Critical Stream Ratio
GCR Good Call Ratio CCR Critical Call Ratio
7Understanding service quality
Insights and
use cases
Overview:
The Voipfuture mid-point end-to-end
KPI System
Network-centric view on User-centric view on service
service availability & SIP availability &
signaling performance SIP signaling performance
control plane
Monitoring of availability & Monitoring service availability
signaling performance of and signaling performance from
interconnection partners a customer perspective
Network-centric view on voice User-centric view on voice
quality & network performance quality & network performance
media plane
Monitoring voice quality at Monitoring of in-call user
interconnections & quality of experience & overall network
network segments performanceVO I P FU T U R E : NEXT GENERATION KPIs
Mid-point KPIs
Mid-point metrics are used to measure the quality directly at network boundaries,
i.e. typically close to Session Border Controllers. This is done to monitor the traffic sent
by an interconnection partner or when reporting on the quality of one’s own traffic for
an SLA. The following defines the four mid-point KPIs of the media KPI system, which
can be calculated for any group of RTP streams as defined by time, probing point, ori-
gination and destination, direction, trunk association etc.
Good Minute Ratio (GMR)
This KPI is used to measure the overall quality of the measured voice traffic as per-
ceived by the users. The GMR (Good Minute Ratio) reflects the proportion of ‘good’
RTP stream minutes over all minutes. A 'good minute' is a set of time slices represen-
ting one minute, where all time slices have a MOS above 4.0. The good minute ratio
is calculated as follows:
GMR = # good minutes / total number of minutes
The GMR is calculated for narrowband and wideband MOS scales.
Good Stream Ratio (GSR)
This metric is used to determine the fraction of RTP streams that are of good quality
as perceived by the user. A 'good stream' is a RTP stream, where all measured time
slices have a MOS above 4.0. The good stream ratio is calculated as follows:
GSR = # good streams / total number of streams
The GSR is calculated for narrowband and wideband MOS scales.
The GMR and GSR are utilized to measure the quality at specific points in the net-
work.
Both KPIs are based on the MOS and thus make a statement about the estimated
user experience. Qrystal offers similar KPIs to assess the network performance based
on RTP stream measurements.
Critical Minute Ratio (CMR)
This metric is utilized to measure the overall technical quality of the measured RTP
traffic. A ‘critical minute’ is a set of time slices representing one minute, where all time
slices have critical impairments. The following issues are regarded ‘critical’:
Packet burst losses and
Severe jitter that effectively leads to gaps in the audio playout.
The critical minute ratio is calculated as follows:
CMR = # critical minutes / total number of minutes
The best value for this KPI is 0%, meaning that little to no minutes with critical
transport impairments have been monitored.
Critical Stream Ratio (CSR)
This metric is used to determine the fraction of RTP streams that are impacted by
critical impairments. A ‚critical stream‘ is an RTP stream, where at least one measured
time slice has a critical impairment. The critical stream ratio is calculated as follows:
CSR = # critical streams / total number of streams
The best value for this KPI is 0%, which means that little or no streams with critical
transport impairments have been monitored.
9VO I P FU T U R E : NEXT GENERATION KPIs
End-to-end KPIs
As stated before GMR, GSR, CMR and CSR have their use cases in assessing
the quality at network and domain boundaries. Other use cases require a call-based,
end-to-end, view, which better reflects the actual user experience. End-to-end KPIs for
the media plane are based on quality-enriched call detail records (CDR), which contain
data related to the call signaling as well as to the in-call media quality. Such CDRs can
summarize the time slice data of a call’s RTP streams, e.g. by storing the minimum,
average and maximum MOS value as well as transport quality metrics for each call
direction.
A single RTP stream going from one call party to another may be measured a
number of times at different monitoring points. Which measurements should be in-
cluded in the CDR, which is the most relevant in terms of the user experience? Since
the quality of a media stream can only degrade as it flows through the network, the
measurement closest to the media’s playout point is the most relevant. For the media
direction from A-party to B-party, the measurement closest to the B-party best reflects
the user experience and vice versa.
Selecting the most relevant measurements is crucial, but does not yet define
the quality of a call. MOS - according to ITU-T Recommendation P.800 - is only
defined for audio sequences with a duration between 4 and 15 seconds. Typical phone
calls are much longer and time slicing will generate a lot of quality data that needs
to be aggregated per call direction. This can be done in a number of ways, but ETSI
proposes to use the GMR and CMR as described above. Further aggregation of quality
to the level of a complete call needs to consider the quality for both media directions.
Possible metrics include the minimum quality or the average quality of the media di-
rections. However, looking at groups of calls it becomes obvious that the conven-
tional approach of repeatedly averaging MOS (or any other quality metric for
that matter) is very problematic. Taken to the extreme one would average MOS
of all time slices for each direction, calculate the average MOS of the two directions
and then average over all MOS values per call. This approach will conceal any issues
revealed by the measurements. ETSI TR 103 639 therefore extends the concepts
introduced for mid-point KPIs to the call-level and defines two KPIs based on the
definition of ‘good’ and ‘critical’ calls.
Good Call Ratio (GCR)
This metric is used to determine the fraction of calls that are of good quality as
perceived by the users. A ‚good call‘ is a call where the stream received by the A-party
and the stream received by the B-party are good streams as defined above. (Both
streams as measured closest to the respective listening parties.) The good call ratio is
calculated as follows:
GCR = # good calls / total number of calls
The GCR is calculated for narrowband and wideband MOS scales.
Critical Call Ratio (CCR)
This metric is used to determine the fraction of calls that are impacted by critical
impairments of the media streams. A ‚critical call‘ is a call, where at least one call direc-
tion has a critical impairment. The critical call ratio is calculated as follows:
CCR = # critical call / total number of calls
The best value for this KPI is 0%, which means that no calls with critical transport
impairments have been monitored.
10VO I P FU T U R E : NEXT GENERATION KPIs
Call analysis: The hierarchy
of collected data
Quality of Experience &
the position of measuring
points The nearer to the listening party,
the higher the relevance
B
A B
A
11Conclusion
This whitepaper has discussed the problem of effectively measuring the quality of
VoIP services. The solution is provided by ETSI’s TR 103 639. Annex A defines proven
and accurate timeslicing KPIs which complement the well-known and widely used SIP
signaling KPIs specified in IETF RFC 6076. Voipfuture Qrystal combines both dimensi-
ons into one effective tool.
Qrystal offers fixed time slicing technology, which provides MOS and other
metrics to accurately assess in-call user experience. These atomic units of quality can
be conveniently aggregated to create statistics for groups of calls and RTP streams
without any loss of detail. Based on the time slice information we discussed six KPIs
defined in ETSI TR 103 639 Annex A for monitoring voice quality. Each KPI provides a
different perspective on the user experience and network performance. Four of these
KPIs can be used to measure the media quality at a certain point in the network, e.g.
at an interconnection. Two KPIs can be used to measure the end-to-end user
experience for groups of calls. All KPIs can be calculated for different grouping criteria,
in particular for trunks and routes
About
Voipfuture is a premium voice quality monitoring vendor developing unique tech-
nology for assessing, aggregating, analyzing, and visualizing voice quality information.
Voipfuture products offer a precise view on media and control plane to communica-
tion service providers, wholesalers and enterprises.
Since its launch, Voipfuture has been at the forefront of voice quality monitoring
and continues to redefine Voice over IP by connecting their customers’ view on service
quality with high resolution user experience.You can also read