3Q18 Earnings Conference Call - November 1, 2018
←
→
Page content transcription
If your browser does not render page correctly, please read the page content below
3Q18 Earnings Conference Call

                                                                  November 1, 2018

ITGR: 3Q18 Earnings Conference Call / November 1, 2018 / Page 1
Presentation of Financial Information &
     Forward-Looking Statements
     Historical financial and operating data in this presentation reflect the consolidated results of Integer for the periods
     indicated.

     This presentation includes financial information prepared in accordance with accounting principles generally accepted in
     the United States, or GAAP, as well as other financial measures referred to as non-GAAP. The non-GAAP financial
     measures in this presentation, which include Adjusted Net Income, Adjusted Diluted EPS, Earnings Before Interest Taxes
     Depreciation and Amortization (EBITDA), Adjusted EBITDA, and organic growth rates should be considered in addition to,
     but not as substitutes for, the information prepared in accordance with GAAP. For reconciliations of these non-GAAP
     financial measures to the most comparable GAAP measures, please refer to the appendix to this presentation and the
     earnings release associated with this quarterly period which can be found in the investor relations section of our corporate
     website (investor.integer.net).

     Statements made in this presentation whether written or oral may be “forward-looking statements” within the meaning of
     Section 27A of the Securities Act of 1933, as amended, and Section 21E of Securities Exchange Act of 1934, as
     amended, and involve a number of risks and uncertainties. These statements can be identified by terminology such as
     “may,” “will,” “should,” “could,” “expects,” “intends,” “plans,” “anticipates,” “believes,” “estimates,” “predicts,” “potential” or
     “continue” or “variations” or the negative of these terms or other comparable terminology. These statements are based on
     the company’s current expectations and speak only as of November 1, 2018. The Company’s actual results could differ
     materially from those stated or implied by such forward-looking statements. The Company assumes no obligation to
     update forward-looking information, including information in this presentation, to reflect changed assumptions, the
     occurrence of unanticipated events or changes in future operating results, financial conditions or prospects.

ITGR: 3Q18 Earnings Conference Call / November 1, 2018 / Page 2
Agenda
• Opening Comments
• Financial Results
• Product Line Review
• 2018 Outlook
• Question & Answer Period
ITGR: 3Q18 Earnings Conference Call / November 1, 2018 / Page 3Opening Comments ITGR: 3Q18 Earnings Conference Call / November 1, 2018 / Page 4
Strong Financial Results…Executing Strategy…Building Team

                                                            Financial Results
       Integer delivered                                          •   3Q results support improved guidance
                                                                       - Revenue guidance increased to 6% - 7% growth
       another strong quarter
                                                                       - EPS guidance increased primarily due to lower taxes and interest expense
       of sales and profit
                                                                  •   Continued Deleveraging
       growth                                                          - Paid down $595 million of debt in 3Q
                                                                       - Leverage ratio at 3.7 times adjusted EBITDA versus 5.6 at the beginning of 2018

                                                            Strategy
       Launched Operational                                       •   Launched execution of multi-year Operational Strategic Imperatives in
                                                                      September with Top 100 Senior Leaders
       Strategic Imperatives
                                                                  •   Transitioning to a new sales organization structure in 4Q to drive customer
                                                                      focused growth strategies and increase accountability for sales growth

                                                            Leadership
       Continued Building                                         •   Jason Garland joined as EVP/CFO to bring strong operational finance
       Leadership Team                                                leadership to execution of Operational Strategic Imperatives
                                                                  •   As previously announced, Jeremy Friedman, former COO/Interim CFO,
                                                                      retiring at end of 2018. Customer Operational Strategic Imperatives
                                                                      transitioned to Payman Khales (Pres. C&V) and Tony Gonzalez (Pres. CRMN)

ITGR: 3Q18 Earnings Conference Call / November 1, 2018 / Page 5
Financial Results
3Q18 Adjusted Financial Results(1)
       ($ in millions, except per share amounts)

                   Adjusted Sales                                                         Adjusted EBITDA                                                 Adjusted Net Income
                                                                  (2)                                                                (3)                                                                 (3)
                                            7%       organic                                                   9%       organic                                                    15%        organic
             % Growth
                                            7%       reported                                                 10%       reported                                                   18%        reported

                                                                                                                                                                                               $36
                                                                                                                        $68                                                                FX adjusted
                                               $305                                                                                                                    $31
                                              Reported                                          $63                  FX adjusted
                                                                                                                                                                     FX Adjusted
                      $285                                                                  FX Adjusted
                     Reported                                                                                                                                                                 $35
                                               $305                                                                     $67                                                                 Reported
                                                                                               $60                    Reported                                         $29
                      $284                  FX Adjusted
                                                                                             Reported                                                                 Reported
                    FX Adjusted

                     3Q17                     3Q18                                            3Q17                    3Q18                                            3Q17                   3Q18

                                                                                                                                                  Adj.   Repo rted     $ 0.91                 $ 1.06
        As reported GAAP and Non-GAAP numbers                                                                                                     EPS    FX
                                                                                                                                                                       $ 0.98                 $ 1.10
                                                                                                                                                         A djusted
        Foreign currency impact on reported GAAP and Non-GAAP numbers

 (1)    Refer to the appendix of this presentation for a reconciliation of Adjusted EBITDA, Adjusted Net Income, Adjusted EPS, and organic growth rates to the most directly comparable GAAP measure
 (2)    Organic growth for Sales excludes the impact of foreign currency exchange rates
 (3)    Organic growth for Adjusted EBITDA, Adjusted Net Income, and Adjusted EPS exclude the impact of foreign currency reported in other (income) loss, net

ITGR: 3Q18 Earnings Conference Call / November 1, 2018 / Page 7
Year-over-Year Sales Improvement Continues(1)
Trailing 4 Quarters
Cardio & Vascular
12%
8%
4%
0%
Integer
9%
Cardiac & Neuromodulation
8%
6%
7%
2%
6%
(2)%
4%
(6)%
Advanced Surgical, Orthopedic & Portable Medical
15%
10%
0%
5% 3Q17 4Q17 1Q18 2Q18 3Q18
0%
Non-Medical (Electrochem)
40%
20%
0%
(1) Excludes impact from changes in foreign currency exchange rates
ITGR: 3Q18 Earnings Conference Call / November 1, 2018 / Page 8Adjusted EBITDA & Adjusted Net Income
($ in millions except per share amounts)
Adjusted EBITDA Adjusted Net Income
$9
$1 $35
$1
$67 $(4) $(1)
$29
$60 FX Tax Rate
• $10 from Operations
• $1 FX
Incentive Operational
• $(4) Incentive Compensation Improvement
Compensation
3Q17 3Q18 3Q17 Operational Incentive
Improvement Compensation
FX Interest Tax Rate 3Q18
(1)
Adj. (1)
$0.91 $0.25 $(0.12) $0.02 $0.03 $(0.04) $1.06
EPS
(1) Includes $0.02 unfavorable impact due to year-over-year share dilution
Note: Amounts may not sum due to rounding
ITGR: 3Q18 Earnings Conference Call / November 1, 2018 / Page 9Continued Deleveraging
Cash Flow From Ops Free Cash Flow (1)
($ in millions) $54 ($ in millions) $40
$36
$46
$38
• Reduced leverage ratio to
$27 3.7 times adjusted EBITDA
$34
$21
$21 • $548M from divestiture
$13
proceeds
• $40M in additional
accelerated pay down
3Q17 4Q17 1Q18 2Q18 3Q18 3Q17 4Q17 1Q18 2Q18 3Q18
• No significant maturities
Debt Payments Leverage (2) until 2021; well within
($ in millions) $595
covenants
5.8x
5.6x
5.4x
$50 $548 5.1x
$38
$25 3.7x
$22 $43
$40
$33
$15 $18
$5 $7 $7 $7 $7
(3) (1) Free Cash Flow defined as Cash Flow from Operations
3Q17 4Q17 1Q18 2Q18 3Q18 3Q17 4Q17 1Q18 2Q18 3Q18
less Capital Expenditures, net
Accelerated Repayment from Divestiture Proceeds (2) Leverage calculated as Total Debt less Cash and Cash
Accelerated Repayment Equivalents divided by trailing 4 quarter Adjusted EBITDA
Required Repayment (3) 3Q18 Accelerated Repayments totaled $588M; $548 from
divestiture proceeds plus $40M from operations
ITGR: 3Q18 Earnings Conference Call / November 1, 2018 / Page 10Product Line Review
Cardio & Vascular

           Offering a full-range of services for the design, development, and manufacturing of diagnostic and interventional
              cardiac and endovascular delivery and retrieval devices, along with comprehensive supply-chain solutions

                 Organic Quarterly Y-o-Y Growth

                                                             13%
                                    11%
                                               10%                            9%
                     7%
% Change

                                                                                       Steerable Sheaths   Catheters & Sheaths   Guidewires, Stylets &   Introducers
                                                                                                                                     Accessories

           0%                                                                      •    3Q18 year-over-year growth driven by continued strong
                   3Q17            4Q17       1Q18          2Q18         3Q18           demand in the electrophysiology market stemming from
                 Trailing 4-Quarter Sales
                                                                                        customer share gains & new product launch and timing from
                 ($ in millions)
                                                                        $575
                                                                                        a customer inventory replenishment
                                             $544         $562
                  $516             $531
                                                                                   •    Trailing 4-quarter sales growth of 11% driven by continued
                                                                                        strong demand and market penetration in the focus markets
                                                                                        of electrophysiology, structural heart and peripheral vascular

                                                                                   •    Expect growth trend to remain above market from increased
                                                                                        focus on high growth C&V market segments

                 3Q17              4Q17     1Q18          2Q18          3Q18
                  9%               10%        10%           11%           11%

           ITGR: 3Q18 Earnings Conference Call / November 1, 2018 / Page 12
Cardiac & Neuromodulation
Providing technology solutions for the active implantable medical device industry
by partnering with customers to bring high-quality products to
established and emerging markets – from initial concept through high-volume manufacturing
Organic Quarterly Y-o-Y Growth
9% 8%
5%
% Change
1%
Pulse Generator Pulse Generators & External
0% Leads & Lead Components,
Components & Solutions (Programmers,
Adaptors & Assemblies
3Q17 4Q17 1Q18 2Q18 3Q18 Assemblies Chargers, Patient Devices)
(6)%
• CRM growth driven by increased components market
penetration & lower 2017 comparables from customer
Trailing 4-Quarter Sales
($ in millions) inventory adjustments. Neuro growth driven by spinal cord
$427 $428 $433 $443 $451 stimulation market demand and increased components
market penetration
• Trailing 4-quarter CRM sales slightly ahead of market
growth and neuromodulation sales running significantly
ahead of market due to accelerating demand in finished
devices and leads
3Q17 4Q17 1Q18 2Q18 3Q18 • Expect sales to decrease in 4Q18 compared to extremely
(4)% (2)% (0)% 2% 6%
strong 4Q17
ITGR: 3Q18 Earnings Conference Call / November 1, 2018 / Page 13Advanced Surgical, Orthopedics & Portable Medical
Supporting our divested AS&O business and providing technologies
and solutions to Portable Medical markets
Organic Quarterly Y-o-Y Growth
25%
21%
Orthopedic Implants & Electrosurgical Li-Ion Battery Core Battery
% Change
Instruments Accessories Packs Pack Assemblies
9%
7%
4%
0%
3Q17 4Q17 1Q18 2Q18 3Q18 • 3Q18 sales increase driven by above market growth in
advanced surgical and orthopedic products
Trailing 4-Quarter Sales
($ in millions)
$130
$121
$127 • Trailing 4-quarter sales growth strong due to robust 1st
$114 $115
half 2018 market demand primarily in Portable Medical
• Sales expected to level off from strong first half to be
more in line with overall market growth
3Q17 4Q17 1Q18 2Q18 3Q18
6% 8% 10% 13% 13%
ITGR: 3Q18 Earnings Conference Call / November 1, 2018 / Page 14Electrochem
Enhancing lives worldwide by providing superior power solutions that
enable the success and advancement of our customers’ critical applications
Organic Quarterly Y-o-Y Growth
71%
30%
% Change
Battery Cells Battery Packs Battery Chargers
12%
(5)%
0%
(18)%
3Q17 4Q17 1Q18 2Q18 3Q18 • 3Q18 sales decline due to timing of energy customer
inventory adjustments and planned phase out of certain
Trailing 4-Quarter Sales rechargeable battery pack products
($ in millions)
• Trailing 4-quarter trend reflects flattening of North American
$57 $58 $58 drilling activity.
$54 $55
• Expect growth in 2019 from new customers and products
and renewed military market government funding
3Q17 4Q17 1Q18 2Q18 3Q18
23% 37% 41% 22% 3%
ITGR: 3Q18 Earnings Conference Call / November 1, 2018 / Page 152018 Revised Outlook
2018 Outlook
     ($ in millions except per share amounts)

                    Adjusted Sales                                 Adjusted EBITDA         Adjusted EPS

     Growth %                            6% - 7%                            9% - 13%              15% - 20%

                                  $1,195 - $1,210                           $255 - $265           $3.55 - $3.70

                 $1,131                                             $234                  $3.09

                    2017                  2018                      2017      2018        2017        2018
                                         Outlook                             Outlook                 Outlook

     Prior Outlook                  $1,175 - $1,200                         $255 - $265            $3.35 - $3.65

ITGR: 3Q18 Earnings Conference Call / November 1, 2018 / Page 17
Increased Cash Flow Outlook
Cash Flow From Ops Free Cash Flow(1) Debt Payments Leverage(2)
($ in millions) ($ in millions) ($ in millions)
~$695
~$165
$149 ~$120
$120 6.1x
5.6x
$103
$106 $145
~ 3.6x
$129
$145+
$47
$98
$44
$15
$29 $31 $30
FY16 FY17 FY18 FY16 FY17 FY18 2016 (3) 2017 2018 YE16 YE17 YE18
Outlook Outlook Outlook Outlook
Accelerated Repayment
Required Repayment
Prior
$160+ $110+ $665+
Outlook
(1) Free Cash Flow defined as Cash Flow from Operations less Capital Expenditures, net
(2) Leverage calculated as Total Debt less Cash and Cash Equivalents divided by Trailing 4 Quarter Adjusted EBITDA
(3) Reflects debt payments excluding $55M of borrowings used to fund $76M of cash provided to Nuvectra as part of the spin-off on March 14, 2016.
ITGR: 3Q18 Earnings Conference Call / November 1, 2018 / Page 18Focused Strategy to Drive Long-term Growth
Portfolio Strategy Operational Strategy:
How we win Strategic Imperatives
in the markets we serve
How we achieve excellence in everything we do
Invest to Grow
Cardio & Vascular
Neuromodulation
Electrochem
Protect & Preserve
Cardiac Rhythm Management
Improve Profitability
Portable Medical
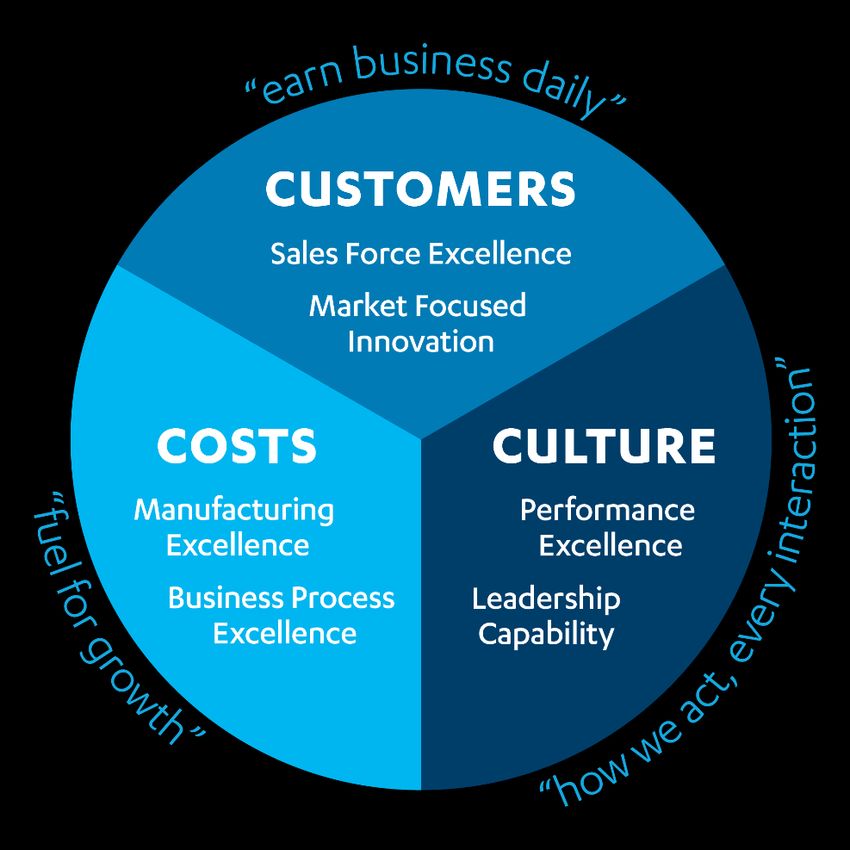
ITGR: 3Q18 Earnings Conference Call / November 1, 2018 / Page 19Summary
Vision Financial Results
Enhance patient’s lives by being our • 3Q results support slightly improved guidance
customers partner of choice • Continued Deleveraging
Strategic Imperatives
- Sales Force Excellence
Strategy
- Market Focused Innovation
• Launched execution of multi-year Operational Strategic Imperatives
- Manufacturing Excellence
• Transitioning to a new sales organization structure in 4Q
- Business Process Excellence
- Performance Excellence
- Leadership Capability
Leadership
Clear Goals • Jason Garland joined as EVP/CFO
- Sales Growth Above Market • Jeremy Friedman, former COO/Interim CFO, retiring at YE18
- Profit Growth 2x Sales Growth
- Earn a Valuation Premium
ITGR: 3Q18 Earnings Conference Call / November 1, 2018 / Page 20APPENDIX ITGR: 3Q18 Earnings Conference Call / November 1, 2018 / Page 21
Historical Financial Results
     ($ in millions except per share amounts)

                                                                                                                                                                                                 (1) (2)
                               Adjusted Sales                                                                                                               Adjusted EPS
                                                                               $313
                                                                                              $305                Organic
                                               $301
                                  $285                         $292                                               Adjusted
                     $280                                                                                          EPS(3)
       $265                                                                                                             $0.58         $0.91              $0.98            $0.89               $0.66        $1.01   $1.10

                                                                                                                             Impact of foreign currency reported in other gain or loss, net
                                                                                                                             Adjusted EPS, as reported

                                        (1)   Refer to the appendix of this presentation for a reconciliation of Adjusted EPS to the most directly comparable GAAP measure
                                        (2)   The quarterly and annual EPS numbers are calculated independently and may not sum to the total
                                        (3)   Excludes impact of foreign currency reported in other gain or loss, net

ITGR: 3Q18 Earnings Conference Call / November 1, 2018 / Page 22
2018 Full-Year Outlook
($ in millions except per share amounts)
2018 Outlook Prior Guidance Growth Updated Guidance Growth
(Non-GAAP) (Non-GAAP)
Adjusted Revenue $1,175 - $1,200 4% to 6% $1,195 - $1,210 6% to 7%
Adjusted Net Income $110 - $120 11% to 21% $117 - $122 18% to 23%
Adjusted EBITDA $255 - $265 9% to 13% $255 - $265 9% to 13%
Adjusted Earnings per Diluted Share $3.35 - $3.65 8% to 18% $3.55 - $3.70 15% to 20%
ITGR: 3Q18 Earnings Conference Call / November 1, 2018 / Page 232018 Full-Year Outlook – Supplemental Items Affecting Cash Flow
($ in millions, except per share amounts)
ITGR: 3Q18 Earnings Conference Call / November 1, 2018 / Page 24Non-GAAP Reconciliation
Net Income and Diluted EPS Reconciliation – QTD
($ in thousands, except per share amounts)
See the Footnotes to this table on Slide 26 of this presentation
ITGR: 3Q18 Earnings Conference Call / November 1, 2018 / Page 25Footnotes to Non-GAAP Reconciliation ITGR: 3Q18 Earnings Conference Call / November 1, 2018 / Page 26
Non-GAAP Reconciliation
     3Q18 Net Income and Diluted EPS Reconciliation – Detailed View
     ($ in thousands, except per share amounts)

ITGR: 3Q18 Earnings Conference Call / November 1, 2018 / Page 27
Non-GAAP Reconciliation
EBITDA and Adjusted EBITDA Reconciliation
($ in thousands)
ITGR: 3Q18 Earnings Conference Call / November 1, 2018 / Page 28Non-GAAP Reconciliation
Organic Sales Growth Rate Reconciliation (% Change)
a) Represents adjustment to third quarter and year-to-date 2017 sales to exclude the net impact of the LSA.
b) Third quarter and year-to-date 2018 sales were positively impacted by $0.1 million (negative impact) and $2.3 million (positive impact), respectively, due to foreign
currency exchange rate fluctuations, primarily in our Cardio & Vascular product line.
ITGR: 3Q18 Earnings Conference Call / November 1, 2018 / Page 29Non-GAAP Reconciliation
Non-GAAP Organic Growth Rate Reconciliation (% Change)
NM calculated change not meaningful
(a) Represents the impact to our growth rate from our Non-GAAP adjustments.
(b) Represents the impact to our growth rate due to changes in foreign currency exchange rates
ITGR: 3Q18 Earnings Conference Call / November 1, 2018 / Page 30Non-GAAP Reconciliation
2018 Full-Year Outlook(a)
($ in millions, except per share amounts)
ITGR: 3Q18 Earnings Conference Call / November 1, 2018 / Page 31Capitalization
($ in millions) As Reported Original 6/30/18 9/28/18
9/28/18 Rate Rate Rate
Cash and Cash Equivalents $23
$200m Revolver due 2020 -- L + 325 L + 325 L + 250
Term Loan A due 2021 314 L + 325 L + 325 L + 250
Term Loan B due 2022 658 L + 425 L + 325 L + 300
Total Secured Debt $972
Senior Unsecured Notes due 2023 -- 9.125% 9.125% --
(1)
Total Debt $972
Net Debt $949
Continuing Operations statistics
LTM Adjusted EBITDA $256
LTM Cash Interest Expense 52
LTM Capital Expenditures 36
Credit statistics
Net Total Debt / LTM Adjusted EBITDA 3.7x
LTM Adjusted EBITDA / Cash Interest Expense 4.9x
(1) Gross debt outstanding, not reduced for unamortized discount and debt issuance costs
ITGR: 3Q18 Earnings Conference Call / November 1, 2018 / Page 32Contact Information
Tony Borowicz
SVP, Strategy, Corporate Development & Investor Relations
Integer
Tony.Borowicz@Integer.net
(O) 716.759.5809
www.integer.net
ITGR: 3Q18 Earnings Conference Call / November 1, 2018 / Page 33You can also read