DRAFT Full year results - 30 June 2018 - Trade Me Group Ltd

Page created by Sandra Castillo
 
CONTINUE READING
DRAFT Full year results - 30 June 2018 - Trade Me Group Ltd
Full year results
30 June 2018

     DRAFT

Jon Macdonald        CEO
Caroline Rawlinson   CFO
DRAFT Full year results - 30 June 2018 - Trade Me Group Ltd
During F18, we
                    Be even more deeply ingrained in
outlined our        Kiwis’ lives through online
ambitions for the   experiences they love

next five years.    Know our customers more intimately
                    than any competitor and provide a
                    relevant, engaging and personalised
                    experience

                    Be quick experimenters, expert in
                    growing new things

                    A brand that outshines all others in NZ
                    as the most loved and trusted

                    The workplace of choice – a magnet
                    for top local and offshore talent

                                                              2
DRAFT Full year results - 30 June 2018 - Trade Me Group Ltd
We shared the strategic priorities that support our
ambitions.
 Our vision           To make life better for Kiwis through online experiences they love

                         Strengthen our core                    Expand our offer               Grow our
  Our                    propositions (same                                                    ecosystem
                                                                (extension of existing
  strategic              customers &                            businesses/markets)
                                                                                               (new
                                                                                               customers/
  priorities             markets)
                                                                                               businesses)

                         Continue to improve our organisational effectiveness so we can get
                         faster at delivering great stuff

 Our values            Customer
                      Customer    Aroha
                               Aroha              Hunger like Ed       No ‘I’ in Trade Me   Don’t be a dick

 We expanded in detail on our strategy at our May 2018 investor day.
                                                                                                              3
DRAFT Full year results - 30 June 2018 - Trade Me Group Ltd
We delivered a good financial result.
                              Revenue                        EBITDA          NPAT                    Dividend

   F18
   YoY                        $250m                          $164m           $97m                    19.6cps
                              +7%                            +6%1            +4%1                    +6%

   H2                         $128m                          $85m            $50m                    10.5cps
   YoY                        +6%                            +7%             +5%                     +5%

Revenue growth was driven by the continued strong performance of our classifieds businesses.

Total expenses grew 7.1% to $86m due to headcount growth and increased cost of sales. Excluding cost of sales, expenses
grew 5.3% to $68m.

EBIT at $138m was up 3.8%1 on F17. NPAT growth was solid in H2 at 4.6%, resulting in a 3.9%1 increase for the full year.

A fully imputed dividend of 10.5cps will be paid in September 2018.

A fully imputed special dividend of 22.0cps will also be paid in September 2018.

Announcing a small investment in Wellington growth company Sharesies.

Note 1: Growth   rates exclude H1 F17 one-off non operating items of $1.4m

                                                                                                                           4
DRAFT Full year results - 30 June 2018 - Trade Me Group Ltd
Group Financials
DRAFT Full year results - 30 June 2018 - Trade Me Group Ltd
Strong classifieds’ results grew revenue to $250m.

                                                                 Motors
                                                                 $71.7m up 12.7%
   General Items

   $71.3m up 1.3%

       Other1
       $6.7m down 25%
           Payments
           $6.1m up 6.0%
                Insurance                                             Property
                $5.8m up 4.6%
                                                                      $37.6m up 10.2%
                      Advertising
                      $19.5m up 3.7%
                                       Jobs

                                       $31.7m up 14.1%

                                                Note 1   Other down 25% in part due to sale of Travelbug and BookIt.   6
DRAFT Full year results - 30 June 2018 - Trade Me Group Ltd
Classifieds’ B2B revenues underpin the growth.
Our B2B offering is an increasingly important part of our classifieds businesses. B2B revenues have delivered great growth in F18,
driven by continued excellent momentum of depth revenue - which from motor dealers was +41% YoY, from real estate agents for
residential for sale was +38% YoY, and from recruiters purchasing volume packs / jobs plans was +45% YoY.

                           $72m
                                                                       $38m
          $64m                                        $34m
                                                                                                                     $32m
        MotorWeb
                                                                                                    $28m

                                                                      +12.9%                                         +20.0%
                         +22.5%
                                                                                                   Volume
          Dealers                                     Agents
                                                                                                   Packs /
                                                                                                  Job Plans

          Directs                                     Directs                                       Directs

           F17               F18                        F17              F18                         F17               F18

           Motors Total Revenue                        Property Total Revenue                         Jobs Total Revenue

                                                                                                                                     7
DRAFT Full year results - 30 June 2018 - Trade Me Group Ltd
The details on our financial performance.
        NZD $000s                                      F18            F17             Movement                • Revenue of continuing businesses was +6.9%.
        Classifieds                                140,968        125,480         15,488     12.3%
        General Items                               71,325         70,415            910       1.3%
                                                                                                              • Increased COS reflects the mix of revenue growth
        Other                                       38,070         38,986           (916)    (2.3%)
        Total revenue                              250,363        234,881         15,482       6.6%             (Motorweb and Jobs).

        Cost of sales                               17,802         15,515          2,287         14.7%        • Expense growth is mostly due to increased people costs.
                                                                                                                FTEs increased from 514 at Jun-17 to 561 at Jun-18.
        Net revenue                                232,561        219,366         13,195          6.0%

        Employee benefit expense                    39,923         35,828          4,095         11.4%        • Promotion expenses were lower in F18 due to operational
        Web infrastructure expense                   5,472          5,620           (148)        (2.6%)         efficiency and great unpaid coverage.
        Promotion expense                           10,217         10,967           (750)        (6.8%)
        Other expenses                              12,538         12,326            212          1.7%
        Total expenses                              68,150         64,741          3,409          5.3%        • The associate losses includes losses from Harmoney Corp
                                                                                                                Ltd and Allsorts Ltd (established during F18).
        EBITDA before associates                   164,411        154,625          9,786          6.3%

                                                                                                              • There have been no non-operating items in F18.
        Associate losses                              (634)          (342)          (292)        85.4%
        EBITDA1                                    163,777        154,283          9,494          6.2%
                                                                                                              • D&A growth is due to continued platform development,
        Depreciation and amortisation               25,595         21,149          4,446         21.0%          which is amortised over three years.
        EBIT1                                      138,182        133,134          5,048          3.8%

        Net finance costs                            3,604          3,827           (223)        (5.8%)
                                                                                                              • Fully imputed dividend of 10.5 cps, supp. dividend 1.8529
        Profit before tax1                         134,578        129,307          5,271          4.1%          cps with a record date 7 September 2018, payment date 18
                                                                                                                September 2018.
        Income tax expense                          38,011         36,343          1,668          4.6%
        Net operating profit1                       96,567         92,964          3,603          3.9%
                                                                                                              • Fully imputed special dividend of 22.0 cps, supp. dividend
        Non-operating items                               -         1,416         (1,416)              -        3.8824 cps with a record date 7 September 2018, payment
                                                                                                                date 18 September 2018.
        Net profit                                  96,567         94,380          2,187          2.3%

                                                                                                                                                                             8
1   F17 EBITDA, EBIT, profit before tax and net operating profit are all prior to one-off non operating adjustments.
DRAFT Full year results - 30 June 2018 - Trade Me Group Ltd
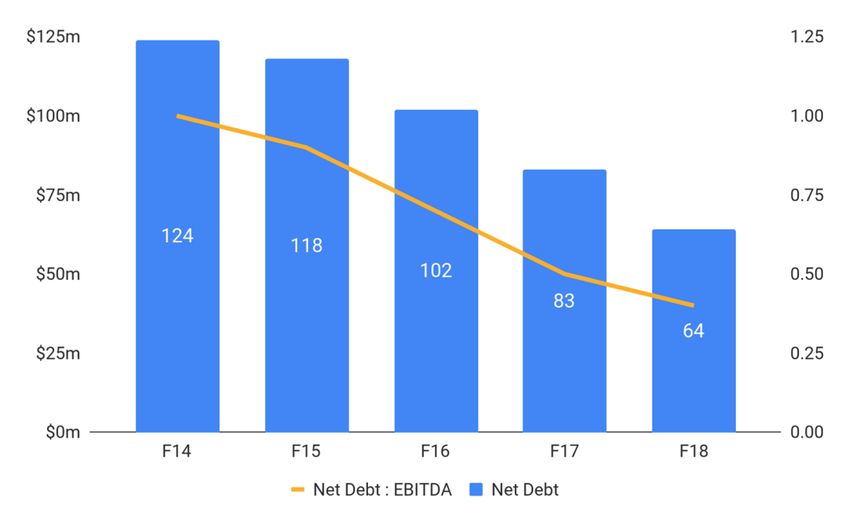
The details on our financial position.
             Capital Expenditure and D&A                                                                       30-Jun-18 30-Jun-17

                                                          Total current assets                                       89.5      69.2
                                                          Total non-current assets                                  834.2     832.4
                                                          Total assets                                              923.7     901.6

                                                          Total current liabilities                                  32.5      31.4
                                                          Total non-current liabilities                             144.3     144.5
                                                          Total liabilities                                         176.8     175.9

                                                          Contributed equity                                      1,070.1    1,069.9
                                                          Other reserves                                           (485.5)   (485.9)
                                                          Retained earnings                                         162.3     141.7
                                                          Total equity attributable to owners of the Company        746.9     725.7

                                                          Total equity and liabilities                              923.7     901.6

• F18 Capital Expenditure was $27m, up 9% YoY due to
                                                          • Non current liabilities includes $136m of debt. During H2 we
  increased capitalised development (totaling $23m with
                                                            refinanced one tranche of our debt in a syndicated facility with
  more staff focused on building new, and enhancing
                                                            CBA and Westpac.
  existing, products).
                                                          • Our net debt position is $64m with $72m of cash on hand.
• F18 D&A was 95% of capex - these expenses have
  converged as our rate of headcount growth has slowed.

                                                                                                                                       9
DRAFT Full year results - 30 June 2018 - Trade Me Group Ltd
We declare a fully imputed 22.0cps special dividend.

Since F14 our gearing has been declining as surplus cash
has been used to repay bank debt.
                                                                                       Ratio
                                                               Net debt
We outlined at our Investor Day in May 2018:                              Net debt : EBITDA

  ●   Our long run gearing target is ~1.0x net debt : EBITDA
  ●   Our priority is to not constrain our growth, and to
      ensure sufficient headroom to respond to a changing
      environment
  ●   We will continue to utilise the most appropriate
      method for capital distributions

As at 30 June 2018 our net debt : EBITDA has fallen to 0.4x.

To increase our gearing levels towards our long run target,
we declare a fully imputed special dividend of 22.0cps.

During September we will increase our level of debt with
CBA and Westpac to fund the special dividend.

                                                                                               10
Divisional
Performance
Motors: superb results strengthening our core
propositions to dealers.
                                                                       Strong revenue momentum driven by depth product uptake
Revenue growth YoY                   Dealer depth revenue growth YoY   and record inventory numbers for the full year.

+12.7%                               +41.0%                            New depth features for dealers, including dealer branding,
                                                                       was/now pricing and transparency of weekly repayment
MotorWeb revenue growth YoY          Total listings growth YoY         rates.

+15.7%                               +1.9%                             Continued investment in the core. E.g. enhanced customer
                                                                       search experience by expanding filter options.
Directs revenue growth YoY
                                                                       Australian vehicle data business expanding beyond core
+2.1%                                                                  insurance, including via new data brokerage entity Vehicle
                                                                       ID Australia.

                     Direct Yields                                                           Dealer Yields

               +5.8%            +1.7%                                                   +4.4%           +18.6%

                                                                                                                                    12
Property: new depth product underpins success.
Revenue growth YoY                        For sale revenue YoY             For rent revenue YoY
+10.2%                                    +11.3%                           +7.5%
Directs revenue growth YoY                For sale listing volumes YoY     For rent listing volumes

+3.0%                                     -0.4%
                                                                           YoY
                                                                           -2.4%
Agent for sale depth revenue growth YoY   Agent for sale revenue YoY       Agent for rent revenue
+38.2%                                    +14.2%                           YoY
                                                                           +7.4%

                                            Continued depth revenue momentum through:

                                              ●    Launch of new ‘Premium Listing’ product in March 2018
                                                   which raced to 7% penetration by June
                                              ●    Package penetration now ~15% (was ~5% in June 2017)

                                            Our inventory share vs nearest competitor continues to improve.

                                            Audience advantage relative to nearest competitor continues to
                                            widen (~2.5x).

                                                                                                              13
Property: excellent yield increases achieved.
      Agent For Sale Yields         Directs For Sale Yields

                                    +2.2%           +16.2%
      +8.3%          +13.0%

      Agent For Rent Yields         Directs For Rent Yields

      +7.5%          +7.5%          +3.9%           +18.1%

                                                              14
Jobs: focus on improving recruiter outcomes
delivering returns.                                            Volume Pack / Job Plans Yields

                                                                  +11.3%          +18.2%
Revenue growth YoY               Total listings YoY

+14.1%                           +1.3%
Directs revenue growth YoY       Total depth revenue YoY

+9.0%                            +34.3%

Continued strong growth in job profiles adding ~4k new                 Direct Yields
profiles per week.

Profile creation functionality added across Jobs and our iOS      +11.3%           +8.2%
and Android apps.

Positive response from recruiters involved in our candidate
database beta program, particularly those searching for
'blue-collar' candidates.

Account managed customer satisfaction of ~93%.
Highest job board brand awareness in NZ at 96%.

                                                                                                15
Marketplace: Good progress on strategic priorities...
 YoY GMS1 growth                  Unique buyers growth YoY

 +0.3%                            +0.6%
 to $838m

 YoY new GMS growth               Unique listers growth YoY

 +4.4%                            -0.3%
 YoY used GMS growth              Overall take rate

 -2.3%                            8.5%
New goods inventory continues to grow with 175 new retailers
on site.

Afterpay goes from strength to strength, now on >3m active
listings. In June ~70% of new goods were purchased using
either Ping / Pay Now (~65%) or Afterpay (~5%).

We have and will continue to test subscription offers (named
Choice by Trade Me) - includes extending the proposition to
provide offers from 3rd parties.

Selling promos: Extended experiments beyond 100% off. i.e.
Secret Stash Saturdays, Community Buy/Sell, Happy hour.

                             1GMS  = Gross Merchandise Sales is the total value of sales that Trade Me facilitates, excluding Classifieds and vehicles but including
                                                                                                                                                                       16
                             motors parts & accessories
...improving GMS for both New and Used.
Since December 2017 the Used Goods GMS growth rate has been improving and returned to positive growth in July 2018.

New goods GMS has seen a similar improvement, with Q4 of F18 above 3 of the 4 prior quarters and July 2018 delivered a strong
performance.

                                               Marketplace GMS Growth (YoY)

                                                                                                                                17
Our Ads, Payments and Insurance revenues grew.

  Advertising                           Payments                      Insurance                       Other
  $19.5m                                $6.1m                         $5.8m                           $6.7m
  +3.7%                                 +6.0%                         +4.6%                           -25%

Advertising: Revenue growth driven by new inventory placements and good yield management.

Payments: Ping (our new payments offering) out to 100% of our users, used for ~⅓ of daily Marketplace purchases in June 2018.

Insurance: Our Insurance business grew on increased new policies written.

Other revenue has declined partly due to the divestment of TravelBug and BookIt in December 2016
and a reduction in our 3rd party hosting activities.

                                                                                                                                18
Outlook
We forecast solid revenue and profit growth in F19.

         We are well placed to execute on our strategic priorities - strengthening our core proposition,
         expanding our offer to extend our existing businesses, and growing a vibrant NZ online ecosystem.

         In F19 we expect total revenue growth between 5 - 8% over F18. We also expect operating profit
         after tax to grow at a similar rate (in percentage terms).

         We expect capex to be ~$30m.

         These expectations are contingent on wider economic conditions, including employer and consumer
         sentiment, and real estate market volumes.

                                                                                                             20
You can also read