Second Quarter 2020 - Supplementary Presentation - "Navigator Holdings Ltd. (NYSE:NVGS)"
←
→
Page content transcription
If your browser does not render page correctly, please read the page content below
Second Quarter 2020 – Supplementary Presentation

      “Navigator Holdings Ltd. (NYSE:NVGS)”
                     Confidential
This presentation contains certain statements that may be deemed to be
“forward-looking statements” within the meaning of applicable federal
securities laws. Most forward-looking statements contain words that identify
them as forward-looking, such as “may”, “plan”, “seek”, “will”, “expect”, “intend”,
“estimate”, “anticipate”, “believe”, “project”, “opportunity”, “target”, “goal”,
“growing” and “continue” or other words that relate to future events, as
opposed to past or current events. All statements, other than statements of
historical facts, that address activities, events or developments that Navigator
Holdings Ltd. (“Navigator” or the “Company”) expects, projects, believes or
anticipates will or may occur in the future, including, without limitation,
acquisitions of vessels, the outlook for fleet utilization and shipping rates,
general industry conditions, future operating results of the Company’s vessels,
capital expenditures, expansion and growth opportunities, business strategy,
ability to pay dividends and other such matters, are forward-looking
statements. Although the Company believes that its expectations stated in this
presentation are based on reasonable assumptions, actual results may differ
any expectations or goals expressed in, or implied by, the forward-looking
statements included in this presentation, possibly to a material degree.

Navigator cannot assure you that the assumptions made in preparing any of
the forward-looking statements will prove accurate or that any long-term
financial goals will be realized. All forward-looking statements included in this
presentation speak only as of the date made, and Navigator undertakes no
obligation to update or revise publicly any such forward-looking statements,
whether as a result of new information, future events, or otherwise. In
particular, Navigator cautions you not to place undue weight on certain
forward-looking statements pertaining to potential growth opportunities or long-
term financial goals set forth herein.

                                                                                   2
                                                                              Confidential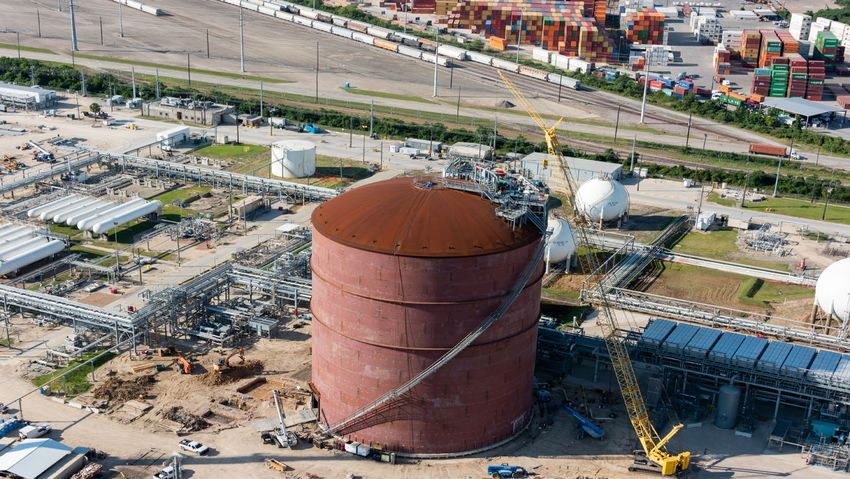
FINANCIAL PERFORMANCE
Q2 Adjusted Net Profit to vessel performance
Q2 Net Revenue & EBITDA $mm
Net Operating Revenue Adjusted EBITDA
$73m
$65m Loss on
$63m $62m $63m
Terminal Joint
$57m
$58m venture
$47m $48m
$39m
$34m $32m
$31m
$27m
$23m
$20m
Foreign Q2 2020
Q2 2020
exchange Reported
vessel Net
Movement Net profit
Income
Q2 2013 Q2 2014 Q2 2015 Q2 2016 Q2 2017 Q2 2018 Q2 2019 Q2 2020
Q2 Movement in Adjusted EBITDA $mm H1 Movement in Adjusted EBITDA $mm
Income Depreciation Forex on Income Depreciation
Taxes & snr Net Taxes &
Net Amortization secured Movement of Amortization
Interest
Interest bond non- Expense
Expense designated
Net
derivate
Profit
instrument
Movement
Forex on of non-
Net designated
Profit snr
secured derivate
bond instrument
Q2 2019 Q2 2020 1H2020
Adj Adj 1H2019 Adj
EBITDA EBITDA Adj EBITDA
EBITDA
3
Confidential
INCOME STATEMENT
                           Navigator Holdings Income Statement $000’s

                                                    Three months ended              Six months ended
                                                          June 30,                       June 30,                                                          2H2019         2H2020
                                                    2019           2020            2019               2020
Operating Revenue                                   73,586         82,465          149,689            163,722     Weighted average number of vessels           38.0           38.0
Operating expenses:                                                                                               Ownership days                              6,878          6,916
  Brokerage commissions                               1,233           1,305          2,542               2,560    Available days                              6,761          6,846
  Voyage expenses                                    16,437         17,654          29,794             35,198
                                                                                                                  Operating days                              5,746          6,071
  Vessel operating expenses                          27,448         26,493          56,922             53,899
  Depreciation and amortization                      18,913         19,151          37,861             38,361     Fleet utilization                           85.0%          88.7%
  General and administrative costs                    5,195           4,509          9,997             11,017     Average Daily Results:
         Total operating expenses                    69,226         69,112         137,116            141,035     Time charter equivalent rate         $     20,864   $     21,228
Operating income                                      4,360         13,353          12,573             22,687     Daily vessel operating expenses      $      8,276   $      7,793
Foreign currency gain on senior secured bonds         (768)         (4,852)          (952)               6,565
Unrealized loss on derivative instruments               861           6,354          1,645              (7,607)
Net interest expense                                (12,004)       (11,032)        (23,942)           (22,353)
Income/(loss) before income taxes                    (7,551)          3,823        (10,676)               (708)                                            Q2 2019        Q2 2020
Income taxes                                            (81)           (168)          (174)               (336)
Share of result of joint venture                       (101)           (164)          (140)             (3,205)
Net income/(loss)                                    (7,733)          3,491        (10,990)            (4,249)    Weighted average number of vessels           38.0           38.0
Net income attributable NCI                              —            (483)            —                 (905)    Ownership days                              3,458          3,458
Net income/(loss) attributable to NVGS               (7,733)          3,008        (10,990)             (5,154)   Available days                              3,362          3,414
                                                                                                                  Operating days                              2,866          3,016
EPS attributable to NVGS
    Basic & Diluted                             $     (0.14)   $      0.05     $     (0.20)       $     (0.09)    Fleet utilization                           85.2%          88.3%
                                                                                                                  Average Daily Results:
EBITDA                                          $    23,265    $    33,359     $    50,987        $     55,896    Time charter equivalent rate         $     19,940   $     21,606
Adjusted EBITDA                                 $    23,172    $    31,857     $    50,294        $     56,938    Daily vessel operating expenses      $      7,938   $      7,661

                                                                                              4
                                                                                      Confidential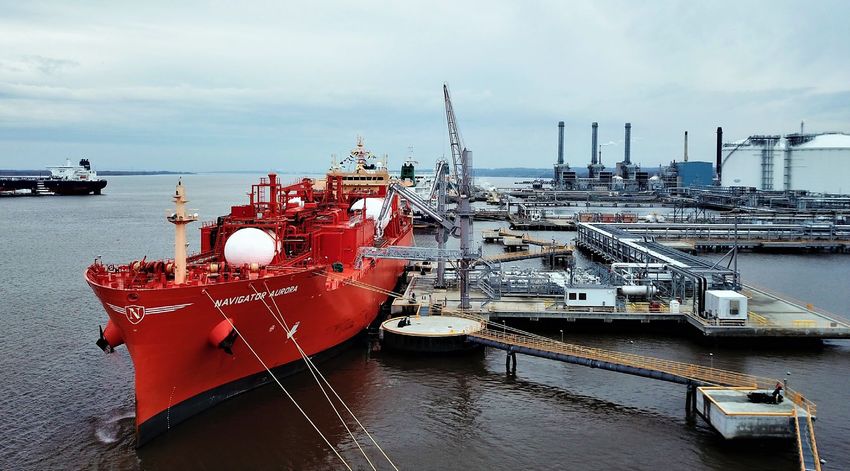
BALANCE SHEET, LEVERAGE AND LIQUIDITY
                   Navigator Holdings Balance Sheet $000’s                                                     June 30th Cash & Liquidity $mm
                                                                                                                                                       $125.3
                                                          Three months ended
                                  Twelve months ended           June 30,                                                                           Cash Collateral,
                                   December 31, 2019              2020                                                                                  $8.2

  Assets                                $ USD                  $ USD

  Cash and cash equivalents                      64,820                 53,082
                                                                                                                                     $30.0              $30.0

  Other current assets                           61,306                 72,556

  Total current assets                          126,126                125,638

  Vessel in operation                      1,609,527                1,574,908

  Investment in Terminal JV                     130,660                135,310
                                                                                                                  $34.0                                 $34.0
  Other assets                                    7,940                 10,533

             Total assets                  1,874,253                1,846,389

  Liabilities & Equity                                                                                                                              Excess Cash,
                                                                                                                                                       $10.0
  Net current portion of debt                    64,703                171,501

  Other current liabilities                      44,803                 48,690

      Total Current Liabilities                 109,506                220,191                 $53.1                                               Minimum cash
                                                                                                                                                    requirement -
  Net long term debt                            812,747                671,518                                                                     Bank covenant,
                                                                                                                                                        $43.1
  Other non-current Liabilities                  12,098                 18,730

  Equity                                        939,902                935,950

  Total liabilities and Equity             1,874,253                1,846,389              Cash equivalent   Undrawn Terminal   Potential vessel      Liquidity
                                                                                                                 True up          refinancing

                                                                                 5
                                                                            Confidential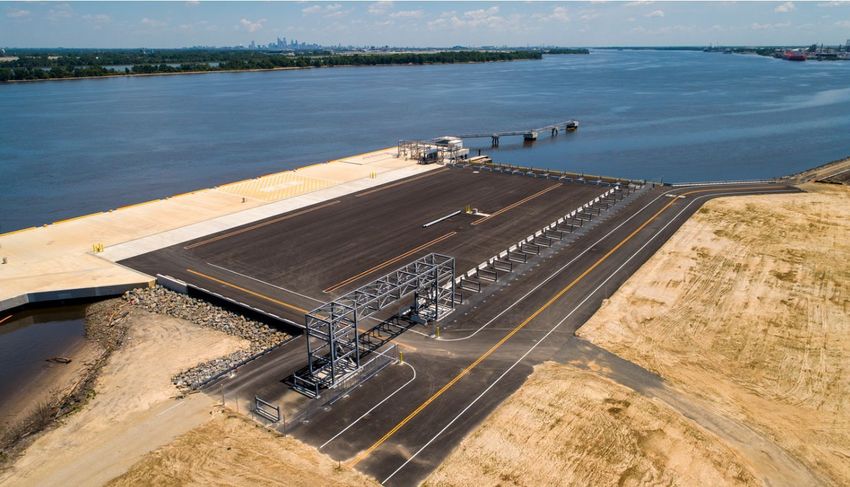
BALANCE SHEET, LEVERAGE AND LIQUIDITY CONTINUED
                 Debt Maturities per year $mm

       US$100 million Bond              US$107 million facility          US$160.8 million facility

       US$278 million facility          US$290 million facility          US$220 million facility

       NOK600 million Bond
                                                                                                            Debt capitalization & LTV levels $mm
                                                                                                                                                        Loan to
                                                                                                             As of June 30, 2020      Actual    Debt
                                                                                                                                                        Value %

                                                                                                        Vessel Net Book Value         1,574.9   861.7     54.7%
                                                                   72
                                                                                                        Broker assessment value adj   (118.3)       -         -
                                                                                                        Broker assessed values        1,456.6   861.7     59.1%
                                                151                                                     Total debt (35 vessels)        861.7
                                                                                                        Total Shareholders’ equity     936.0
                                                                   22
                                                                                                        Total capitalization          1,797.7
                                                                                                        Debt / Capitalization          47.9%
                                                                   31

                                 100

                                                                   66
                                                 50                                                54

2019            2020             2021           2022              2023          2024           2025

                                                                                              6
                                                                                         Confidential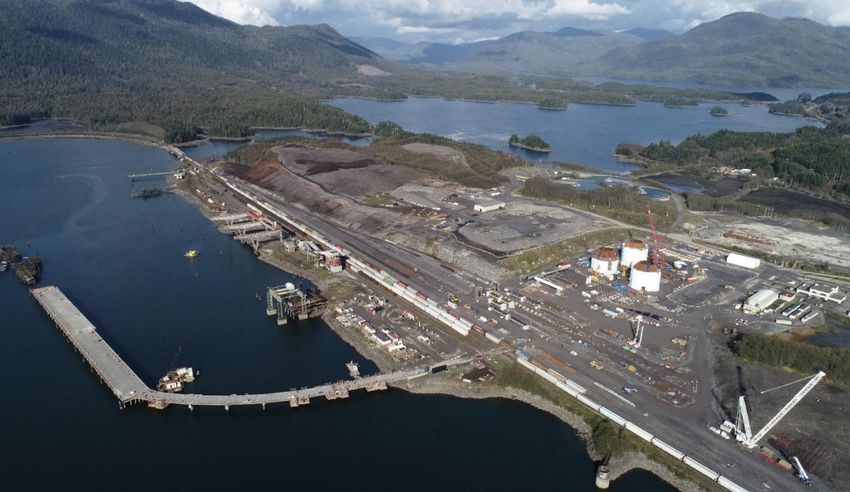
MANAGEMENT INTERVENTIONS
                   Commercial impact                                  Operational impact                              Financial impact

                • Reduction of utilisation / demand         •    Remote working for office staff             • Refinancing of the expiring February
 COVID -19      • Price volatility                          •    Crew safety & wellbeing                       2021 bond
                • Conservative trading by our               •    Dry dockings & vetting delays               • Financial covenant impact due to
 Challenges       customers                                 •    Certification, Audits & DoC                   prolonged Covid-19 pandemic
                                                            •    Logistics

                • Maintaining eco-speed in line with      • Full business continuity management             • Successfully uplifted the terminal facility
                  our customers' expectations               plan in action for offices and vessels            to $69m, with a early true up agreed of
                • Recent ethylene pool to offer more      • Enhanced procedure and riskbased                  $34m in Q3 2020
                  flexibility to our customer and the       management plans for visitors and new           • Refinancing of existing loan facilities to
                  market                                    joiners.                                          generate surplus cash of approx. $30m
                • Constant dialogue with our              • Increased Internet access allowances            • Engaged financial advisors to investigate
Management        customer to fulfil requirements           for crew members.                                 options to refinance the 2021 expiring
                                                                                                              bond
                • Reducing discretionary spend to         • Mental health awareness campaign &
 Mitigations      maintain Company liquidity                increased support from shore teams.             • Alternatives are being considered to
                                                          • Flags state & class have granted                  increase liquidity:
                                                            renewable ~3-month extensions                      • Raising capital with further sale and
                                                            for certification, audit and dry dockings.             leaseback(s)
                                                          • Grouping spares and equipment in                   • Extension on maturity
                                                            major regional hubs closer to vessels.

 Other levers
                  Reduction in non-           Prevention of
                 discretionary spend        unnecessary travel             Recruitment Freeze      Fuel & inventory control        CAPEX reduction

                                                                  7
                                                            Confidential
ETHYLENE TERMINAL 1ST PHASE COMPLETE
Ownership of the world’s largest ethylene terminal – through a JV with Enterprise Product Partners, one the U.S largest mid-stream companies
Navigator Eclipse, world record loading 20,000mts Ethylene
Long term
Exported over Commitment of
commitments taking Take or pay offtake
Delivered safely on 80,000MT tons in June 45,000+ tons per
throughput to 94% of agreements have
time & on budget 2020, 110,000MT month plus spot
the 1 million commenced
exported in 1H2020 volumes
nameplate capacity
8
ConfidentialETHYLENE TERMINAL 2ND PHASE ON TRACK
Throughput
Chiller Capacity Ship Load rate Marine Docks
Capacity
1Mmts +125mts per Up to 1,000mts
Two
throughput hour per hour
Phase 2 expected to be completed in Q4 2020
60,000cbm Ethylene Tank Construction in progress
Scheduled to be on time and on budget
Expected to be fully operational in December 2020
Expected to generate an EBITDA of US$20-25m per
annum post tank completion
9
ConfidentialPROJECTS IMPACTING HANDY SIZE SEGMENTS
2H2020 1H2021
3Q2020: REPAUNO EXPORT TERMINAL, NJ 1Q2021: ETP MARCUS HOOK MEII & ME2X COMPLETION
RAIL-TO-SHIP AMBIENT LPG EXPORT FACILITY CATERING INAUGURAL MEII ETHANE LOADING
FOR SEMI-REFRIGERATED VESSELS ME1 70,000 BPD
~20,000 BPD THROUGHPUT MEII 275,000 BPD
3-4 AMBIENT HANDY LPG CARGOES PER MONTH ME2X 250,000 BPD
4Q 2020 – PHASE 2 - MORGAN’S POINT ETHYLENE EXPORT -
1H 2021: PEMBINA PRINCE RUPERT, BC, EXPORT TERMINAL
1,000,000 MTS P.A
RAIL-TO-STORAGE & SHIP AMBIENT LPG EXPORT FACILITY
CATERING FOR SEMI-REFRIGERATED VESSELS
FULLY REFRIGERATED ETHYLENE ENABLING THROUGHPUT ~25,000 BPD THROUGHPUT
EQUATING TO 6-7 CARGOES PER MONTH 4-5 AMBIENT HANDY LPG CARGOES PER MONTH
10
Confidential15,000-25,000 CBM HANDYSIZE DEMOGRAPHICS AND TC R ATES
LPG Handysize Global Fleet Ethane/Ethylene Global Fleet >15,000 cbm
Existing & Newbuild
Owner Semi Ref. Fully Ref. Total Owner Total
Handysize Midsize VLEC
Navigator Gas 17 6 23 Navigator Gas 10 4 - 14
Ultragas 8 - 8 Evergas - 8 2 10
Naftomar 3 4 7 Solvang 8 - - 8
Beneleux 5 - 5 Reliance - - 6 6
Petredec 2 2 4 Petredec 8 - - 8
Schulte 4 - 4 Pacific Gas 5 - - 5
Stealth Gas 4 - 4 Harpain 4 - - 4
Yara 3 - 3 Hartmann - 3 - 3
Pacific Carriers 3 - 3 Other 3 - - 3
Harpain 1 - 1
Other 13 10 23
Total 63 22 85 Total 38 15 8 60
Handysize market share Delivered On Order Recycling Clarkson 22,000 cbm semi-ref rates
12 $1,200
10 $1,000
8 $800
Assessed TC per month ‘000s
6 $600
28%
4 $400
No. Ships
2 $200
0 $0
7%
-2 -$200
7%
7% -4 -$400
-6 -$600
* Handysize FR/SR/ETH vessels on the water Source: Fearnleys, Clarksons 2020
11
ConfidentialYou can also read