VARTA AG 9M 2019 Earnings Presentation October 29, 2019
←
→
Page content transcription
If your browser does not render page correctly, please read the page content below
VARTA AG
9M 2019 Earnings Presentation

October 29, 2019
                                Companies of VARTA AG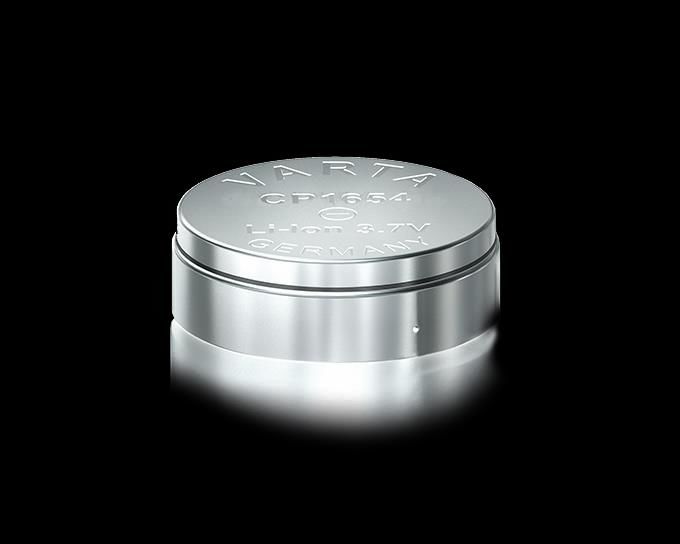
Disclaimer
  Forward-Looking Statements
  This document has been prepared solely by VARTA AG (“VARTA”) and it and the presentation to which it relates contains confidential
  information relating to VARTA AG and is being given to you on a confidential basis. The information is for information purposes only and may
  not be redistributed, reproduced, published, or passed on to any other person or used in whole or in part for any other purpose.
  Certain information in this presentation is based on management estimates. Such estimates have been made in good faith and represent the
  current beliefs of applicable members of management. Estimates may not be correct or complete. Accordingly, no representation or warranty
  (express or implied) is given that such estimates are correct or complete.
  Certain statements contained herein may be statements of future expectations and other forward-looking statements that are based on
  VARTA’s current views and assumptions and involve known and unknown risks and uncertainties that may cause actual results, performance
  or events to differ materially from those expressed or implied in such statements. No one undertakes to publicly update or revise any such
  forward-looking statement. Neither VARTA and its advisers, personally liable partners, employees or affiliates nor any other person shall
  assume or accept any responsibility, obligation or liability whatsoever (in negligence or otherwise) for any loss howsoever arising from any
  use of this presentation or the statements contained herein as to third person statements, any statements of future expectations and other
  forward-looking statements, or the fairness, accuracy, completeness or correctness of statements contained herein. In giving this
  presentation, VARTA does not undertake any obligation to provide the recipient with access to any additional information or to update this
  presentation or any information or to correct any inaccuracies in any such information.

  Non-IFRS Financial Measures
  This presentation contains certain financial measures (including forward-looking measures) that are not calculated in accordance with IFRS
  and are therefore considered as “Non-IFRS financial measures”. The management of VARTA believes that the Non-IFRS financial measures
  used by VARTA, when considered in conjunction with (but not in lieu of) other measures that are computed in accordance with IFRS,
  enhance an understanding of VARTA's results of operations, financial position or cash flows. These Non-IFRS financial measures should not
  be considered in isolation as a measure of VARTA's profitability or liquidity, and should be considered in addition to, rather than as a
  substitute for, net income and the other income or cash flow data prepared in accordance with IFRS.
  In particular, there are material limitations associated with our use of Non-IFRS financial measures, including the limitations inherent in our
  determination of each of the relevant adjustments. The Non-IFRS financial measures used by VARTA may differ from, and not be
  comparable to, similarly-titled measures used by other companies.
  Certain numerical data, financial information and market data (including percentages) in this presentation have been rounded according to
  established commercial standards. As a result, the aggregate amounts (sum totals or interim totals or differences or if numbers are put in
  relation) in this presentation may not correspond in all cases to the amounts contained in the underlying (unrounded) figures appearing in the
  consolidated financial statements. Furthermore, in tables and charts, these rounded figures may not add up exactly to the totals contained in
  the respective tables and charts.

Companies of VARTA AG                                                                                 Our Brands                                    2
Executive Summary 9M 2019
Further accelerating the high pace of revenue and earnings growth –
delivered very strong 9M results, further improving the profitability
Revenue +22%... Adj. EBITDA +67%... Adj. EBITDA margin at 25.9% (+6.9PP)
Microbatteries with exceptionally strong 3Q and 9M results
Entertainment is booming and further accelerating the very high growth momentum –
Healthcare continues to grow faster than the market
Power & Energy continues to trend in line with expectations
Revenue continues to increase sequentially, with 2H stronger than 1H –
Adj. EBITDA margin in line with the mid-term margin target of 6-8% of revenue
Further expansion of the production capacities for lithium-ion batteries
Increasing the capacities to >150m cells p.a. 2022 (previously: >100m cells by 2020) –
requires an additional investment of ~€130m (for additional ~50m cells per year)
Raising again the revenue and Adj. EBITDA guidance for FY19:
Revenue: ~€330-340m (previously: €320-330m), up ~21-25% YoY*
Adjusted EBITDA: ~€84-88m (previously: €72-76m) , up ~67-75% YoY*
* 2019 guidance assumes constant FX and organic growth
Companies of VARTA AG Our Brands 3Business Highlights 9M 2019
We continue to accelerate the high revenue and earnings growth momentum
End-market for premium true wireless headsets is booming, with many new
Entertainment
premium headsets being recently launched
is accelerating
the very high VARTA AG is benefiting the most from the structural shift to coin-shaped cells
growth Successful design-ins with all premium headset manufacturers
momentum On track to achieve the #1 market position, with a market share of >50% by 2020
Further expansion of the production capacities to >150m cells by 2022
Continuing to grow faster than the market in hearing aid batteries
Healthcare is
Gaining market share in primary hearing aid batteries – ramping-up the largest
growing
mass retail account for hearing aid batteries in the US (#1 market positon in the US)
faster
than the We are a strongly benefiting from the growing market share of rechargeable
market hearing aid batteries, being the market and technology leader –
rechargeable hearing aid batteries offer attractive margin opportunities
Revenue continuing to increase sequentially, with 2H stronger than 1H
Power & Battery packs (PPS) continuing to gain traction due to the ramp-up of new
Energy is customer projects (i.e. packs for the new wireless hand vacuum cleaner from Miele)
trending
Energy storage solutions keeping the solid growth momentum, particularly in
in line with
residential storage
expectations
Delivered an Adj. EBITDA margin of 6%, in line with the mid-term margin target
Closing of Consumer acquisition expected on January 02, 2020*
* The closing of the transaction is subject to the approval of the
Companies of VARTA AG European Commission and the fulfilment of customary conditions Our Brands 4
precedent, including antitrust clearanceFinancial Highlights 9M 2019
Delivered very strong Q3 and 9M results –
further accelerating the high pace of revenue and earnings growth:
Q3: Revenue +34%... Adj. EBITDA +88%... Adj. EBITDA margin at 28.2% (+8.1PP)
9M: Revenue +22%... Adj. EBITDA +67%... Adj. EBITDA margin at 25.9% (+6.9PP)
Microbatteries with exceptionally strong Q3 and 1H results:
Q3: Revenue +38%... Adj. EBITDA +109%... Adj. EBITDA margin at 33.1% (+11.1PP)
9M: Revenue +26%... Adj. EBITDA +72%... Adj. EBITDA margin at 30.1% (+8.1PP)
Power & Energy continues to trend in line with expectations –
Revenue +9% (Q3: +17%) – Adj. EBITDA at 5.7%, in line with the mid-term target
CAPEX were at €67.9m, continuing to massively expand the production capacities
in lithium-ion-batteries – executing the investment program flawlessly
Received further customer pre-payments of €19.7m in the Entertainment
business in Q3 – support the funding of the production capacity expansion for the
benefit of secured capacity
Companies of VARTA AG Our Brands 5Financial Performance 9M 2019
Revenue Adjusted EBITDA Net Income
(€ m) (€ m), margin in % of revenue (€ m)
+22%
242.8
198.9*
+67%
63.0 +66%
33.0
37.8*
19.9*
19.0% 25.9%
Margin Margin
9M 2018 9M 2019 9M 2018 9M 2018 9M 2018 9M 2019
* Changes to the previous year's figures due to conversion to IFRS 15
Companies of VARTA AG Our Brands
Brands 6Financial Performance 9M 2019 (continued)
Net Working Capital (NWC) CAPEX Free Cash Flow
(€ m), in % of LTM revenue (€ m) (€ m)
-29%
42.0
+86%
29.6 67.9
+11%
36.5
15.4% 9,4%
Revenue Revenue -26,2 -23,4
Dec 2018 Sep 2019 9M 2018 9M 2019 9M 2018 9M 2019
Companies of VARTA AG Our Brands
Brands 7Microbatteries – 9M 2019 Highlights
(€ m) 9M 2018 9M 2019 YoY Change
Revenue 160.5* 201.5 +25.5%
Adjusted EBITDA 35.3* 60.7 +72.0%
Adjusted EBITDA Margin 22.0% 30.1% +8.1PP
*Changes to the previous year's figures due to conversion to IFRS 15
Highlights:
Microbatteries recorded very strong Q3 and 9M results –
the strongest revenue and adj. EBITDA in a quarter ever
Entertainment is accelerating the very high growth momentum,
backed by a booming end-market for true wireless headsets;
continuously ramping-up new customer projects
Healthcare is continuing to grow faster than the market,
gaining market share in primary batteries and benefiting from
the trend to rechargeable hearing aids
Rechargeable lithium-ion coin cell
Adj. EBITDA margin at 30.1%, an improvement of 8.1PP – for premium true wireless
key drivers: operating leverage, economies of scale and a headsets
favorable margin mix effect from lithium-ion batteries
Companies of VARTA AG Our Brands
Brands 8Power & Energy – 9M 2019 Highlights
(€ m) 9M 2018 9M 2019 YoY Change
Revenue 37.7* 40.9 +8.5%
Adjusted EBITDA 2.6* 2.3 -9.2%
Adjusted EBITDA Margin 6.8% 5.7% -0.5PP
*Changes to the previous year's figures due to conversion to IFRS 15
Highlights:
Power & Energy continuing to trend in line with expectations
Q3 revenue increased by 20% sequentially vs. Q2, and was up
17% Y/Y in 2Q – H2 expected to be stronger than H1
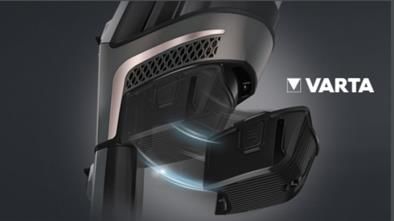
Battery packs (PPS) continuing to gain traction due to the ramp-up
of new customer projects (i.e. packs for the new wireless hand
vacuum cleaner from Miele)
Energy storage solutions keeping the solid growth momentum,
particularly in residential storage
Miele Triflex HX1 - Powered
Delivered an Adj. EBITDA margin of 5.7%, essentially in line with by VARTA. Miele launched
their first wireless handheld
the mid-term Adj. EBITDA margin target of 6-8% of revenue vacuum cleaner
*Changes to the previous year's figures due to conversion to IFRS 15
Companies of VARTA AG Our Brands
Brands 9Raising again the revenue and Adj. EBITDA
guidance* for FY19
• Revenue: ~€330-340m (previously: ~€320-330m), up ~21-25% YoY*
• Adjusted EBITDA: ~€84-88m (previously: ~€72-76m), up ~67-75% YoY*
VARTA AG
Group • CAPEX: ~€95-110m (previously: ~75-90m) – continuing to expand the
production capacities in lithium-ion batteries to >150m cells p.a. by 2022
(previously: >100m cells p.a. by 2020)
• Revenue: Clear double-digit growth – significantly outpacing the market
growth
Segment
Microbatteries • Adjusted EBITDA: Very strong Adj. EBITDA growth, with a significantly
faster growth rate than the revenue
• Revenue: Double-digit growth – in-line with the market growth
Segment • Adjusted EBITDA: Significant positive Adjusted EBITDA, in-line with the
Power & Energy mid-term margin target of 6-8% of revenue
* 2019 guidance assumes constant FX and organic growth
Companies of VARTA AG Our Brands 10Summary
Further accelerating the high pace of revenue and earnings growth –
delivered very strong 9M results, further improving the profitability
Microbatteries with exceptionally strong 3Q and 9M results
Entertainment is booming and further accelerating the high growth momentum
– Healthcare continues to grow faster than the market
Power & Energy continues to trend in line with expectations
Further expansion of the production capacities for lithium-ion batteries to
more than 150m cells per year by 2022
Raising again the revenue and Adj. EBITDA guidance for FY19:
Revenue: ~€330-340m (previously: €320-330m), up ~21-25% YoY*
Adjusted EBITDA: ~€84-88m (previously: €72-76m) , up ~67-75% YoY*
* 2019 guidance assumes constant FX and organic growth
Companies of VARTA AG Our Brands 11Contact Investor Relations Financial Calendar
Bernhard Wolf 18.02.2020 Preliminary Figures FY2019
Head of Investor Relations 31.03.2020 Final Figures FY2019
15.05.2020 Interim Statement Q1 2020
Daimlerstraße 1 14.08.2020 Half-Year Report 2020
73479 Ellwangen 12.11.2020 Interim Statement Q3 2020
Phone: +49 79 61 921 969
E-Mail: bernhard.wolf@varta-ag.com
Companies of VARTA AG Our Brands 12VARTA AG – Selected group key figures
(in EUR million) 9M 2019 9M 2018
Sales Revenue 242.8 198.9*
EBITDA 61.0 36.2*
Adjustments:
Cost of share-based payment 2.0 1.6
Adjusted EBITDA 63.0 37.8*
Adjusted EBITDA Margin (%) 25.9% 19.0%
Consolidated result 33.0 19.9*
Investments (Capex) 67.9 36.5
Free Cash Flow -23.4 -26.2
Equity ratio (%) 64.8% 64.6%**
Balance sheet total 612.860 401.696**
Staff (as of September 30) 2,613 2,272
* Changes to the previous year's figures due to conversion to IFRS 15
** as per 31.12.2018
Companies of VARTA AG Our Brands 13Consolidated income statement for the
period 01/01/ - 09/30/2019
(in EUR thousand) 9M 2019 9M 2018
Sales revenue 242,764 198,947*
Increase in finished and unfinished
6,597 3,826
goods
Own work capitalized 3,269 2,092
Other operating income 5,912 4,890
Cost of materials -83,883 -75,930*
Personnel expenses -81,122 -69,012
Other operating expenses -32,544 -28,581
EBITDA 60,993 36,232*
Depreciation and amortization -12,657 -7,600
Operating earnings (EBIT) 48,336 28,632*
Financial income 273 103
Financial expenses -575 -309
Sundry financial income 183 363
Sundry financial expenses -1,674 -552
Financial result -1,793 -395
Profit and loss shares in companies
recognized in the balance sheet under -6 151
the equity method
Earnings before taxes 46,537 28,388*
Income tax expenses -13,569 -8,534*
Consolidated result 32,968 19,854*
Appropriation of profit:
Shareholders of VARTA AG 32,773 19,550*
Non-controlling interests 195 304
* Changes to 2018 figures due to conversion to IFRS 15
Companies of VARTA AG Our Brands 14Consolidated statement of financial
position as of September 30, 2019 (1/2)
(in EUR thousand) Sep. 30, 2019 Dec. 31, 2018
ASSETS
Property, plant and equipment* 206,575 112,803
Intangible assets* 20,791 21,174
Long-term investments and other participations recognized in
56 348
the balance sheet under the equity method
Other financial assets 578 359
Deferred tax assets 3,764 1,477
Other assets 18,750 15,670
Non-current assets 250,514 151,831
Inventories 74,149 56,699
Contract assets 1,882 2,370
Trade receivables and advanced payments 42,372 26,345
Tax refund claims 123 549
Other assets 18,276 14,161
Cash and cash equivalents 225,544 149,741
Current assets 362,346 249,865
Total assets 612,860 401,696
*Rights of use pursuant to IFRS 16 were allocated to the respective balance sheet items in which the underlying
assets would also be shown if they were the property of the VARTA AG Group.
Companies of VARTA AG Our Brands 15Consolidated statement of financial
position as of September 30, 2019 (2/2)
(in EUR thousand) Sep. 30, 2019 Dec. 31, 2018
EQUITY AND LIABILITIES
Subscribed capital 40,422 38,200
Capital reserve 251,429 149,374
Retained earnings 66,334 41,627
Net income 32,774 25,260
Other reserves 4,579 3,535
Equity of the VARTA AG Group 395,538 257,996
Non-controlling interests 1,622 1,426
Equity 397,160 259,422
Lease liabilities (IFRS 16) 18,093 0
Other financial liabilities 6,281 6,200
Provisions for employee benefits 29,129 23,639
Advance payments received 16,143 30,247
Other liabilities 114 93
Other provisions 618 243
Non-current liabilities 70,378 60,422
Tax liabilities 11,845 7,261
Lease liabilities (IFRS 16) 3,887 0
Other financial liabilities 4,364 2,720
Provisions for employee benefits 1,067 1,048
Contract liabilities 11,987 8,435
Trade payables and advance payments received 76,813 35,021
Other liabilities 12,792 11,018
Other provisions 6,421 4,304
Deferred liabilities 16,146 12,045
Current liabilities 145,322 81,852
Liabilities 215,700 142,274
Equity and total liabilities 612,860 401,696
Companies of VARTA AG Our Brands 16Cash flow statement for the
period 01/01/-09/30/2019
(in EUR thousand) 9M 2019 9M 2018
Cash and cash equivalents as at January 1 149,741 138,536
Cash flow from ongoing business activities 46,289 10,769*
Cash flow from investment activities -69,661 -37,014*
Cash flow from financing activities 98,470 156
Net change in cash and cash equivalents 75,098 -26,089
Effects of exchange rate fluctuations 705 222
Cash and cash equivalents as at June 30 225,544 112,669
• The disclosure of cash outflows from capitalisation of internal labour was adjusted in the previous yearʼs comparative column in
accordance with IAS 8.41 and has been shown in cash flow from investing activities since fiscal year 2019.
Companies of VARTA AG Our Brands 17You can also read