Investors Presentation January 2021 - Dr. Stephan Meeder, CEO+CFO Heike Baumbach, Head of Investor Relations - CropEnergies

Page created by Kenneth Holland
 
CONTINUE READING
Investors Presentation January 2021 - Dr. Stephan Meeder, CEO+CFO Heike Baumbach, Head of Investor Relations - CropEnergies
Investors Presentation
          January 2021
          Dr. Stephan Meeder, CEO+CFO
Heike Baumbach, Head of Investor Relations
Investors Presentation January 2021 - Dr. Stephan Meeder, CEO+CFO Heike Baumbach, Head of Investor Relations - CropEnergies
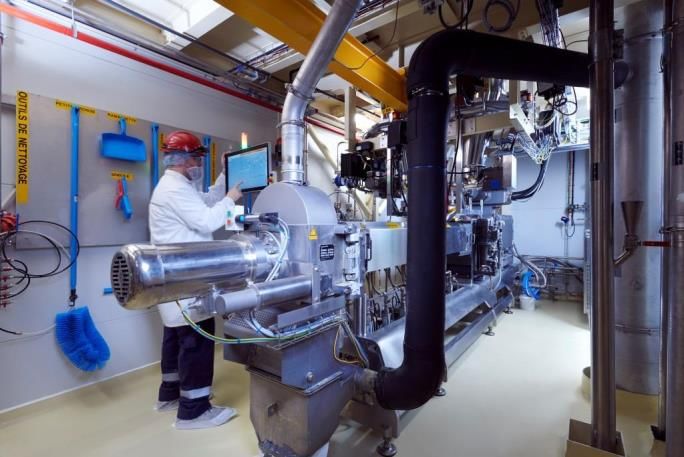
Two challenges of our times

 GHG emissions: worldwide >50 bn. t CO2eq./a         Corona: worldwide more than 90 million infected
                                                                                                                   As of 13 January 2021

                                       Source: EEA             Source: https://www.worldometers.info/coronavirus/worldwide-graphs/#total-cases

                                                                              CropEnergies AG, January 2021                                  2
Investors Presentation January 2021 - Dr. Stephan Meeder, CEO+CFO Heike Baumbach, Head of Investor Relations - CropEnergies
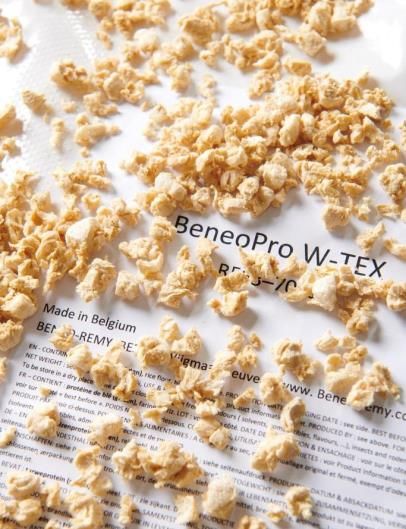
Ethanol – important element to decarbonize
the transport sector

                                          High-quality fuel
   Domestic
                                           which can be
 renewable raw
                                           used in petrol
    materials
                                              engines

                  Climate-friendly fuel
                 produced sustainably

                                                CropEnergies AG, January 2021   3
Investors Presentation January 2021 - Dr. Stephan Meeder, CEO+CFO Heike Baumbach, Head of Investor Relations - CropEnergies
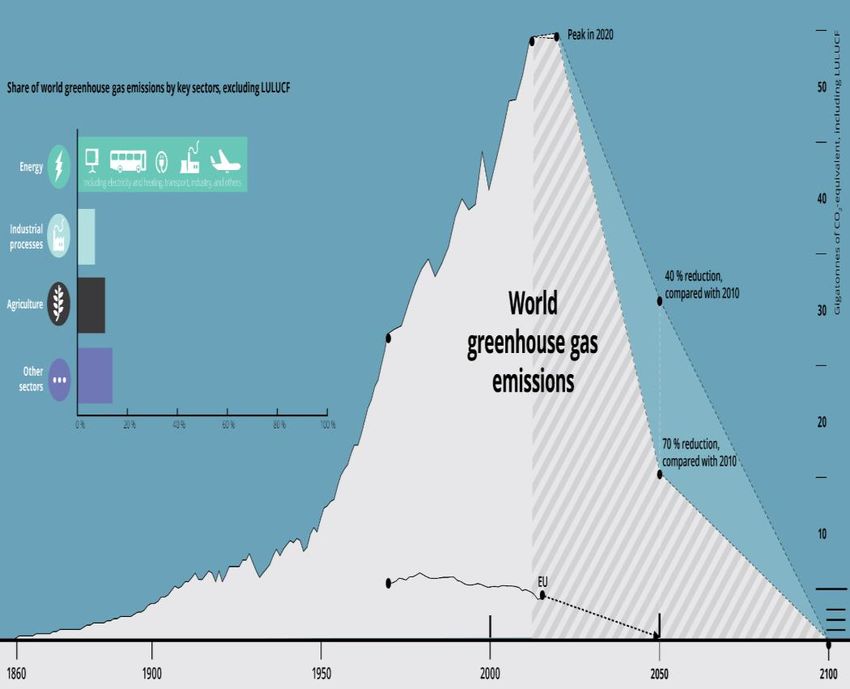
Ethanol: 70% less GHG emissions compared
to fossil fuels*

◼ The GHG values of all elements in the value-added chain are added up
◼ The emissions from ethanol when used in combustion engines is zero
◼ European ethanol reduces annual GHG emissions by >10 Mt**

     Cultivation                       Transport    Ethanol      Ethanol        CO2
       Grain                             Grain     Production   Transport   Liquefaction

  *83,8 gCO2eq/MJ **Own calculations

                                                                                           CropEnergies AG, January 2021   4
Investors Presentation January 2021 - Dr. Stephan Meeder, CEO+CFO Heike Baumbach, Head of Investor Relations - CropEnergies
Renewable ethanol – advantages

▪ Ethanol…                                                                                    Blending
     ▪ As direct blend to petrol (e.g. E5, E10, E85)
                                                                                                  Ethanol
     ▪ As component in ETBE (octane booster)
                                                                                                   Petrol

▪ E10 reduces CO2, NOx and particulate matter                                               E5 E10 E20 E85
     ▪ WLTP* benchmark, label in tank flap of all new cars
     ▪ Potential savings (EU): >20 Mt CO2eq (8 million less cars on the road)

▪ Potential for 20% ethanol blending (Super E20)
     ▪ Potential savings: >40 Mt CO2eq (16 million less cars on the road)
     ▪ Successful racing results (Porsche/Nürburgring)
     ▪ Technical analysis for standardisation initiated

  *Worldwide harmonized light-duty vehicle test

                                                                                CropEnergies AG, January 2021   5
Investors Presentation January 2021 - Dr. Stephan Meeder, CEO+CFO Heike Baumbach, Head of Investor Relations - CropEnergies
Our co-products: Food and Fuel

▪ Raw materials are utilized completely

▪ Concept of co-production

           Vital Wheat Gluten                 ProtiGrain® – DDGS
               Valuable protein product for      High protein animal feed
               food and animal feed              from dried stillage
               industry

           Food-grade liquefied CO2           ProtiWanze® – CDS
               For food and beverages            Liquid protein animal feed
               industries                        from stillage

                                                                       CropEnergies AG, January 2021   6
Investors Presentation January 2021 - Dr. Stephan Meeder, CEO+CFO Heike Baumbach, Head of Investor Relations - CropEnergies
The ethanol markets

▪ World production                                                                     ▪ EU & UK production
      ▪ 2020e: 119 million m3 (-8%)                                                        ▪ 2020e: 7.3 million m3 (-4%)
              ▪ Fuel applications: 99 million m³ (-9%)                                         ▪ Fuel applications: 5.0 million m³ (-7%)
      ▪ 2021e: 125 million m3 (+6%)                                                        ▪ 2021e: 7.6 million m3 (+4%)
              ▪ Fuel applications: 105 million m³ (+6%)                                        ▪ Fuel applications: 5.3 million m³ (+6%)

               World production of ethanol [M m3]                                                    EU production of ethanol [M m3]
140                                                                                       8

120
                                                                                          6
100

 80
                                                             Source: FO Licht (2020)      4

                                                                                                                                                  Source: FO Licht (2020)
 60

 40
                                                                                          2
 20

       2016      2017     2018      2019     2020e   2021e                                    2016   2017     2018      2019     2020e    2021e

                  USA   Brasil   EU & UK   other                                                              fuel   non-fuel
                                                                                                                                CropEnergies AG, January 2021               7
Investors Presentation January 2021 - Dr. Stephan Meeder, CEO+CFO Heike Baumbach, Head of Investor Relations - CropEnergies
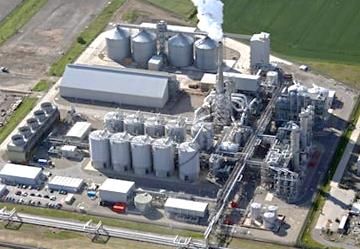
Market development: volumes

                                                                                              EU27 & UK: ethanol sales [1,000 m3]
▪ Ethanol market in the EU27 & UK in 2020 (in million m³)                             ,
                                                                                     9.000     8,135      8,312           7,955         8,432
                                                                                                970        982                            942
    ▪ Consumption:     8.0   -4%     (5.1 fuel | 2.9 non-fuel)                                 1,634      1,668
                                                                                                                           945
                                                                                                                                        1,950
                                                                                                                          1,950
    ▪ Production:      6.9   -7%     (4.5 fuel | 2.4 non-fuel)                        ,
                                                                                     4.500
                                                                                               5,531      5,662           5,060         5,540
    ▪ Corona crisis 2020: fuel drops, disinfectants (industrial) increase
                                                                                        0
    ▪ Outlook 2021: recovery in fuels expected, demand for industrial remains high             2018        2019       2020               2021
                                                                                              Fuel  Industrial  Potable
                                                                                                                          Source: IHS Markit (2020)

▪ Mobility and modal split change due to Corona                                          Fuel ethanol: changes in consumption
                                                                                                 and price development
                                                                                     70%                                                        850
    ▪ Increase in private transport vs. public transport                                                   ∆ EU & UK
                                                                                                           ∆ DE
                                                                                     35%                                                        750
    ▪ Petrol consumption drops again due to mobility restrictions                                          ∆ FR
                                                                                                           ᴓ EtOH price
                                                                                      0%                                                        650
    ▪ Uncertainty how mobility will develop
                                                                                     -35%                                                       550

                                                                                     -70%                                                       450
                                                                                             Jan Feb Mar Apr May Jun Jul Aug Sep
                                                                                                                  Source: Eurostat, Nymex (2021)

                                                                                      CropEnergies AG, January 2021                          8
Investors Presentation January 2021 - Dr. Stephan Meeder, CEO+CFO Heike Baumbach, Head of Investor Relations - CropEnergies
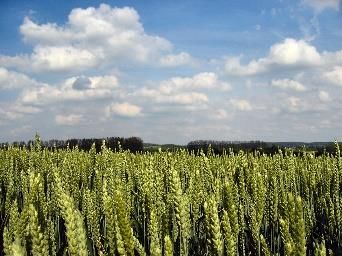
Market development: prices

                                                                                       European ethanol prices [€/m³]
▪ EU Ethanol: all time high followed by big fall in prices*                    850

    ▪ All time high of € 840 /m³ in September
    ▪ Average in September above € 800 /m³ for the first time                  600

    ▪ Average in Q3: € 665 (603) /m³
    ▪ Afterwards significant price drop in December to € 519 /m³                        FY 18/19     FY 19/20     FY 20/21
                                                                               350
    ▪ Uncertainty due to COVID-19 and higher imports puts pressure on prices

                                                                                         Euronext Paris wheat [€/t]
                                                                               250
▪ Feedstock markets 2020/21
    ▪ Grain prices increased in Q3**: € 202 (188) /t
    ▪ EU27 grain harvest expected to decrease to 271 (294) Mt                  175

    ▪ Still comfortable supply situation – production exceeds consumption
                                                                                        FY 18/19     FY 19/20     FY 20/21
                                                                               100

   * T2 FOB Rdam   ** Wheat (Euronext), next expiry

                                                                               CropEnergies AG, January 2021             9
Investors Presentation January 2021 - Dr. Stephan Meeder, CEO+CFO Heike Baumbach, Head of Investor Relations - CropEnergies
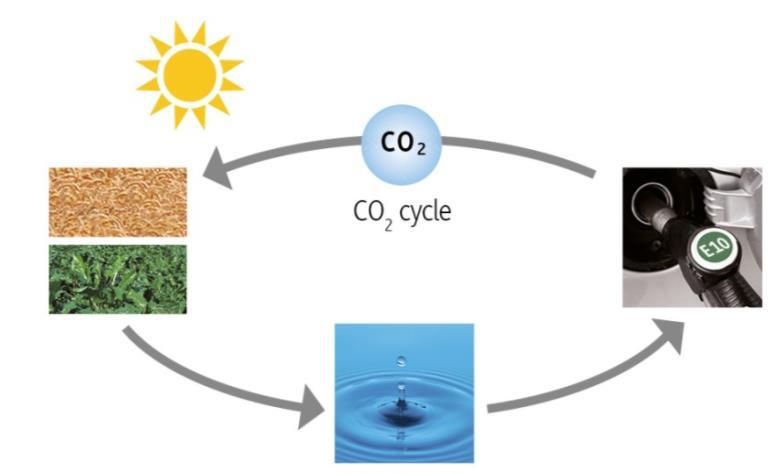
EU policies: overview

  Overall target for emissions reduction vs. 1990:
      min. 20% by 2020, min. 40% by 2030*
                           ETS Sectors                                     Non-ETS Sectors
                    emissions reduction vs. 2005                       emissions reduction vs 2005
                              Min 21% by 2020                                   Min 9.3% by 2020
                              Min 43% by 2030                                   Min 30% by 2030

       Effort Sharing
                     Transport
                                                         Transport (fuels) policies
                                                  Clean Energy
                                                     Package
                    Agriculture                                                                   Clean Mobility
                                                     RED I & II                                     Packages
                                                10% RES-T by 2020                              CO2 for cars and vans
                       Waste                    14% RES-T by 2030     Fuel Quality Directive
                                                                                                  CO2 for trucks
                                                 Advanced biofuels    -6% GHG intensity of
                                                                     transport fuels by 2020      Clean Vehicles
                                                     mandates                                        Directive
                     Buildings
                                                   Energy Union                                  Alternative Fuels
                                                   Governance                                        Directive
                  Part of Industry               National Energy &
                                                   Climate Plans

 *Discussions ongoing to raise the ambition to 50-55% by 2030

                                                                                                                       CropEnergies AG, January 2021   10
Renewable Energy Directive-II: the “toolbox“

  Arable crops               Annex IX-A                Annex IX-B                Electricity

◼ 2020 level, max. 7%     ◼ Min. 0.2% in 2022       ◼ Max. 1.7%, but still   ◼ Important component
◼ Local, sustainable      ◼ Min. 1.0 % in 2025
                                                      x2 versus today          in the future
                                                    ◼ UCO imports: 10x       ◼ But: discretionary
◼ Proteins                ◼ At least 3.5% in 2030
                                                      within last 10 years     multiplier (x4) does not
◼ Commitment to 1G        ◼ Strong market                                      save a single gram of
                                                    ◼ Compatibility with
  as reliable basis for     potential                                          CO2
  low-emission                                        law on waste needs
                          ◼ Very capital intense      to be ensured          ◼ Extension only
  transport sector
  necessary                                                                    reasonable if
                          ◼ Investment security                                additional green
                            and investment                                     electricity will be
                            incentives decisive                                produced

                                                                                                     CropEnergies AG, January 2021   11
Strategy of the CropEnergies Group

▪ Our strategy: bio-based products for a climate friendly world
    ▪ Climate change remains challenge: GHG targets become more ambitious
    ▪ Climate protection “Made in Europe”
    ▪ Short-term focus: optimisation of our sites
    ▪ Mid-term: diversification under investigation

▪ BioWanze: Investments in climate neutral production move forward
    ▪ New biomass boiler – commissioning planned in 2023
    ▪ New CO2 liquefaction plant in cooperation with SOL-group – start in 2021

                                                                                 CropEnergies AG, January 2021   12
Appendix

           CropEnergies AG, January 2021   13
Wheat proteins as meat alternative

▪ BeneoPro W-Tex as meat alternative
     ▪ Investment in the amount of € 4.3 million by sister company Beneo
     ▪ Start of operation: 1st March 2019
     ▪ Replacement of meat in products such as burgers, nuggets and bolognese
     ▪ Facility is operated by BioWanze
     ▪ Sales are concluded by Beneo

▪ Trend: meat replacement
     ▪ Growing demand for plant-based proteins worldwide
     ▪ Average annual growth rate of 5.5%* expected in Europe in the next 5 years

  *Global Data Market Analyzer

                                                                                    CropEnergies AG, January 2021   14
The production sites of CropEnergies AG

                                                                       CropEnergies AG
                                                                        Mannheim - Germany

       Zeitz – Germany                                 Wanze – Belgium                       Loon-Plage – France                             Wilton – UK
 CropEnergies Bioethanol GmbH                           BioWanze SA                           Ryssen Alcools SAS                             Ensus UK Ltd.

Annual capacity:                              Annual capacity:                        Annual capacity:                            Annual capacity:

400,000 m³ ethanol                            300,000 m³ ethanol                      >100,000 m³ ethanol for fuel applications   400,000 m³ ethanol
thereof up to 60,000 m3 neutral alcohol       >60,000 t wheat gluten                   90,000 m³ ethanol for traditional and      350,000 t DDGS
>300,000 t ProtiGrain® (DDGS)                 >400,000 t ProtiWanze®                  technical applications
100,000 t liquefied CO2

Raw materials: grain and sugar syrups         Raw materials: wheat and sugar syrups   Raw material: raw alcohol                   Raw material: grain

                                                                                      Ethanol for traditional &
       ProtiGrain®                        Gluten                 Ethanol as Fuel                                           ProtiWanze®               Liquefied carbon
                                                                                       technical applications                                            dioxide

   Capacity: more than 1.3 million m³ ethanol and more than 1 million tonnes food and animal feed per year

                                                                                                                                                        CropEnergies AG, January 2021   15
Q3 2020/21 & Outlook

                       CropEnergies AG, January 2021   16
Overview 3rd quarter 2020/21

▪ Ethanol production            272 (250) ,000 m³                                + 9%
▪ Revenues                      € 226 (220) million                              + 3%

▪ EBITDA                       € 38.6 (37.0) million                  + € 2 million
▪ Operating profit             € 28.7 (26.6) million                  + € 2 million
▪ Net earnings                 € 22.0 (18.4) million                  + € 4 million

                                                 CropEnergies AG, January 2021    17
Operating profit

                                                                                                            Revenues / Production
                                                                                                               [M€ / 1,000 m3]
                                                                                                    400
   (in € million)                                 Q3 20/21       Q3 19/20      Δ
                                                                                                    300         273                  272
   Revenues                                            226.0          220.0    + 3%                       250                255
                                                                                                                       208
   Overall performance                                 232.6          216.8    + 7%
                                                                                                    200   220   232          229     226
   Cost of materials*                                  -170.1         -157.0   - 8%
                                                                                                                       171
   Gross profit                                         62.5           59.7    + 5%                 100

      in % of overall performance                      26.9%          27.6%        -
                                                                                                      0
   Further operating expenses/income*                   -23.9          -22.7   - 5%                        Q3    Q4    Q1    Q2    Q3
                                                                                                          19/20 19/20 20/21 20/21 20/21
   EBITDA*                                              38.6            37.0
                                                                         0.0   + 4%
                                                                                 0%
   Depreciation*                                        -9.9           -10.4   + 5%                          Operating profit [M€]
                                                 0.0            0.0                                  50
                                                                                                                             43
   Operating profit                                     28.7           26.6    + 8%                  40
                                                                                                                 34
*without restructuring costs and special items
                                                                                                                                     29
                                                                                                     30    27

◼ Slight increase in gross profit                                                                    20

         ◼ Higher sales prices for ethanol compensated for higher raw material                       10                8
               costs and lower sales prices for food and animal feed products
                                                                                                      0
                                                                                                           Q3    Q4    Q1    Q2    Q3
                                                                                                          19/20 19/20 20/21 20/21 20/21

                                                                                       CropEnergies AG, January 2021               18
Cash flow

                                                                                                            Cash flow (+)/
                                                                                                         Investments* (-) [M€]
                                                                                                120
 (in € million)                                 9M 20/21     9M 19/20        Δ
                                                                                                        81              86
 Cash flow                                           86.4         80.7     + 5.7                 80
 Change in net working capital                       19.1         15.3     + 3.8

                                                                                                                                   *excl. financial investments
                                                                                                 40
 Net cash flow from operating activities            105.5         96.0     + 9.5
 Investments in property, plant et al.              -17.9        -19.6     + 1.7
                                                                                                  0
 Increase / decrease in financial receivables       -62.3        -36.5    - 25.8
                                                                                                             -20             -18
 Payments into current financial investments          0.0        -15.0    + 15.0                -40
                                                                                                          9M              9M
 Cash flow from investing activities                -80.2        -71.1     - 9.1                         19/20           20/21
 Cash flow from financing activities                -28.1        -15.7    - 12.4
                                                                                                      Net financial assets [M€]
 Exchange rate changes                                -0.1         1.5     - 1.6               200
                                                                                                                             165
 Change in cash and cash equivalents                  -3.0        10.7    - 13.7
                                                                                               150

                                                30/11/2020   30/11/2019      Δ
                                                                                               100                 90
 Net financial assets                               164.7         89.7    + 75.0
                                                                                                        56
                                                                                                50
◼ High cash outflow from increase in financial receivables
◼ Net financial assets rose to € 164.7 (89.7) million                                            0
                                                                                                      30/11/18 30/11/19 30/11/20

                                                                                   CropEnergies AG, January 2021             19
Cash flow

                                                                                                            Cash flow (+)/
                                                                                                         Investments* (-) [M€]
                                                                                                120
 (in € million)                                 9M 20/21     9M 19/20        Δ
                                                                                                        81              86
 Cash flow                                           86.4         80.7     + 5.7                 80
 Change in net working capital                       19.1         15.3     + 3.8

                                                                                                                                   *excl. financial investments
                                                                                                 40
 Net cash flow from operating activities            105.5         96.0     + 9.5
 Investments in property, plant et al.              -17.9        -19.6     + 1.7
                                                                                                  0
 Increase / decrease in financial receivables       -62.3        -36.5    - 25.8
                                                                                                             -20             -18
 Payments into current financial investments          0.0        -15.0    + 15.0                -40
                                                                                                          9M              9M
 Cash flow from investing activities                -80.2        -71.1     - 9.1                         19/20           20/21
 Cash flow from financing activities                -28.1        -15.7    - 12.4
                                                                                                      Net financial assets [M€]
 Exchange rate changes                                -0.1         1.5     - 1.6               200
                                                                                                                             165
 Change in cash and cash equivalents                  -3.0        10.7    - 13.7
                                                                                               150

                                                30/11/2020   30/11/2019      Δ
                                                                                               100                 90
 Net financial assets                               164.7         89.7    + 75.0
                                                                                                        56
                                                                                                50
◼ High cash outflow from increase in financial receivables
◼ Net financial assets rose to € 164.7 (89.7) million                                            0
                                                                                                      30/11/18 30/11/19 30/11/20

                                                                                   CropEnergies AG, January 2021             20
Outlook 2020/21

◼ Revenues expected between € 825 and € 855 (previous year: € 899) million

◼ Operating profit expected between € 95 to € 110 (previous year: € 104) million

◼ This corresponds to an EBITDA of € 135 to € 150 (previous year: € 146) million

                                                                            CropEnergies AG, January 2021   21
Financial Calendar                                                                                                          Contact
19 May 2021:                       Annual report and press and analysts’ conference                                         CropEnergies AG
                                   financial year 2020/21
                                                                                                                            Maximilianstraße 10
7 July 2021:                       Statement for the 1st quarter of 2021/22                                                 68165 Mannheim

13 July 2021:                      Annual General Meeting 2021                                                              www.cropenergies.com

13 October 2021:                   Report for the 1st half of 2021/22

12 January 2022:                   Statement for the 1st - 3rd quarter of 2021/22                                            Investor Relations                                Public Relations / Marketing

Stock Information                                                                                                            Heike Baumbach                                    Nadine Dejung-Custance
                                                                                                                             Phone: +49 (621) 71 41 90-30                      Phone: +49 (621) 71 41 90-65
ISIN:                             DE000A0LAUP1
                                                                                                                             ir@cropenergies.de                                presse@cropenergies.de
Symbol:                           CE2

Bloomberg / Reuters:              CE2 GY / CE2G.DE

Transparency standard:            Prime Standard
Disclaimer
This presentation contains forward-looking statements based on assumptions and estimates made by the executive board of CropEnergies AG. Although the executive board may be convinced that these assumptions and
estimates are reasonable, the future actual developments and future actual results may vary considerably from the assumptions and estimates due to many external and internal factors. For example, matters to be mentioned
in this connection include changes in the general economic conditions, competitive product and pricing pressures and developments in the regulatory framework. CropEnergies AG assumes no responsibility and accepts no
liability for future developments and future actual results achieved being the same as the assumptions and estimates included in this presentation. This presentation includes percentage and number rounding.
In addition, all disclaimers published on the CropEnergies website apply.

                                                                                                                                                                        CropEnergies AG, January 2021                         22
Thank you!

             CropEnergies AG, January 2021   23
You can also read