What's This, a Whole New World Economic Order in the Making? - 2019 May Fabio Sdogati, MIP Politecnico di Milano - Centro ...
←
→
Page content transcription
If your browser does not render page correctly, please read the page content below
What’s This,
a Whole New World Economic Order in the Making?

2019 May

Fabio Sdogati, sdogati@mip.polimi.it
MIP Politecnico di Milano
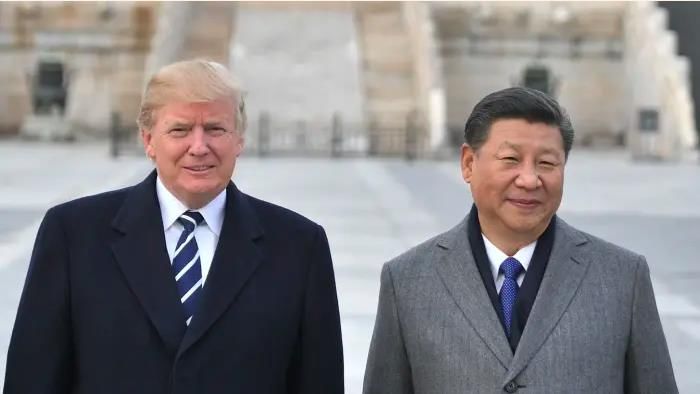
Table of Contents

0. Introductory evidence on the state of the economy

1. The Old World: 1955-2016 From National to Global Through International Fragmentation of
   Production

2. Belt and Road: 2013

3. Make America Great Again: 2016

4. From Global to Regional?

5. Conclusions

                                                                                             2
World conditions have deteriorated
and will continue doing so
World’s GDP (constant prices, % change):
6
5
4
3
2
1
0
2000 2001 2002 2003 2004 2005 2006 2007 2008 2009 2010 2011 2012 2013 2014 2015 2016 2017 2018 2019 2020 2021 2022 2023
-1
Source: IMF’s WEO, October 2018World conditions have deteriorated and
will continue doing so
World trade growth, YoY(exports, volumes, seasonally adjusted):
25%
20%
Average 2001-2008: +6%
15%
10%
Average 2011-2018: +3%
YoY growth rate
5%
0%
-5%
-10%
-15%
-20%
-25%
1 5 9 1 5 9 1 5 9 1 5 9 1 5 9 1 5 9 1 5 9 1 5 9 1 5 9 1 5 9 1 5 9 1 5 9 1 5 9 1 5 9 1 5 9 1 5 9 1 5 9 1 5 9
2001 2002 2003 2004 2005 2006 2007 2008 2009 2010 2011 2012 2013 2014 2015 2016 2017 2018
Source: World Trade Monitor, CPB Netherlands Bureau of Economic Policy AnalysisGrowth rates of GDP, major € countries, 2001-
2021
Expected cumulative rates of real GDP, 2001 – 2021:
30
24,9
25
21,2
20 18,5
17,3
15 13,6
10
5
2
0
-2,7
-5
Germania Paesi Bassi Spagna Austria Francia Grecia Italia
Source: Corriere della Sera on IMF’s WEO October 2018Table of Contents
0. Introductory evidence on the state of the economy
1. The Old World: 1955-2016 From National to Global Through
International Fragmentation of Production
2. Belt and Road: 2013
3. Make America Great Again: 2016
4. From Global to Regional?
5. Conclusions
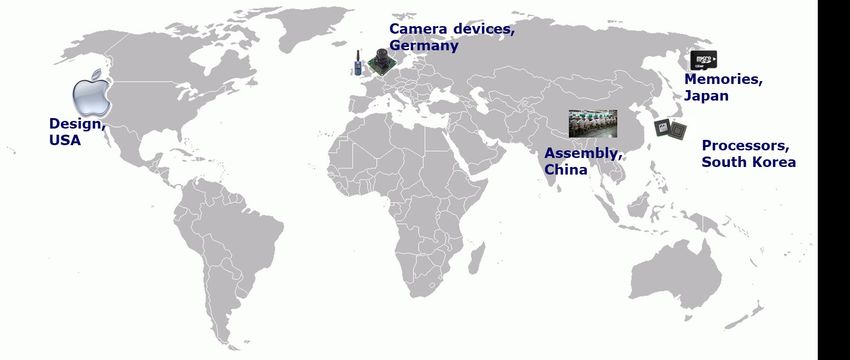
6International Fragmentation of Production and Global Value Chains
The Integration of Production has changed the international division of labor:
As recently as 30 years ago, products were assembled in one country, using
inputs from that same country. Measuring trade was thus easy. 2011 is very
different. Manufacturing is driven by global supply chains, while most
imports should be stamped “made globally”, not “made in China”, or
similar. This is not an academic distinction. (...) It isn’t just phones.
Automobiles, aircraft, electronics – even clothing – are increasingly made in
many countries. No car or commercial jet could now be built with inputs
from just one country. Business leaders also know that new trade frictions
are especially damaging in an era of global supply chains.
(Pascal Lamy, “Made in China’ tells us little about global trade”
January 24 2011, Financial Times)
7International Fragmentation of Production and Global Value Chains
Falling Falling Internet
protectionist transportation
pressures costs
1. 2.
Global
Global search for Global search for
competitive supply markets
factors of
prosuction chains
Growing growth rates in EM Falling rowth rates in high per
economies capita income countries
8International Fragmentation of Production and Global Value Chains
Share of Exported and Imported Intermediate Inputs Over Total Exports and
Imports Respectively, by Country, 2011
Singapore
Malaysia
Philippines
Indonesia
Korea
Japan
Hong Kong
Netherlands
United States
Ireland
Thailand Import
Czech Republic Export
India
Poland
Italy
Slovak Republic
United Kingdom
Germany
France
Mexico
China
0% 10% 20% 30% 40% 50% 60% 70% 80% 90%
Source: OECD, September 2017
9Trade in tasks: the case of the iPhone
Source: Dedrick, J., Kraemer, K. L., & Linden, G. (2010). The Distribution of Value in the Mobile Phone Supply
10Table of Contents
1. The Old World: 1955-2016 From National to Global Through International
Fragmentation of Production
2. Belt and Road: 2013
3. Make America Great Again: 2016
4. From Global to Regional?
5. Conclusions
12China’s proposed
Europa
Europa Belt & Road initiative
Centrale
Europa
Mar Mediterraneo
CINA
Golfo Persico
Asia
Meridionale
Asia Mar Cinese
Occidentale Meridionale
Asia
Sud Orientale
Oceano Indiano
Oceano Pacifico
Meridionale
Fonte: FMI e China’s National Bureau of StatisticsOne Belt, One Road Strategy in Action
Ranking of the countries with the highest share of outward FDI, 2016
United States 20,6%
China 12,6%
Netherlands 12,0%
Japan 10,0%
British Virgin Islands 6,5%
Canada 4,6%
China, Hong Kong SAR 4,3%
France 3,9%
Ireland 3,1%
Spain 2,9%
Germany 2,4% Source: UNCTAD
Luxembourg 2,2%
Switzerland 2,1%
Republic of Korea 1,9%
Russian Federation 1,9%
Cayman Islands 1,8%
Singapore 1,6%
Sweden 1,6%
Italy 1,6%
Finland 1,6%
0% 5% 10% 15% 20% 25%Table of Contents
1. The Old World: 1955-2016 From National to Global Through International
Fragmentation of Production
2. Belt and Road: 2013
3. Make America Great Again: 2016
4. From Global to Regional?
5. Conclusions
15Guerra commerciale o schermaglie commerciali: una cronologia delle azioni
dell’amministrazione Trump
Gennaio 2017 Gennaio 2018 1 giugno 2018 1 luglio 2018 – Canada 6 luglio 2018 4 agosto2018 -
Tariffe sulle importazioni Tariffa sulle importazioni Importazioni dalla Cina India
Trump non Trump annuncia da tutti i paesi dagli Stati Uniti (Lista 1) Importazioni dalla
partecipa al «America First»
• 25% su acciaio • Valore $13 miliardi • Valore di $50 miliardi Cina (Lista 1)
World Economic agenda al World
Forum di Davos Economic Forum importato • Tariffe: 25% sull’acciaio • Tariffa: 25% • Valore di $241
di Davos • 10% su alluminio e 10% su tutte le altre • Prodotti cinesi milioni miliardi
importato “commodity” industriali, prodotti non • Tariffa: 50%
Paesi esclusi: Corea del • Prodotti: acciaio, whisky, di consumo • Prodotti: motocicli
Sud, Brasile, Argentina, borse e altro ancora
Australia
23 gennaio 2017 22 giugno 2018 - 22 giugno 2018 – 7 luglio 2018 – Cina 30 agosto 2018
Messico Unione Europea Tariffa sulle importazioni Importazioni dalla Cina
Ritiro degli Stati Uniti dai (Lista 2)
Tariffa sulle importazioni Tariffa sulle importazioni dagli Stati Uniti
negoziati e dall'accordo di
Partenariato Trans-Pacifico dagli Stati Uniti dagli Stati Uniti • Valore $34 miliardi • Valore di $16 miliardi
• Valore di $3 miliardi • Valore €2.8 miliardi • Tariffa: 25% • Tariffa: 25%
• Tariffa 15%, 20%, 25% • Tariffe: 10%,25%, 50% • Prodotti: Elenco 1 che • Tecnologie industriali
• Prodotti:carne di maiale, • Prodotti: mais, grano, include 545 articoli rilevanti
formaggio, mele, succo d'arancia, mirtilli e
prosciutto, mirtilli rossi, altro ancora
patate, whiskey,
alluminio, acciaio,…
17Commercial Skirmishes or Commercial War? From NAFTA to USMCA
• On Augurst 27, 2018 the United States reached an agreement with Mexico meant to establish
new commercial rules originally making up the North America free Trade Agreement (NAFTA)
• There are two articoles of the Agreement that will likely strongly affect production and trade of
automobiles:
• 75% of the value of parts and componenets assembled in US cars and vehicles musy come from within
North America (local content requirement rule);
• Between 40 and 45 percent of of the value incorporated in a vehivle must originate in plants where
workers are receiving a gross wage of at least $ 16/h.
• What about Canada? Negotiations are ongoing…. And Mr. Trump has not made it a secret that
canada may be excluded from the Agreement.
18In the way of a conclusion
• The last 70 years have been characterized by the progressive liberalization of world trade in the
framework of the multilateralism desired by the USA
• With the Trump Presidency, a process of deep revision of US trade policy has begun, increasingly
characterized by decreasing degrees of multilateralism and the use of tariffs and trade restrictions
country by country
• The global distribution of the production chains makes the protectionist attack to a country an
element of concern for all its suppliers. It follows that the depressive effect of the duties on the
economy will not be limited to the target country alone
• We believe that the USMCA represents an important novelty in the way commercial policy will be
implemented in the years to come, and the way it will affect the global character of supply chains:
from globalization to regionalization
• We highlight these global risks and opportunities in the current macroeconomic scenario:
• The growth in world demand for goods and services will remain weak, and we believe that it will be in particular that coming
from the United States
• To diversify the end markets in a radical way, paying close attention to the emerging countries of South-East Asia, both as
importers, both as production places
• Investing in product innovation, as all manufacturers will try to differentiate their product (upwards) in order to 'circumvent'
the tariff barriers
19Suggested Readings
The comparative advantage and international specialization of countries
• Krugman, P. R., Obstfeld, M., and Melitz, M. J. (2014). International Economics: Theory and Policy.
• 10° Edition. Pearson International Edition [edizione italiana: Krugman, P. R., Obstfeld, M., and Melitz, M. J.
• (2012). Economia Internazionale 1 & 2. 5° Edizione. Hoepli].
International competitiveness of Italian firms
• Boeri, T., Faini, R., Ichino, A., Pisauro, G. and Scarpa, C. (2005). Oltre il Declino. Il Mulino.
• (suggested chapter: 1).
• Gallino, L. (2003). La Scomparsa dell’Italia Industriale. Einaudi.
• Saltari, E. and Travaglini, G. (2006). Le Radici del Declino Economico: Occupazione e Produttività in Italia
• nell'Ultimo Decennio. Utet.
• Giunta, A. and Rossi, S. (2017). Che cosa sa fare l’Italia. Laterza.
World production and new commerciali policies
• WTO (2017). Global Value Chain development report. Measuring and analyzing the impact of GVCs
on economic development. Available at: https://www.wto.org/english/res_e/booksp_e/gvcs_report_2017.pdf .
• Lamy, P. (2011). “Made in China” Tells Us Little about Global Trade. Financial Times, January, 24. Available at: http://www.ft.com/intl/cms/s/0/4d37374c-
27fd-11e0-8abc-00144feab49a.html .
• Baldwin, R. and Lopez-Gonzalez, J. (2015). Supply Chain Trade: a portrait of global patterns and several
testable hypotheses. The World Economy , 38 (11), 1682-1721.
• Langiu, D. and F. Sdogati, https://cm.alumni.polimi.it/news/could-a-regional-trade-deal-disrupt-global-supply-chains/
• Altomonte, C. (2012). L’internazionalizzazione. Via privilegiata alla crescita. Impresa & Stato, 94, 35-43.You can also read