Industry
Insights
A roundup of noteworthy foodservice findings
for the week of June 14, 2021
←
→
Page content transcription
If your browser does not render page correctly, please read the page content below
Industry Insights A roundup of noteworthy foodservice findings for the week of June 14, 2021
Drive new
                         business growth in
                         the noncommercial
                                   channel
                              Understand the unique needs of beyond
                               restaurant segments with Technomic’s
                                       Noncommercial Membership.

                                       info@technomic.com | technomic.com
© 2021 Technomic, Inc.
I G N I TE C O M PAN Y
Starbucks, Domino’s TOP CHAINS BY TOTAL U.S. NET UNIT OPENINGS
Lead Top 500 Chains Chain Name
2020 U.S.
Units
2020 U.S. Net New
Openings
Annual
Growth %
in 2020 Openings
Starbucks 15,337 288 1.9%
Domino's 6,355 229 3.7%
In a year that saw unprecedented chain achieved the highest number of new
Jersey Mike's Subs 1,854 189 11.4%
restaurant closures, many brands still unit openings, netting out 269 total new
managed to open new stores. Out of restaurant locations across the Top
the Top 500 chains, 164 grew their 500. Led by high-growth chains like Chick-fil-A 2,659 166 6.7%
location footprint in 2020 despite the Chick-fil-A, Popeyes Louisiana Kitchen
COVID-19 pandemic. and Wingstop, chicken restaurants Chipotle Mexican Grill 2,724 144 5.6%
grew their cumulative location footprint
Starbucks led the charge, opening 288
by 1.7% from the year prior. Popeyes Louisiana Kitchen 2,608 132 5.3%
units in 2020, registering a 1.9% uptick
in locations from the year prior.
Domino’s was close behind, ending Wingstop 1,359 128 10.4%
with 229 net openings in 2020. Kung Fu
Tea netted 74 store openings in 2020, Tropical Smoothie Cafe 914 80 9.6%
bringing its total to 292 in the U.S.
Overall, the chicken menu category Kung Fu Tea 292 74 33.9%
Panda Express 2,263 54 2.4%
Sources: Technomic Ignite Company
© 2021 Technomic, Inc. 3I G N I TE M E N U
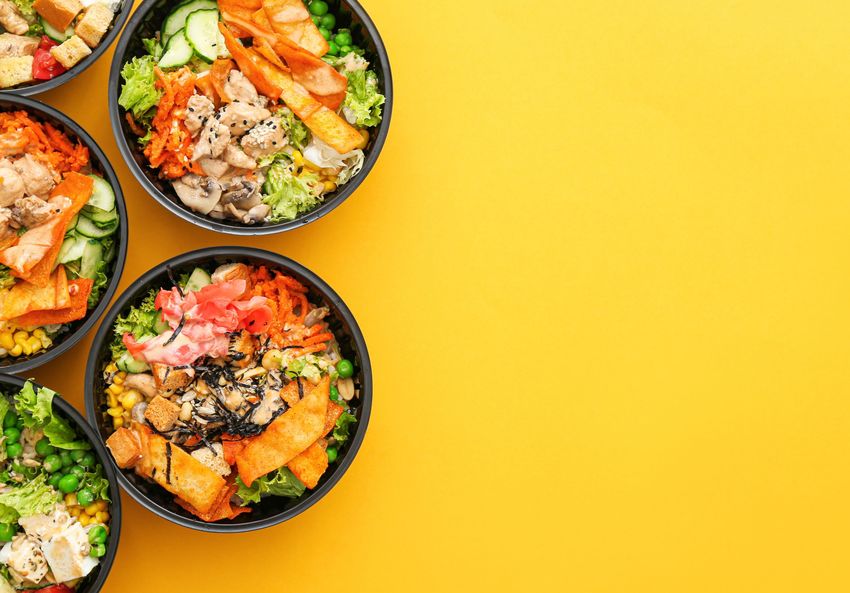
U.S. Operators Turn
to Poutine for
Breakfast
Poutine is a Canadian menu staple, these items in breakfast poutine to
with 29% of Canadian operators appeal to consumers looking for
menuing the potato, gravy and cheese traditional morning ingredients in less-
curds combination. In the U.S., common presentations.*
however, poutine is evidently less
Honey Salt Food and Drink in Las
popular (menued by just 1.3% of
Vegas, for example, offers Breakfast
operators), so the opportunity for
Poutine, featuring herb-roasted
innovation remains open. Enter
potatoes, bacon gravy, cheese curds
breakfast poutine.
and sunny-side Desert Bloom Farm
Operators are taking the base egg, while Bacon in Boise, Idaho,
components of poutine and adding in serves Bacon & Eggs Poutine with fries,
American-loved breakfast staples. cheese curds and southern gravy.
Some of consumers’ preferred
Traditional poutine shares commonalities
breakfast items are bacon (61% of
with the popular U.S. dish loaded fries
consumers purchase bacon away from
(menued by 5.0% of operators), so a
home for breakfast on the weekends),
breakfast poutine that’s “loaded” with
eggs (53%) and hash browns/potatoes
a.m. favorites could be a new iteration
(50%), so operators are combining
that wins consumers’ hearts.
Source: Technomic Ignite Menu, Q1 2020 to Q1 2021 Poutine topped with poached eggs and
*Base: 604 consumers ages 18+ (per weekpart) who purchase breakfast away from home hollandaise sauce
*Source: Technomic 2019 Breakfast Consumer Trend Report Image Source: Shutterstock
© 2021 Technomic, Inc. 4I G N I TE C O N S U M E R
SINCE THE RECENT PANDEMIC OCCURRED, HOW OFTEN DO YOU
ORDER FOOD FROM ANY TYPE OF RESTAURANT AND EITHER EAT IT AT
Restaurant
THE RESTAURANT, HAVE IT DELIVERED OR PICK IT UP AT THE
RESTAURANT TO EAT IT ELSEWHERE?
Frequency Improves
As the pandemic took hold early on in consumers report a steady decrease in 59% 55% 57% 60%
2020, Technomic’s Ignite Consumer the number who have stayed away from
program survey layered in additional restaurants over the past four quarters.
questions specific to consumer changes Once a week+
A rebound in overall frequency will be
resulting from COVID-19 and its impact 1-3 times per month
an essential ingredient for achieving
on foodservice usage. Through polling
best-case restaurant growth
consumers on their overall restaurant Less than once per month
projections, and Technomic will
order and visit frequency, Technomic
continue to closely monitor consumers’ Never
was able to gauge the pandemic’s
return to restaurants in the coming
impact on usage across the country.
quarters.
Since the peak of lockdowns and dining 27% 33%
31% 31%
room closures, there has been a
gradual increase in the number of
diners who patronize restaurants once
a week or more frequently. Additionally, 7%
9% 9% 9%
8%
3% 2% 2%
Q2 2020 Q3 2020 Q4 2020 Q1 2021
Base: 27,300 consumers ages 18+ per quarter
Source: Technomic Ignite Consumer brand ratings data
© 2021 Technomic, Inc. 5G L O B AL F O O D S E RV I C E N AV I G ATO R
# OF NEW MENU ITEMS
ADDED PER CHAIN
DURING 2020
LTO Battle: Asia Edition Asia Average 18.7
Thailand 27.9
South Korea 22.6
Menu development is crucial for chains on the average number of new products Thailand and South Korea come in at
to drive traffic and brand excitement in launched by leading chains throughout third and fourth, respectively, both Singapore 11.7
nearly every country globally—and no 2020 based on monthly LTO tracking easily outpacing the regional average.
more so than in Asia. among key sets of restaurants.
It’s key for operators to understand the Philippines 7.2
LTOs that express emerging trends, To set the baseline, in Asia overall, key importance of product development in-
dishes and drinks that showcase chains each rolled out about 18.5 new market as it indicates how competitive
seasonal ingredients, and innovative Items during 2020 on average. the local landscape is and how Malaysia 9.4
items that restaurants develop in house important it is to stay on top of emerging
Japan, to anyone familiar with the
all play into attracting both new and trends. Suppliers can leverage this Japan 38.8
market, is easily the champ in the Asia
existing guests. understanding to keep their pipeline
LTO battle with nearly double the
appropriately filled for the markets they
But the quantity of new products can region’s average. Indonesia
operate in. 15.1
vary widely by country—even when
China comes in second, with chains on
looking at the same brand’s menu Technomic tracks LTO activity across
the mainland launching about 32 new
across different markets. 25 markets globally and publishes data India 6.5
items apiece over the course of the
in its annual country reports.
Check out who wins the battle for LTO pandemic-stricken year.
supremacy in Asia. Findings are based China 32.3
Note: 320 chain menus tracked monthly in Asia across China, India, Indonesia, Japan, Malaysia, the Philippines,
Singapore, South Korea and Thailand from January 2020 to January 2021
Source: Technomic Global Foodservice Navigator Program
© 2020 Technomic, Inc. 6COVID-19 DISRUPTION INDEX
COVID-19
PERCENT PERCENT
COVID-19 Disruption Index is Change Versus Previous Week and TOP 5 MOST DISRUPTED MARKETS DISRUPTION
CHANGE CHANGE
powered by Shortest Track, utilizing AI, Month BY INDEX POINT CHANGE INDEX
VERSUS VERSUS
(VERSUS PREVIOUS WEEK) (MAX: 1.00, HIGH
machine learning and disparate sets of Change versus previous week/month DISRUPTION)
LAST WEEK LAST MONTH
data resources to quantify the potential allows users to see if the market is
risks that U.S. businesses face from the becoming more or less disrupted over
spread of the COVID-19 virus at the time. Changes that are positive (+)
market level. show a move toward becoming 1 Lexington-Fayette, Ky. .090 12.51% -7.53%
increasingly more impacted by COVID-
The highest index possible is 1.00, 19 (not good). Changes that are 2 Reading, Pa. 0.360 2.81% -17.11%
which is not good and reflects markets negative (-) show a trend toward being
that are extremely disrupted. The index less impacted by COVID-19 (good).
is updated on a weekly basis. 3 Springfield, Mo. 0.371 1.98% -22.71%
Ignite Subscribers: Download full
The COVID-19 Disruption Risk Index market report 4 Lebanon, Pa. 0.438 1.59% -19.12%
shares weekly updates through a
business lens, rather than a health lens,
and incorporates more than 20 different 5 Harrisburg-Carlisle, Pa. 0.452 1.46% -19.42%
data signals to measure disruption and
predict future impact. These signals
include infection rates, deaths, state-
level restrictions and social distancing
requirements, population densities and
mobility, group size limitations and
lifestyle risk factors contributing to
spread. More information is available
HERE.
Notes: Data updated June 8, 2021
Source: Shortest Track
© 2021 Technomic, Inc. 7WAN T M O R E I N S I G H T S ?
Since 1966, we have
You can get this Ignite Company Ignite Menu
produced in-depth
See where restaurant chains Pinpoint the latest menu trends
report delivered to are, how many units they have and see what’s on the horizon. research focused on the
you bi-weekly! and how well they’re doing.
Explore>>
Explore>>
foodservice industry.
Sign up here>>
We provide insights into consumer,
industry and menu trends in
the U.S., Canada and 23 countries
around the world.
Our team of experts helps leaders
Ignite Consumer Global Foodservice in the industry make complex
Get to know your customers’ Navigator business decisions, set strategy
customers through 60+ attributes Understand the global industry, and stay ahead of the curve.
and visit occasion metrics. from menu trends to consumers,
Explore>> in 25 countries. Explore>>
Have questions about this report?
Reach out to us today.
312-876-0004
info@technomic.com
technomic.com
© 2021 Technomic, Inc.You can also read