Industry Insights A roundup of noteworthy foodservice findings for the week of April 19, 2021 - Winsight
←
→
Page content transcription
If your browser does not render page correctly, please read the page content below
Industry Insights A roundup of noteworthy foodservice findings for the week of April 19, 2021
Discover major shifts in
      the Top 500 chain rankings
      We are excited to announce that the highly anticipated 2021
      Top 500 Chain Restaurant Report has been released!

© 2021 Technomic, Inc.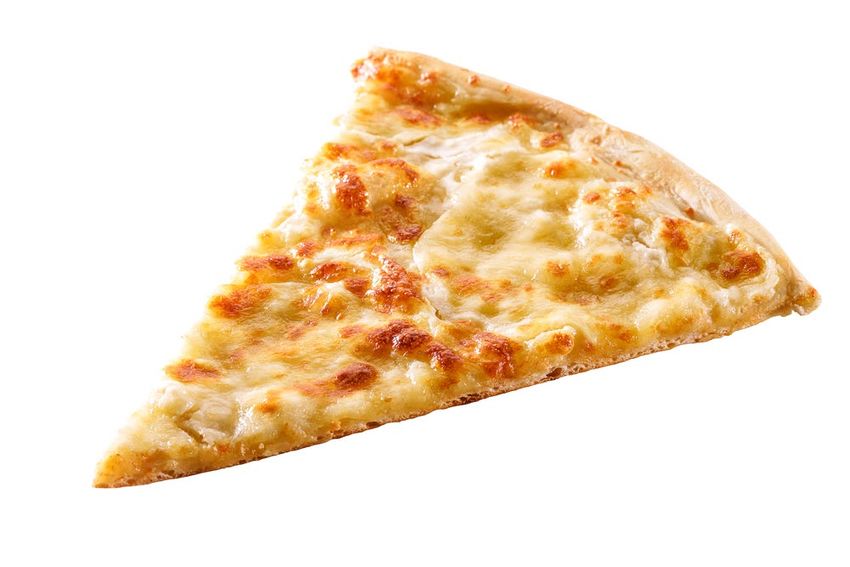
I G N I TE C O M PAN Y

Location count falls                                                                          TOP 500 CHAINS: U.S. LOCATION COUNT
                                                                                                  YEAR-OVER-YEAR CHANGE (%)

by 2% for the Top 500                                                                  2.0%

Chains                                                                                           1.2%
                                                                                                             0.8%
After years of sustained expansion, the     Despite the overall location decline
Top 500 largest chain restaurants           across the Top 500, several key players
experienced a cumulative U.S. location      still managed to grow their footprint in                                    0.3%
decline of 2% in 2020, resulting in a net   2020, including top chains like
loss of just under 4,500 locations.         Chick-fil-A, Domino’s and Jersey Mike’s
                                            Subs.
The Top 500 chain group ended 2020
with an overall U.S. location count of
225,558, declining from the prior year’s
count of 230,051.
From a segment perspective, location
closures were notably higher among
full-service chains, falling by 4.1% as
compared to a 1.7% decline for limited                                                                                              -2.0%
service.
                                                                                       2016       2017       2018       2019        2020

Sources: Technomic Ignite company data

© 2021 Technomic, Inc.                                                                                                                      3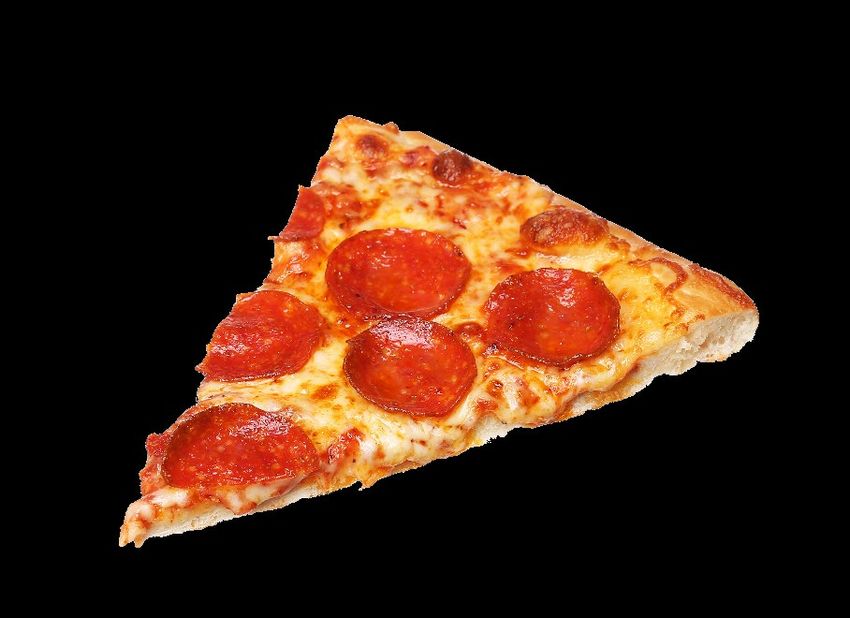
I G N I TE M E N U
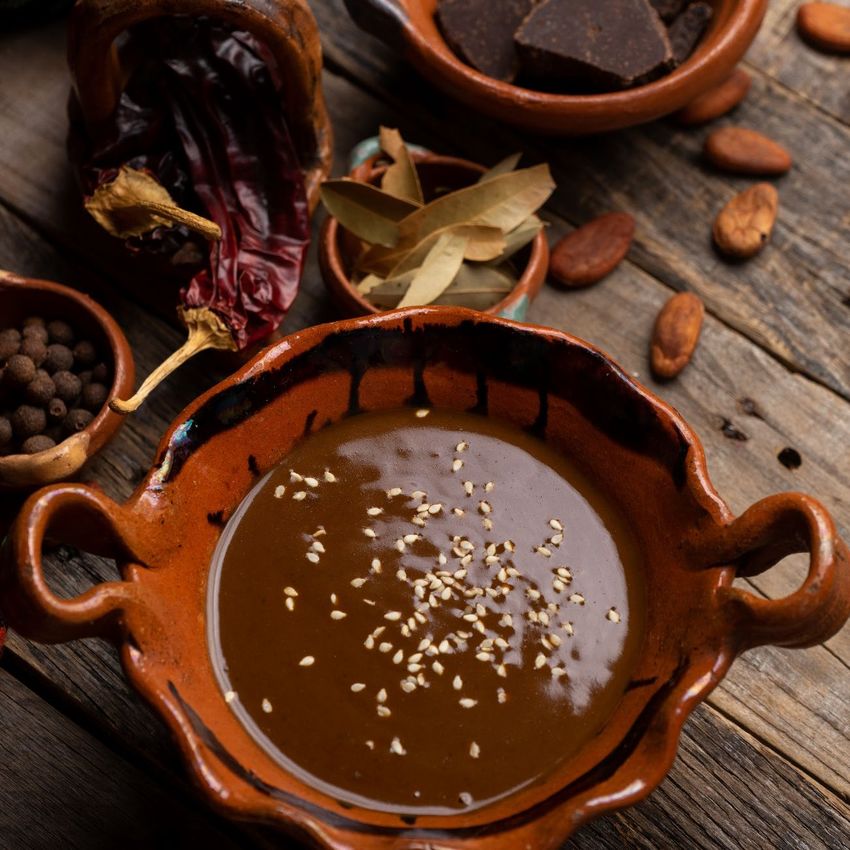
Saying ‘¡Ole!’ to
New Uses of Mole
Mole is quintessential Mexican fare. based cocktail at The Diver in Chicago
Used as both a marinade and a sauce to a coffee and Irish whiskey drink at
(and the name for a dish), mole typically WoodWind in Chicago.
contains fruit, chile pepper, nut and
La Llorona Cantina Mexicana in
spices. Moles are known for their
Philadelphia featured aged mole on
complex nature, rich flavor and general
chicken wings, one of the more
popularity.
popular dishes amid the pandemic.
At the end of 2020, Technomic
And mole vinaigrette is in a Belgian
predicted a resurgence of Mexican fare
endive and lacinato kale salad at Clarity
in new iterations in 2021. We’re already
in Vienna, Va., and a tuna poke bowl at
seeing this trend with many innovative
Foxcroft Wine Co. in Charlotte, N.C.
mole variations.
Clearly, operators are taking mole and
Here are a few examples:
repurposing it in other—often non-
With dominant notes of chocolate, Mexican—dishes. It will be interesting
cinnamon and spices, mole bitters to see how this plays out beyond
have popped up in everything from an independent restaurants or with other
Old-Fashioned at Better Half Coffee & treasured global ingredients.
Cocktails in Austin, Texas, to a mezcal- Image Source: Shutterstock
Source: Technomic Ignite Menu featuring the Technomic Emerging Eats report
© 2021 Technomic, Inc. 4I G N I TE C O N S U M E R
TOP-TWO BOX RATINGS
AGREE/STRONGLY AGREE
Consumers
Re-evaluate Value
68% 68%
67% 67% 67% 67%
66%
65%
61% 61% 61%
60% 60% 60%
59%
57%
A significant evolution of the overall many restaurant operators during the
consumer value mindset continued in great recession—consumers are pulling
the first quarter of 2021. away from this dollar-driven thinking.
50% 50% 50%
The ongoing tracking of consumer Consumers are interested in value, to 49% 49% 49%
48%
attitudes and behaviors captured within be sure. However, the value proposition
Ignite Consumer includes three core inherent in a wallet-first approach 46%
value-based attitudinal statements. The misses the opportunity to maximize
percentage of consumers who agreed check size, margins and loyalty with
with these statements started to decline premium offerings and more substantial
in the second quarter of last year, just bundling options.
as the COVID-19 pandemic began Q2 '19 Q3 '19 Q4 '19 Q1 '20 Q2 '20 Q3 '20 Q4 '20 Q1 '21
forcing changes that upended our daily
lives.
However, rather than focusing on price- I pay close attention to menu prices so I can find the best value for my money
based decisions—resulting in a “dollar
menu” strategy used extensively by I always compare prices before deciding what to buy
I usually pick restaurants with lower prices
Base: 27,300 consumers ages 18+ per period
Source: Technomic Ignite consumer data
© 2021 Technomic, Inc. 5G L O B AL F O O D S E RV I C E N AV I G ATO R
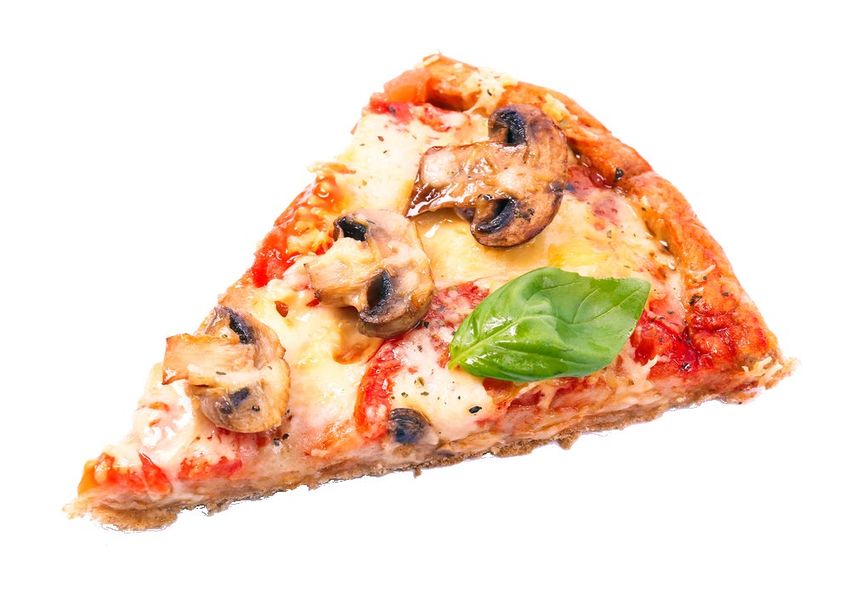
A Look at the World’s
Largest Pizza Chains
Pizza is popular—now, in the pandemic Leaders include well-known brands
era, perhaps more so than ever. It’s such as Pizza Hut (LSR in some
convenient, adaptable to myriad flavors markets, FSR in others and both in
and toppings, can be premium or many), Domino’s and Papa John’s.
budget, healthy or comforting and,
Ranked No. 6 among global pizza
importantly, highly suitable for delivery.
chains by unit count, South Africa-
Among Technomic’s Global 150 based Debonairs Pizza is the top brand
ranking of the largest global restaurant not based out of America. The South
chains by unit count, 11% are pizza or Africa-based chain is followed by
Italian/pizza. That’s a huge chunk Canada’s Pizza Pizza and the U.K.’s
relative to other major categories, on PizzaExpress (AKA PizzaMarzano in
par with burger (10.5%) and besting many parts of the world).
chicken (9.3%) and sandwich (3.3%).
Learn much more about the global
Not surprisingly, the vast majority (76%) pizza landscape from a post-pandemic
of the top pizza chains are limited perspective with Technomic’s new 2021
service, with four full serves on the list Global Pizza Category Report.
(all from Europe and North America).
Note: Global rankings by unit count;
Image Source: Shutterstock
Chains based in the United States must operate in two or more international markets and have a meaningful location
footprint outside of the U.S. to be eligible for inclusion
Source: Technomic Global Foodservice Navigator Program
© 2020 Technomic, Inc. 6COVID-19 DISRUPTION INDEX
COVID-19
PERCENT PERCENT
COVID-19 Disruption Index is Change Versus Previous Week and TOP 5 MOST DISRUPTED MARKETS DISRUPTION
CHANGE CHANGE
powered by Shortest Track, utilizing AI, Month BY INDEX POINT CHANGE INDEX
VERSUS VERSUS
(VERSUS PREVIOUS WEEK) (MAX: 1.00, HIGH
machine learning and disparate sets of Change versus previous week/month LAST WEEK LAST MONTH
DISRUPTION)
data resources to quantify the potential allows users to see if the market is
risks that U.S. businesses face from the becoming more or less disrupted over
spread of the COVID-19 virus at the time. Changes that are positive (+) 1 Santa Fe, N.M. 0.739 4.60% 1.96%
market level. show a move toward becoming
increasingly more impacted by COVID- 2 Albuquerque, N.M. 0.774 4.26% 1.72%
The highest index possible is 1.00, 19 (not good). Changes that are
which is not good and reflects markets negative (-) show a trend toward being 3 Modesto, Calif. 0.395 6.21% 12.02%
that are extremely disrupted. The index less impacted by COVID-19 (good).
is updated on a weekly basis. San Jose-Sunnyvale-
4 0.426 5.49% 10.60%
Ignite Subscribers: Download full Santa Clara, Calif.
The COVID-19 Disruption Risk Index market report
shares weekly updates through a 5 Santa Rosa, Calif. 0.432 5.27% 10.23%
business lens, rather than a health lens,
and incorporates more than 20 different
data signals to measure disruption and
predict future impact. These signals
include infection rates, deaths, state-
level restrictions and social distancing
requirements, population densities and
mobility, group size limitations and
lifestyle risk factors contributing to
spread. More information is available
HERE.
Notes: Data updated April 12, 2021
Source: Shortest Track
© 2021 Technomic, Inc. 7WAN T M O R E I N S I G H T S ?
Since 1966, we have
You can get this Ignite Company Ignite Menu
produced in-depth
See where restaurant chains Pinpoint the latest menu trends
report delivered to are, how many units they have and see what’s on the horizon. research focused on the
you bi-weekly! and how well they’re doing.
Explore>>
Explore>>
foodservice industry.
Sign up here>>
We provide insights into consumer,
industry and menu trends in
the U.S., Canada and 23 countries
around the world.
Our team of experts helps leaders
Ignite Consumer Global Foodservice in the industry make complex
Get to know your customers’ Navigator business decisions, set strategy
customers through 60+ attributes Understand the global industry, and stay ahead of the curve.
and visit occasion metrics. from menu trends to consumers,
Explore>> in 25 countries. Explore>>
Have questions about this report?
Reach out to us today.
312-876-0004
info@technomic.com
technomic.com
© 2021 Technomic, Inc.You can also read